
最新行情速看
814 Posts

最新行情速看
Report
Block User
Open Trade
Occasional Trader
5.6 Years
1 Following
62 Followers
70 Liked
Posts
Portfolio
All
Quotes
Videos
·
--
【See the Rise】
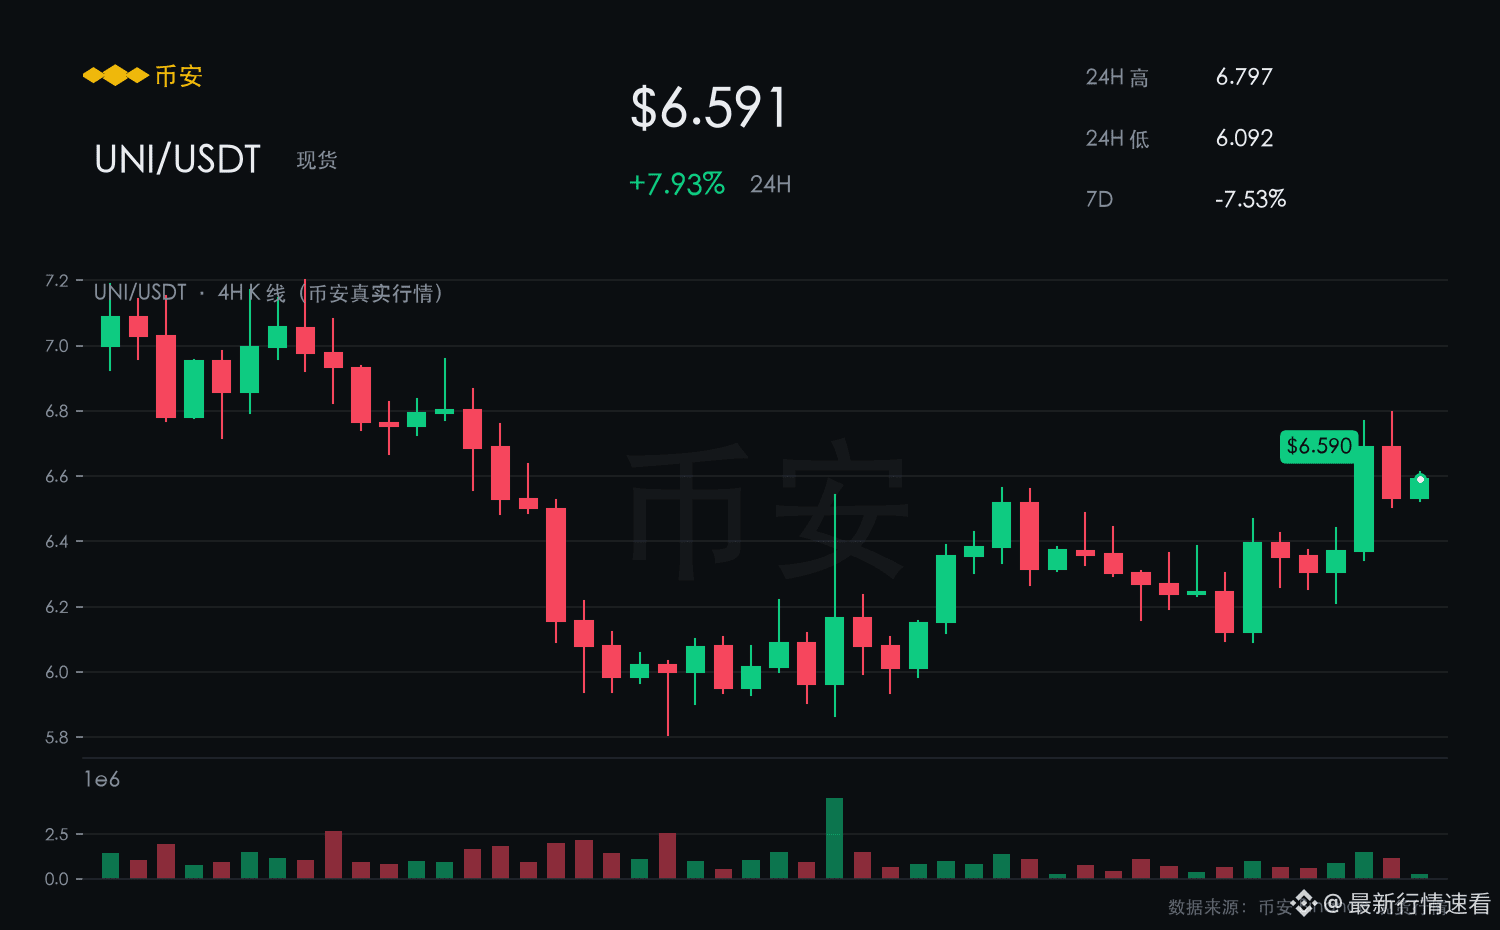
UNI is currently reported at 6.591, up 7.93% over the past 24 hours. The 7-day increase is 7.53%. The intraday range is 6.092–6.797, with a volatility of 11.6%.
【Market View】
This pullback in UNI is clearly resilient; its short-term strength ranks among the top in the market.
The support at 6.092 has held through two rounds of tests.
Compared with BTC’s +0.03%, UNI’s relative strength is leading—these assets are typically the vanguard of a rebound.
In the short term, the bias is bullish.
【Bullish Rationale】
A 7.93% gain over 24 hours combined with a 7.53% gain over 7 days shows continuity in the move rather than a one-day spike.
Within the 7.93% rise over 24 hours, the intraday high of 6.797 has been tested repeatedly, indicating that the overhead resistance is being digested.
Keep an eye on the broader market: if it turns and pulls back, UNI’s high-level holders’ positions could loosen at any time.
If it holds above 6.092, the next target is 6.797. Falling below 6.092 means the structure has turned weak.
$UNI #UNI
【See the Rise】
UNI is currently reported at 6.591, up 7.93% over the past 24 hours. The 7-day increase is 7.53%. The intraday range is 6.092–6.797, with a volatility of 11.6%.
【Market View】
This pullback in UNI is clearly resilient; its short-term strength ranks among the top in the market.
The support at 6.092 has held through two rounds of tests.
Compared with BTC’s +0.03%, UNI’s relative strength is leading—these assets are typically the vanguard of a rebound.
In the short term, the bias is bullish.
【Bullish Rationale】
A 7.93% gain over 24 hours combined with a 7.53% gain over 7 days shows continuity in the move rather than a one-day spike.
Within the 7.93% rise over 24 hours, the intraday high of 6.797 has been tested repeatedly, indicating that the overhead resistance is being digested.
Keep an eye on the broader market: if it turns and pulls back, UNI’s high-level holders’ positions could loosen at any time.
If it holds above 6.092, the next target is 6.797. Falling below 6.092 means the structure has turned weak.
$UNI #UNI
UNI is currently reported at 6.591, up 7.93% over the past 24 hours. The 7-day increase is 7.53%. The intraday range is 6.092–6.797, with a volatility of 11.6%.
【Market View】
This pullback in UNI is clearly resilient; its short-term strength ranks among the top in the market.
The support at 6.092 has held through two rounds of tests.
Compared with BTC’s +0.03%, UNI’s relative strength is leading—these assets are typically the vanguard of a rebound.
In the short term, the bias is bullish.
【Bullish Rationale】
A 7.93% gain over 24 hours combined with a 7.53% gain over 7 days shows continuity in the move rather than a one-day spike.
Within the 7.93% rise over 24 hours, the intraday high of 6.797 has been tested repeatedly, indicating that the overhead resistance is being digested.
Keep an eye on the broader market: if it turns and pulls back, UNI’s high-level holders’ positions could loosen at any time.
If it holds above 6.092, the next target is 6.797. Falling below 6.092 means the structure has turned weak.
$UNI #UNI
23
·
--
【See Growth】
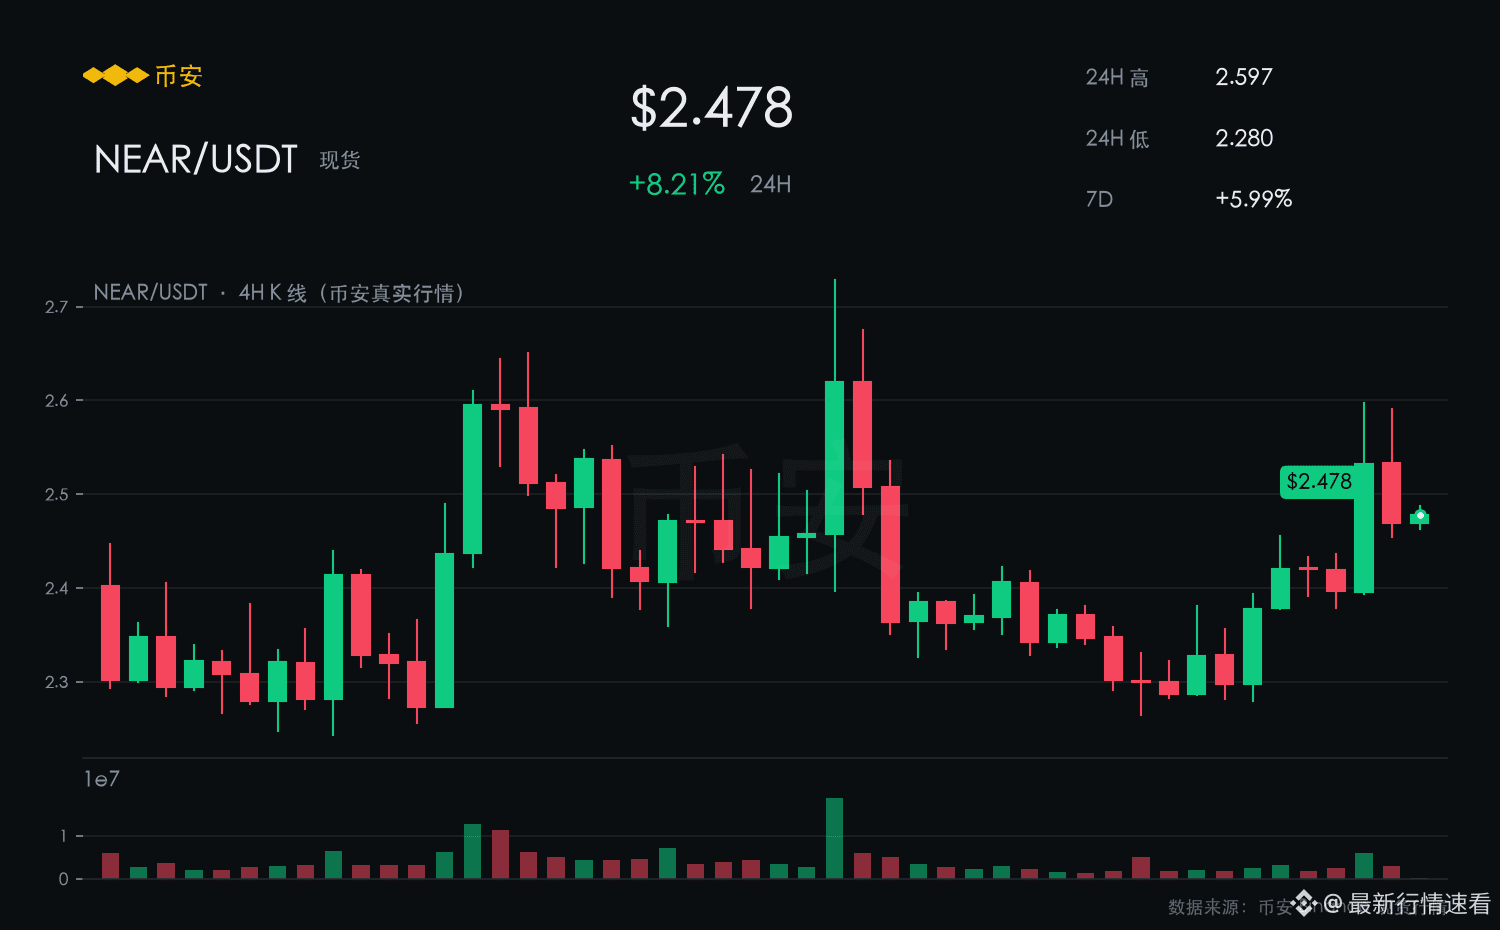
NEAR is currently priced at 2.478, up 8.21% over the past 24 hours. The 7-day increase is 5.99%. The intraday range is 2.280–2.597, with a volatility of 13.9%.
【Market View】
In a market where it’s trending down without catching up to the upside, NEAR is doing the opposite—going red over the last 24 hours shows the attitude.
As long as 2.280 holds, the current pullback counts as a strong consolidation.
Compared to the broader market, which is only +0.03% over the same period, NEAR’s +8.21% is an outperformance.
In the short term, the bias is bullish.
【Bullish Rationale】
A +8.21% move in 24 hours together with a +5.99% move over 7 days means the upside has continuity—it’s not just a one-day spike.
After the +5.99% space over 7 days is already played out, any pullback looks more like a change of hands rather than distribution.
Fast gains also imply fast retracements, so keeping a bit of room in positioning feels more comfortable than being fully allocated.
For trading: use 2.280 as the stop-loss level, and look for upside room to a breakout above 2.597.
$NEAR #NEAR
【See Growth】
NEAR is currently priced at 2.478, up 8.21% over the past 24 hours. The 7-day increase is 5.99%. The intraday range is 2.280–2.597, with a volatility of 13.9%.
【Market View】
In a market where it’s trending down without catching up to the upside, NEAR is doing the opposite—going red over the last 24 hours shows the attitude.
As long as 2.280 holds, the current pullback counts as a strong consolidation.
Compared to the broader market, which is only +0.03% over the same period, NEAR’s +8.21% is an outperformance.
In the short term, the bias is bullish.
【Bullish Rationale】
A +8.21% move in 24 hours together with a +5.99% move over 7 days means the upside has continuity—it’s not just a one-day spike.
After the +5.99% space over 7 days is already played out, any pullback looks more like a change of hands rather than distribution.
Fast gains also imply fast retracements, so keeping a bit of room in positioning feels more comfortable than being fully allocated.
For trading: use 2.280 as the stop-loss level, and look for upside room to a breakout above 2.597.
$NEAR #NEAR
NEAR is currently priced at 2.478, up 8.21% over the past 24 hours. The 7-day increase is 5.99%. The intraday range is 2.280–2.597, with a volatility of 13.9%.
【Market View】
In a market where it’s trending down without catching up to the upside, NEAR is doing the opposite—going red over the last 24 hours shows the attitude.
As long as 2.280 holds, the current pullback counts as a strong consolidation.
Compared to the broader market, which is only +0.03% over the same period, NEAR’s +8.21% is an outperformance.
In the short term, the bias is bullish.
【Bullish Rationale】
A +8.21% move in 24 hours together with a +5.99% move over 7 days means the upside has continuity—it’s not just a one-day spike.
After the +5.99% space over 7 days is already played out, any pullback looks more like a change of hands rather than distribution.
Fast gains also imply fast retracements, so keeping a bit of room in positioning feels more comfortable than being fully allocated.
For trading: use 2.280 as the stop-loss level, and look for upside room to a breakout above 2.597.
$NEAR #NEAR
2
·
--
【See Rising】
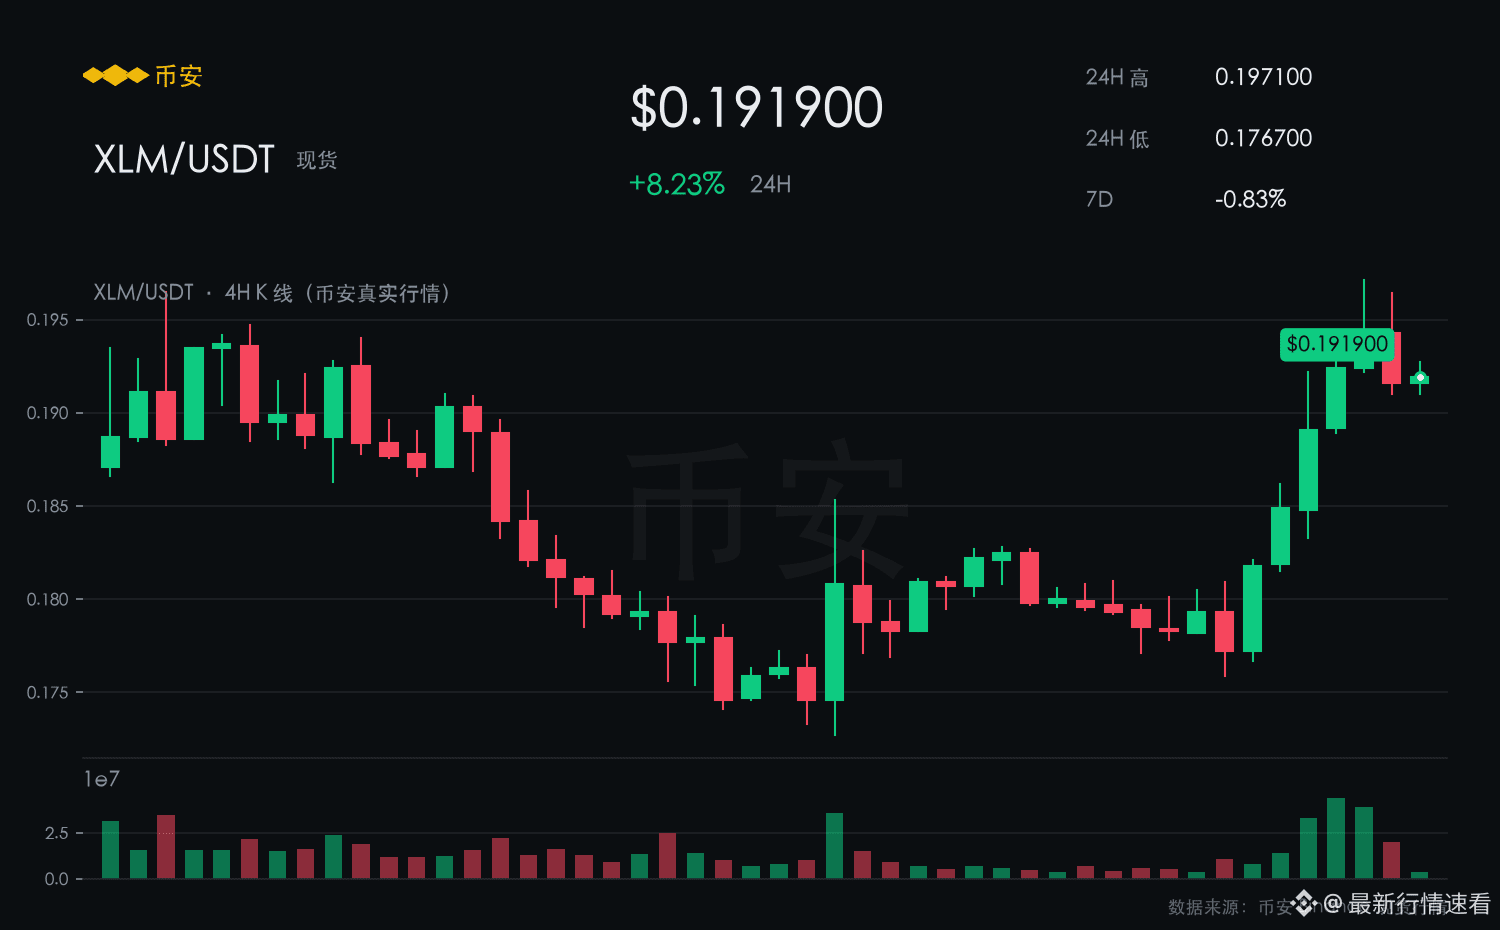
XLM current price 0.1919, up 8.23% in the past 24 hours; up 0.83% over the past 7 days. Intraday range 0.1767–0.1971, with a 11.5% amplitude.
【Market Snapshot】
XLM’s trend is clearly decoupled from the broader market and is following its own rhythm.
The 0.1767 level has been tested and retested without breaking; pullbacks have been met with strong follow-through.
Over the same period, BTC is up just +0.03% in 24 hours, while XLM’s +8.23% clearly outperforms the market—showing higher preference for XLM.
Near term, it leans bullish.
【Bullish Rationale】
From 0.1767 pushing up to around 0.1919, the 7-day slope of 0.83% is there for everyone to see—the trend hasn’t finished yet.
In the 24-hour rally of 8.23%, the intraday high of 0.1971 has been tested repeatedly, indicating overhead resistance is being digested.
Fast gains also mean fast pullbacks, so leaving a bit of room in position size feels more comfortable than going all-in.
Near-term resistance is at 0.1971—break it with volume and then you can follow. 0.1767 is the long-side defense level for this move.
$XLM #XLM
【See Rising】
XLM current price 0.1919, up 8.23% in the past 24 hours; up 0.83% over the past 7 days. Intraday range 0.1767–0.1971, with a 11.5% amplitude.
【Market Snapshot】
XLM’s trend is clearly decoupled from the broader market and is following its own rhythm.
The 0.1767 level has been tested and retested without breaking; pullbacks have been met with strong follow-through.
Over the same period, BTC is up just +0.03% in 24 hours, while XLM’s +8.23% clearly outperforms the market—showing higher preference for XLM.
Near term, it leans bullish.
【Bullish Rationale】
From 0.1767 pushing up to around 0.1919, the 7-day slope of 0.83% is there for everyone to see—the trend hasn’t finished yet.
In the 24-hour rally of 8.23%, the intraday high of 0.1971 has been tested repeatedly, indicating overhead resistance is being digested.
Fast gains also mean fast pullbacks, so leaving a bit of room in position size feels more comfortable than going all-in.
Near-term resistance is at 0.1971—break it with volume and then you can follow. 0.1767 is the long-side defense level for this move.
$XLM #XLM
XLM current price 0.1919, up 8.23% in the past 24 hours; up 0.83% over the past 7 days. Intraday range 0.1767–0.1971, with a 11.5% amplitude.
【Market Snapshot】
XLM’s trend is clearly decoupled from the broader market and is following its own rhythm.
The 0.1767 level has been tested and retested without breaking; pullbacks have been met with strong follow-through.
Over the same period, BTC is up just +0.03% in 24 hours, while XLM’s +8.23% clearly outperforms the market—showing higher preference for XLM.
Near term, it leans bullish.
【Bullish Rationale】
From 0.1767 pushing up to around 0.1919, the 7-day slope of 0.83% is there for everyone to see—the trend hasn’t finished yet.
In the 24-hour rally of 8.23%, the intraday high of 0.1971 has been tested repeatedly, indicating overhead resistance is being digested.
Fast gains also mean fast pullbacks, so leaving a bit of room in position size feels more comfortable than going all-in.
Near-term resistance is at 0.1971—break it with volume and then you can follow. 0.1767 is the long-side defense level for this move.
$XLM #XLM
80
·
--
【See Rise】
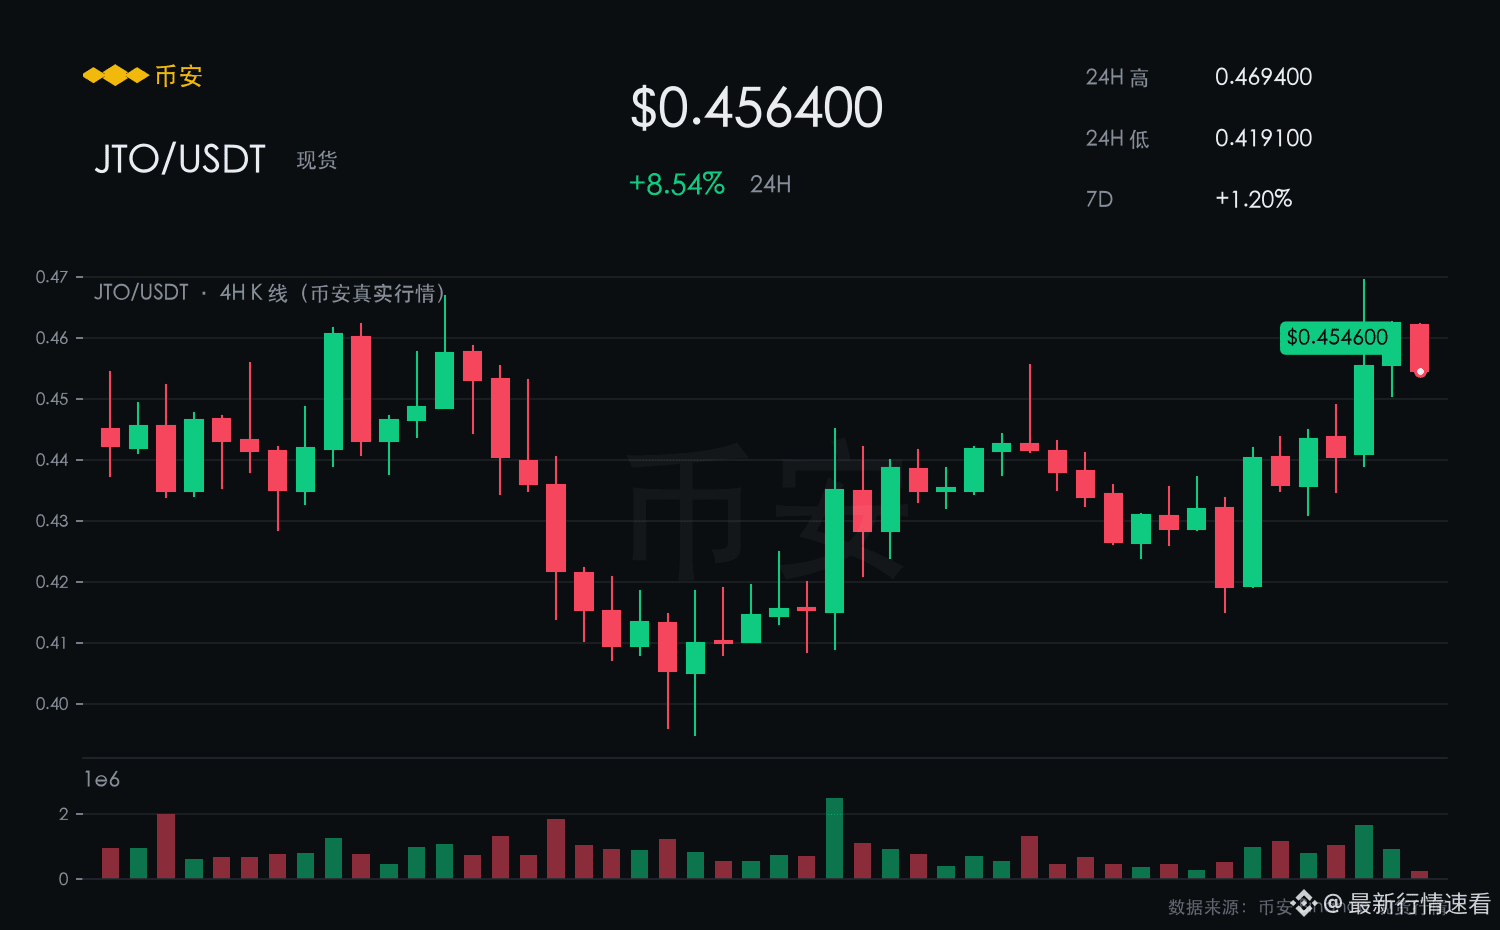
JTO is currently reported at 0.4564, up 8.54% over the past 24 hours. The 7-day increase is 1.20%. The intraday range is 0.4191–0.4694, with a volatility of 12.0%.
【Market View】
The focus of the recent few 4-hour K-lines has been steadily rising, suggesting fairly clear signs of long-side control.
After the price moved away from 0.4191, it has not broken down; the overall room for pullbacks remains manageable.
During the same period, BTC is up +0.03% over 24 hours, while JTO’s +8.54% clearly outperforms the broader market, indicating higher capital preference.
In the short term, it is leaning bullish.
【Bullish Rationale】
The 24-hour +8.54% and the 7-day +1.20% are in the same direction—short-term momentum and the medium-term trend are not fighting each other.
With pullbacks having support and breakouts with volume, this kind of pace is more sustainable than a straight-line surge.
The risk is that after the short-term rise, profit-taking may happen at any time, and chasing can easily get “pinned.”
In terms of strategy, use 0.4191 as the stop-loss level, and look for a breakout opportunity toward 0.4694.
$JTO #JTO
【See Rise】
JTO is currently reported at 0.4564, up 8.54% over the past 24 hours. The 7-day increase is 1.20%. The intraday range is 0.4191–0.4694, with a volatility of 12.0%.
【Market View】
The focus of the recent few 4-hour K-lines has been steadily rising, suggesting fairly clear signs of long-side control.
After the price moved away from 0.4191, it has not broken down; the overall room for pullbacks remains manageable.
During the same period, BTC is up +0.03% over 24 hours, while JTO’s +8.54% clearly outperforms the broader market, indicating higher capital preference.
In the short term, it is leaning bullish.
【Bullish Rationale】
The 24-hour +8.54% and the 7-day +1.20% are in the same direction—short-term momentum and the medium-term trend are not fighting each other.
With pullbacks having support and breakouts with volume, this kind of pace is more sustainable than a straight-line surge.
The risk is that after the short-term rise, profit-taking may happen at any time, and chasing can easily get “pinned.”
In terms of strategy, use 0.4191 as the stop-loss level, and look for a breakout opportunity toward 0.4694.
$JTO #JTO
JTO is currently reported at 0.4564, up 8.54% over the past 24 hours. The 7-day increase is 1.20%. The intraday range is 0.4191–0.4694, with a volatility of 12.0%.
【Market View】
The focus of the recent few 4-hour K-lines has been steadily rising, suggesting fairly clear signs of long-side control.
After the price moved away from 0.4191, it has not broken down; the overall room for pullbacks remains manageable.
During the same period, BTC is up +0.03% over 24 hours, while JTO’s +8.54% clearly outperforms the broader market, indicating higher capital preference.
In the short term, it is leaning bullish.
【Bullish Rationale】
The 24-hour +8.54% and the 7-day +1.20% are in the same direction—short-term momentum and the medium-term trend are not fighting each other.
With pullbacks having support and breakouts with volume, this kind of pace is more sustainable than a straight-line surge.
The risk is that after the short-term rise, profit-taking may happen at any time, and chasing can easily get “pinned.”
In terms of strategy, use 0.4191 as the stop-loss level, and look for a breakout opportunity toward 0.4694.
$JTO #JTO
5
·
--
【See Rise】
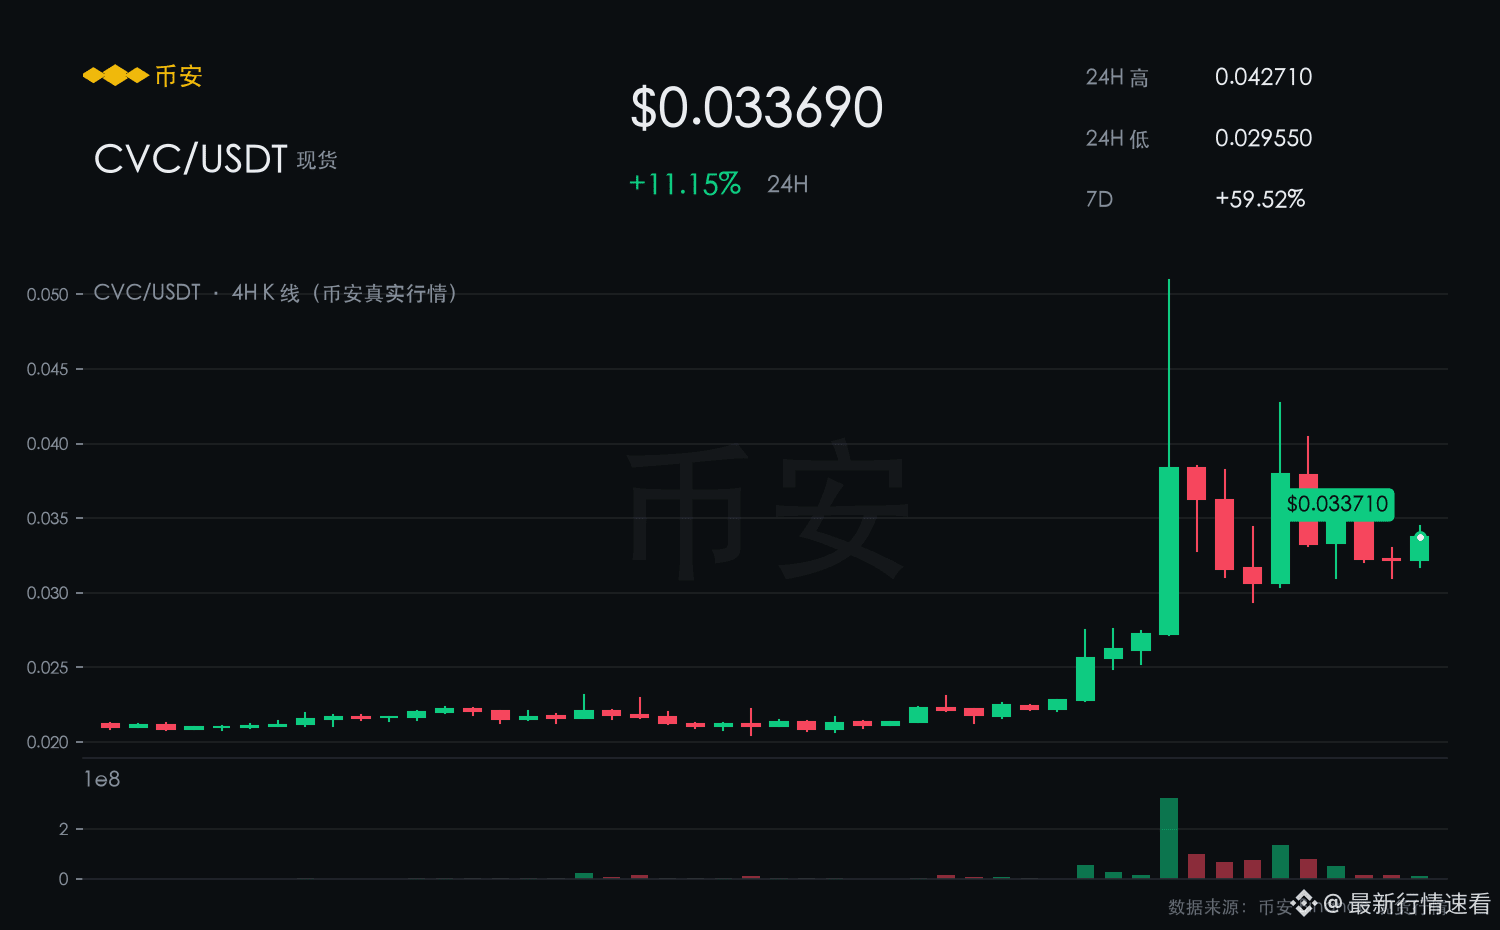
CVC current price is 0.0337; it is up 11.15% over the past 24 hours, with a 59.52% gain over 7 days, ranging intraday from 0.0295–0.0427.
The price is consolidating within the 0.0295–0.0427 intraday range; the lows are gradually rising, and there are clear signs that the long side is controlling the market.
The 0.0295 level has been tested multiple times without breaking; pullbacks are met with strong buying support.
In the short term, it is tilted bullish.
【Bullish Rationale】
A 24-hour gain of 11.15% together with a 7-day gain of 59.52% suggests continuous capital inflow rather than a one-day spike.
For the rebound, first look at the intraday high of 0.0427; once it breaks effectively, new upside space will open.
$CVC #CVC
【See Rise】
CVC current price is 0.0337; it is up 11.15% over the past 24 hours, with a 59.52% gain over 7 days, ranging intraday from 0.0295–0.0427.
The price is consolidating within the 0.0295–0.0427 intraday range; the lows are gradually rising, and there are clear signs that the long side is controlling the market.
The 0.0295 level has been tested multiple times without breaking; pullbacks are met with strong buying support.
In the short term, it is tilted bullish.
【Bullish Rationale】
A 24-hour gain of 11.15% together with a 7-day gain of 59.52% suggests continuous capital inflow rather than a one-day spike.
For the rebound, first look at the intraday high of 0.0427; once it breaks effectively, new upside space will open.
$CVC #CVC
CVC current price is 0.0337; it is up 11.15% over the past 24 hours, with a 59.52% gain over 7 days, ranging intraday from 0.0295–0.0427.
The price is consolidating within the 0.0295–0.0427 intraday range; the lows are gradually rising, and there are clear signs that the long side is controlling the market.
The 0.0295 level has been tested multiple times without breaking; pullbacks are met with strong buying support.
In the short term, it is tilted bullish.
【Bullish Rationale】
A 24-hour gain of 11.15% together with a 7-day gain of 59.52% suggests continuous capital inflow rather than a one-day spike.
For the rebound, first look at the intraday high of 0.0427; once it breaks effectively, new upside space will open.
$CVC #CVC
·
--
【See Decline】
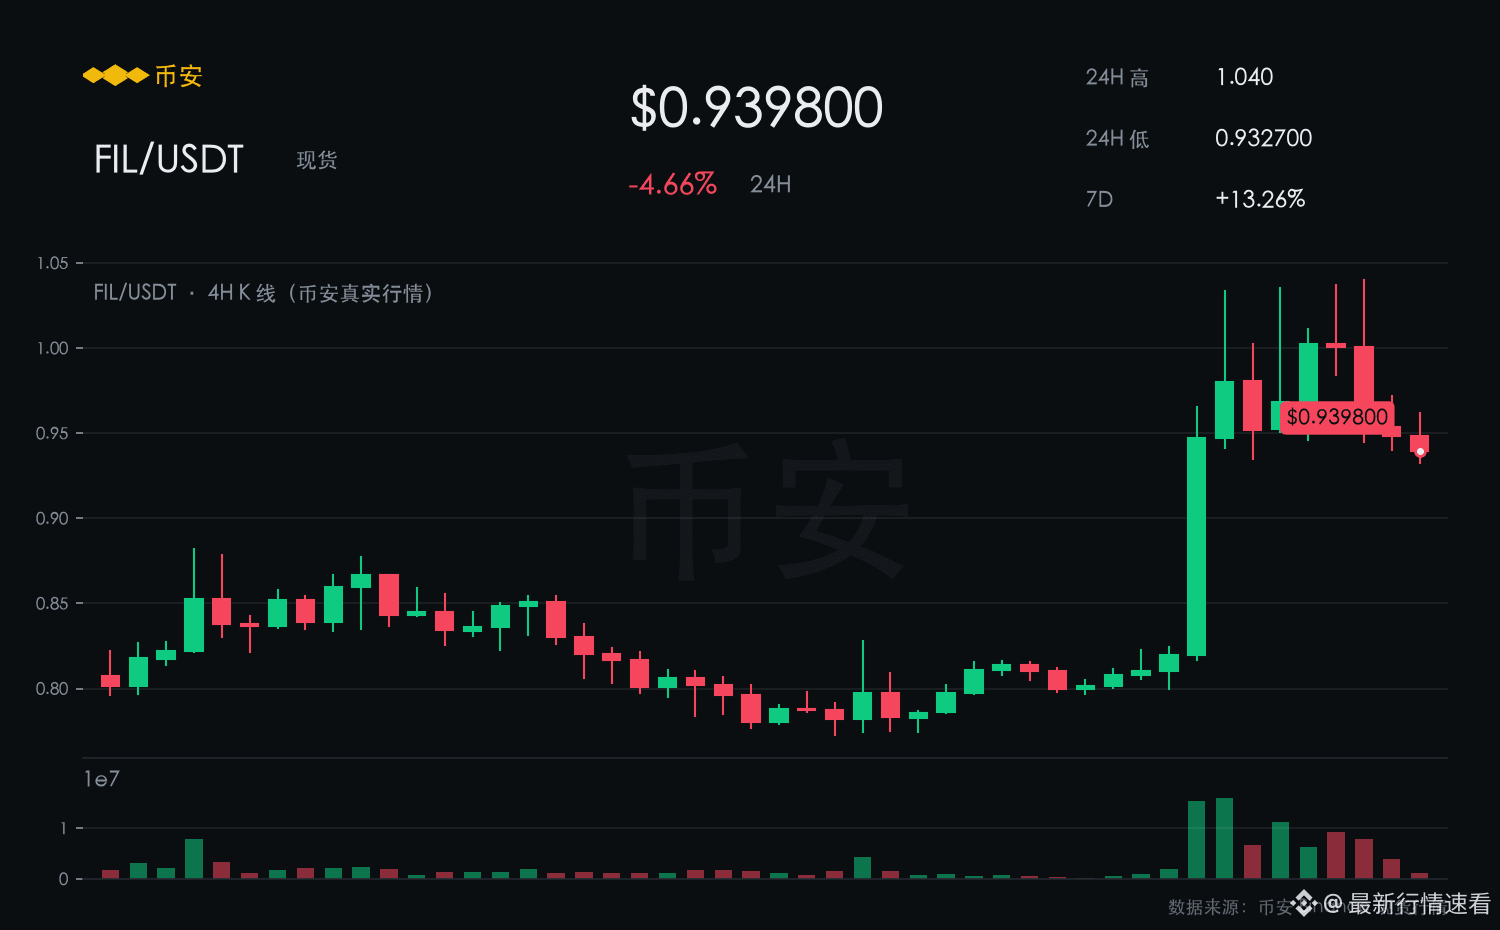
FIL current price 0.9398, down 4.66% in 24 hours, still down 13.26% over 7 days, with an intraday range of 0.9327–1.040.
FIL intraday range is 0.9327–1.040; the rebound has no volume, and the 7-day candles are still closing bearish.
A single-day rebound has not reversed the weekly weakness; selling pressure is still being released continuously.
In the short term, it is biased bearish.
【Bearish Rationale】
Against the backdrop of a 13.26% weekly decline over 7 days, a single-day small green candle can only be treated as a weak rebound.
Once 0.9327 is broken, it will continue downward to find support.
$FIL #FIL
【See Decline】
FIL current price 0.9398, down 4.66% in 24 hours, still down 13.26% over 7 days, with an intraday range of 0.9327–1.040.
FIL intraday range is 0.9327–1.040; the rebound has no volume, and the 7-day candles are still closing bearish.
A single-day rebound has not reversed the weekly weakness; selling pressure is still being released continuously.
In the short term, it is biased bearish.
【Bearish Rationale】
Against the backdrop of a 13.26% weekly decline over 7 days, a single-day small green candle can only be treated as a weak rebound.
Once 0.9327 is broken, it will continue downward to find support.
$FIL #FIL
FIL current price 0.9398, down 4.66% in 24 hours, still down 13.26% over 7 days, with an intraday range of 0.9327–1.040.
FIL intraday range is 0.9327–1.040; the rebound has no volume, and the 7-day candles are still closing bearish.
A single-day rebound has not reversed the weekly weakness; selling pressure is still being released continuously.
In the short term, it is biased bearish.
【Bearish Rationale】
Against the backdrop of a 13.26% weekly decline over 7 days, a single-day small green candle can only be treated as a weak rebound.
Once 0.9327 is broken, it will continue downward to find support.
$FIL #FIL
114
·
--
【See Decline】
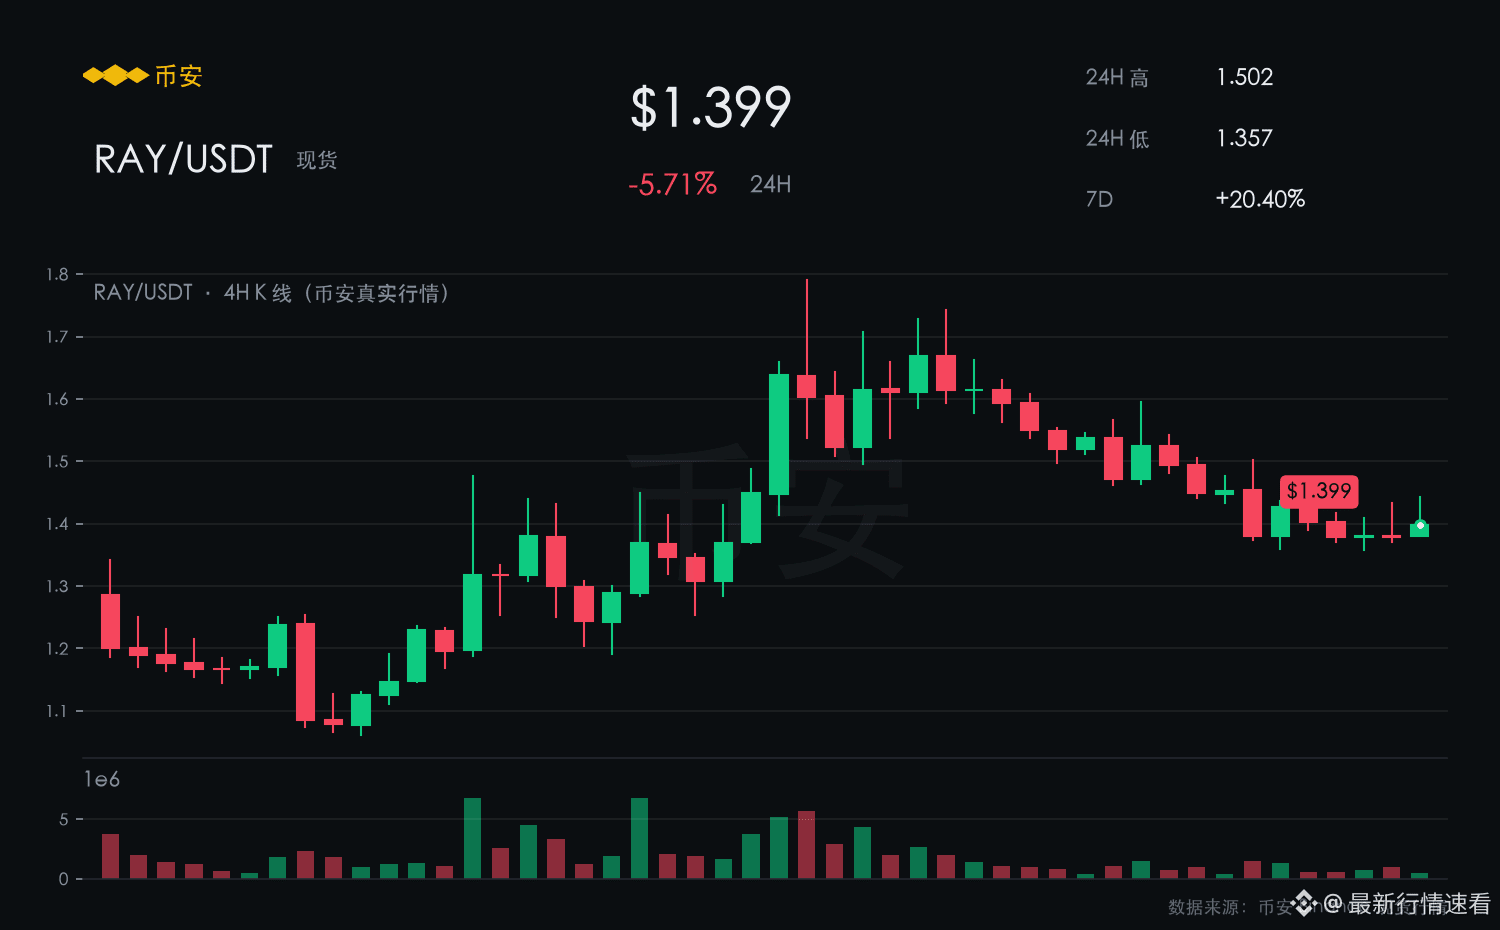
RAY is currently quoted at 1.399, down 5.71% over the past 24 hours, still down 20.40% over the past 7 days, with an intraday range of 1.357–1.502。
RAY’s intraday range is 1.357–1.502; the rebound lacks volume, and the 7-day line is still closing in the red。
The support at 1.357 hasn’t been tested with real volume and price, so there’s not enough confidence.
In the short term, it is more inclined to be bearish.
【Bearish Reasons】
The most painful thing is the catch-up decline after the trend stocks—RAY’s 7-day drop of 20.40% hasn’t fully played out yet.
Once 1.357 breaks, it will continue searching for support lower.
$RAY #RAY
【See Decline】
RAY is currently quoted at 1.399, down 5.71% over the past 24 hours, still down 20.40% over the past 7 days, with an intraday range of 1.357–1.502。
RAY’s intraday range is 1.357–1.502; the rebound lacks volume, and the 7-day line is still closing in the red。
The support at 1.357 hasn’t been tested with real volume and price, so there’s not enough confidence.
In the short term, it is more inclined to be bearish.
【Bearish Reasons】
The most painful thing is the catch-up decline after the trend stocks—RAY’s 7-day drop of 20.40% hasn’t fully played out yet.
Once 1.357 breaks, it will continue searching for support lower.
$RAY #RAY
RAY is currently quoted at 1.399, down 5.71% over the past 24 hours, still down 20.40% over the past 7 days, with an intraday range of 1.357–1.502。
RAY’s intraday range is 1.357–1.502; the rebound lacks volume, and the 7-day line is still closing in the red。
The support at 1.357 hasn’t been tested with real volume and price, so there’s not enough confidence.
In the short term, it is more inclined to be bearish.
【Bearish Reasons】
The most painful thing is the catch-up decline after the trend stocks—RAY’s 7-day drop of 20.40% hasn’t fully played out yet.
Once 1.357 breaks, it will continue searching for support lower.
$RAY #RAY
·
--
【See Decline】
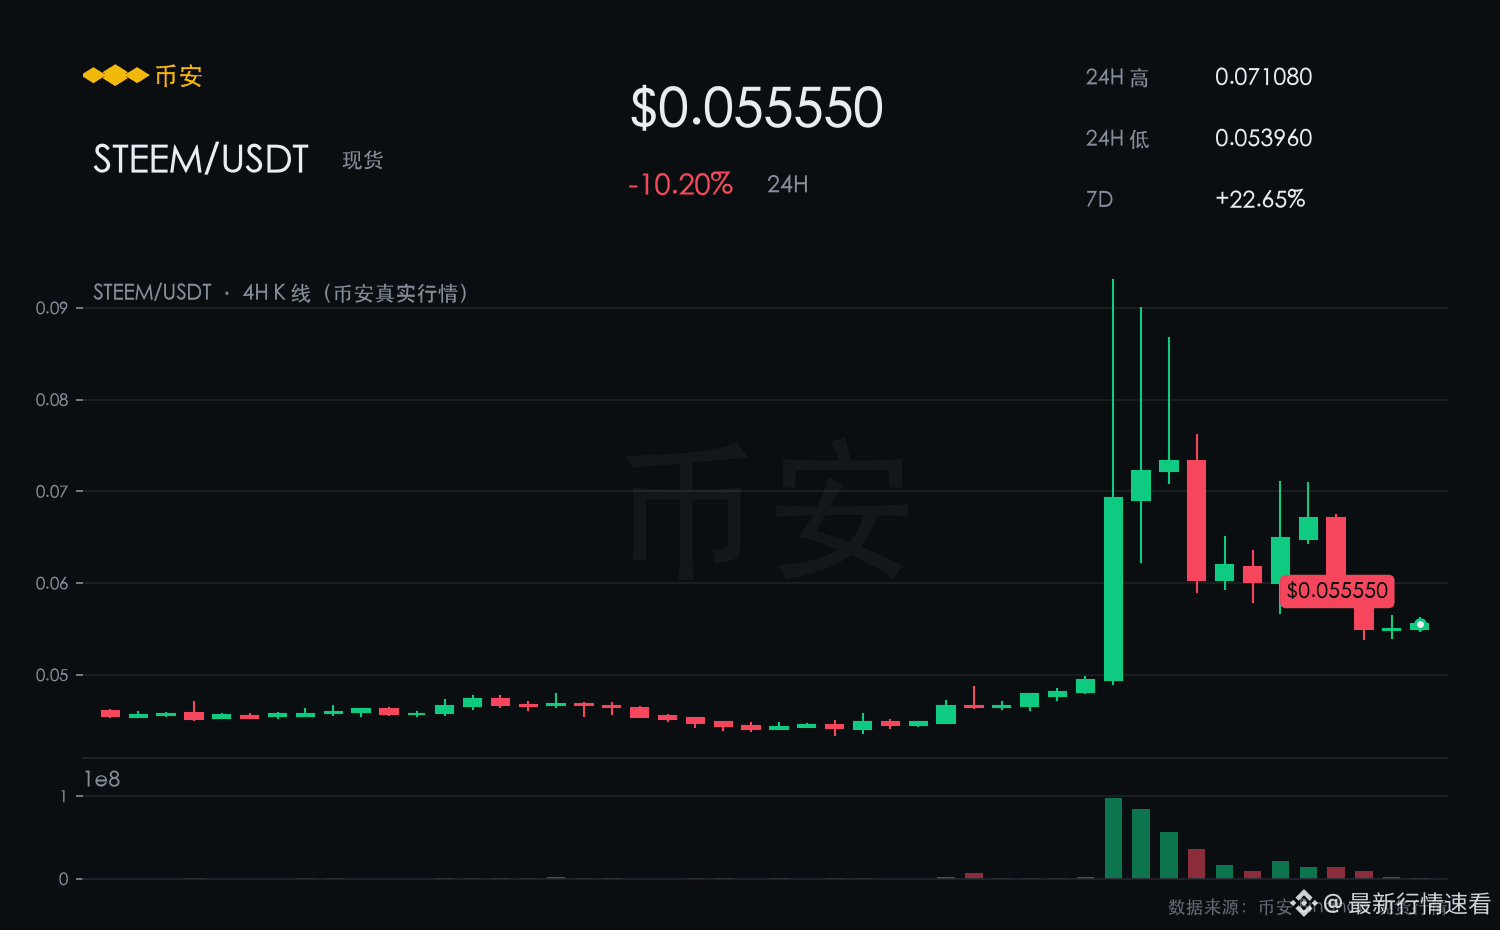
STEEM spot price is 0.0556, down 10.20% over the past 24 hours, still down 22.65% over 7 days, with an intraday range of 0.0540–0.0711.
STEEM is down 10.20% over 24 hours; after rebounding to around 0.0711, it was pushed back down again. The density of overhead trapped-seller orders is high.
A single-day rebound has not reversed the weak weekly trend, and selling pressure continues to release.
Bearish in the short term.
【Reasons for Bearishness】
The 10.20% drop over 24 hours indicates that aggressive selling has not yet exhausted.
For the short term, first watch whether 0.0540 can hold. If it breaks, don’t catch a falling knife.
$STEEM #STEEM
【See Decline】
STEEM spot price is 0.0556, down 10.20% over the past 24 hours, still down 22.65% over 7 days, with an intraday range of 0.0540–0.0711.
STEEM is down 10.20% over 24 hours; after rebounding to around 0.0711, it was pushed back down again. The density of overhead trapped-seller orders is high.
A single-day rebound has not reversed the weak weekly trend, and selling pressure continues to release.
Bearish in the short term.
【Reasons for Bearishness】
The 10.20% drop over 24 hours indicates that aggressive selling has not yet exhausted.
For the short term, first watch whether 0.0540 can hold. If it breaks, don’t catch a falling knife.
$STEEM #STEEM
STEEM spot price is 0.0556, down 10.20% over the past 24 hours, still down 22.65% over 7 days, with an intraday range of 0.0540–0.0711.
STEEM is down 10.20% over 24 hours; after rebounding to around 0.0711, it was pushed back down again. The density of overhead trapped-seller orders is high.
A single-day rebound has not reversed the weak weekly trend, and selling pressure continues to release.
Bearish in the short term.
【Reasons for Bearishness】
The 10.20% drop over 24 hours indicates that aggressive selling has not yet exhausted.
For the short term, first watch whether 0.0540 can hold. If it breaks, don’t catch a falling knife.
$STEEM #STEEM
1
·
--
【See Drop】
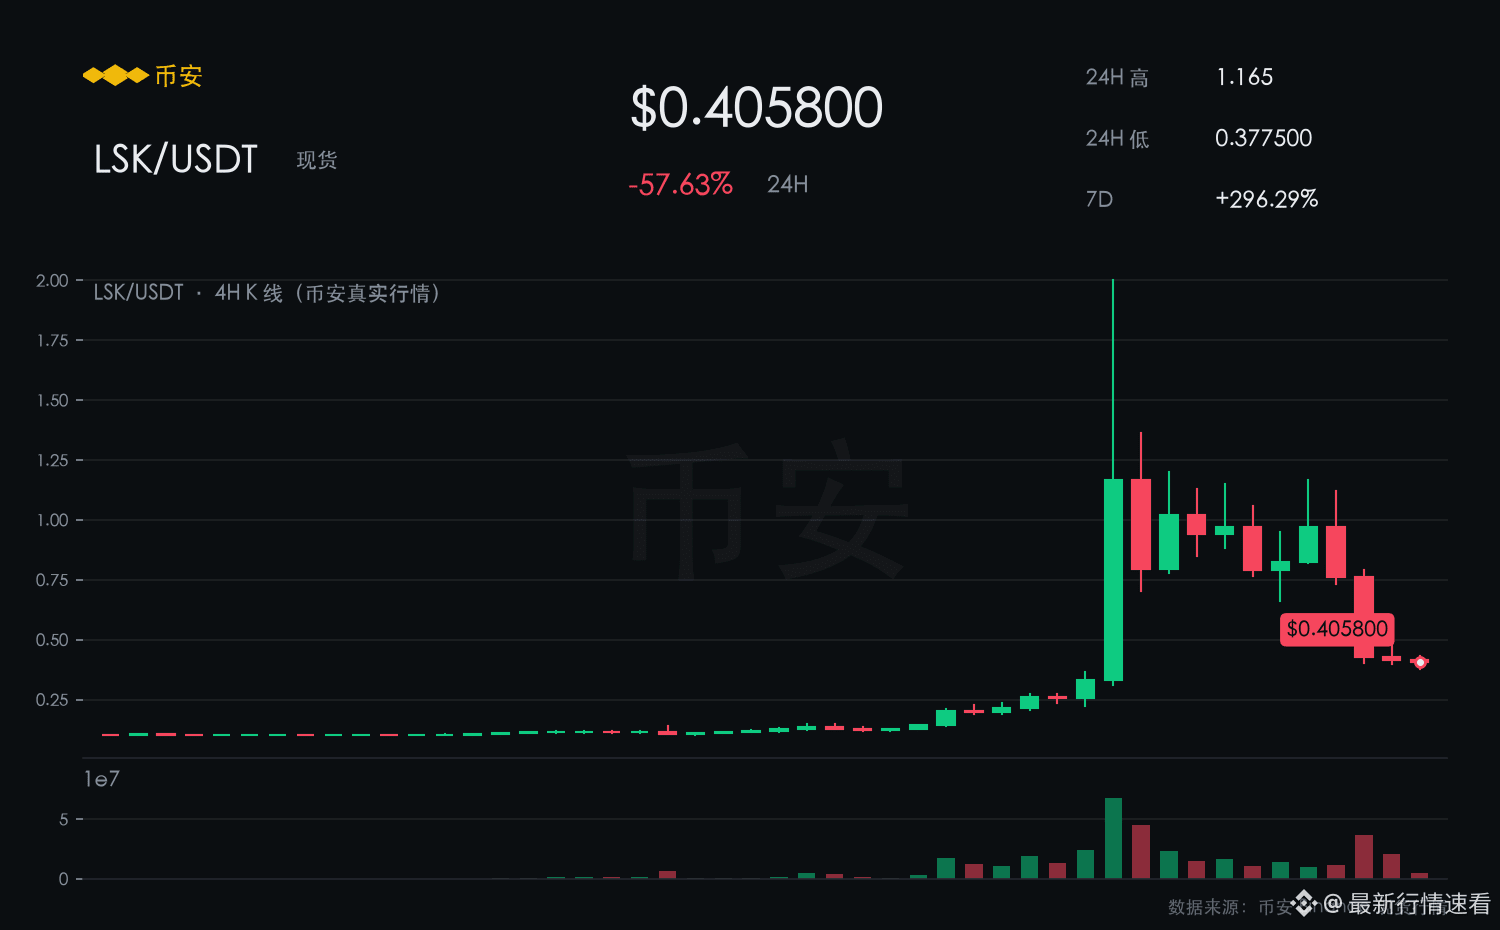
LSK current price is 0.4064, down 57.57% over the past 24 hours, and still down 296.87% over 7 days; intraday range is 0.3775–1.165.
LSK’s intraday range is 0.3775–1.165. The rebound has no volume, and the 7-day trend line is still closing bearish.
Support at 0.3775 hasn’t been tested with real buying and selling, so confidence is insufficient.
In the short term, it leans bearish.
【Bearish Reasons】
The most damaging kind is when trending stocks fall again—LSK’s 7-day drop of 296.87% hasn’t fully played out yet.
If the rebound doesn’t come with volume above 1.165, treat it as weak consolidation.
$LSK #LSK
【See Drop】
LSK current price is 0.4064, down 57.57% over the past 24 hours, and still down 296.87% over 7 days; intraday range is 0.3775–1.165.
LSK’s intraday range is 0.3775–1.165. The rebound has no volume, and the 7-day trend line is still closing bearish.
Support at 0.3775 hasn’t been tested with real buying and selling, so confidence is insufficient.
In the short term, it leans bearish.
【Bearish Reasons】
The most damaging kind is when trending stocks fall again—LSK’s 7-day drop of 296.87% hasn’t fully played out yet.
If the rebound doesn’t come with volume above 1.165, treat it as weak consolidation.
$LSK #LSK
LSK current price is 0.4064, down 57.57% over the past 24 hours, and still down 296.87% over 7 days; intraday range is 0.3775–1.165.
LSK’s intraday range is 0.3775–1.165. The rebound has no volume, and the 7-day trend line is still closing bearish.
Support at 0.3775 hasn’t been tested with real buying and selling, so confidence is insufficient.
In the short term, it leans bearish.
【Bearish Reasons】
The most damaging kind is when trending stocks fall again—LSK’s 7-day drop of 296.87% hasn’t fully played out yet.
If the rebound doesn’t come with volume above 1.165, treat it as weak consolidation.
$LSK #LSK
8
·
--
【View Up】
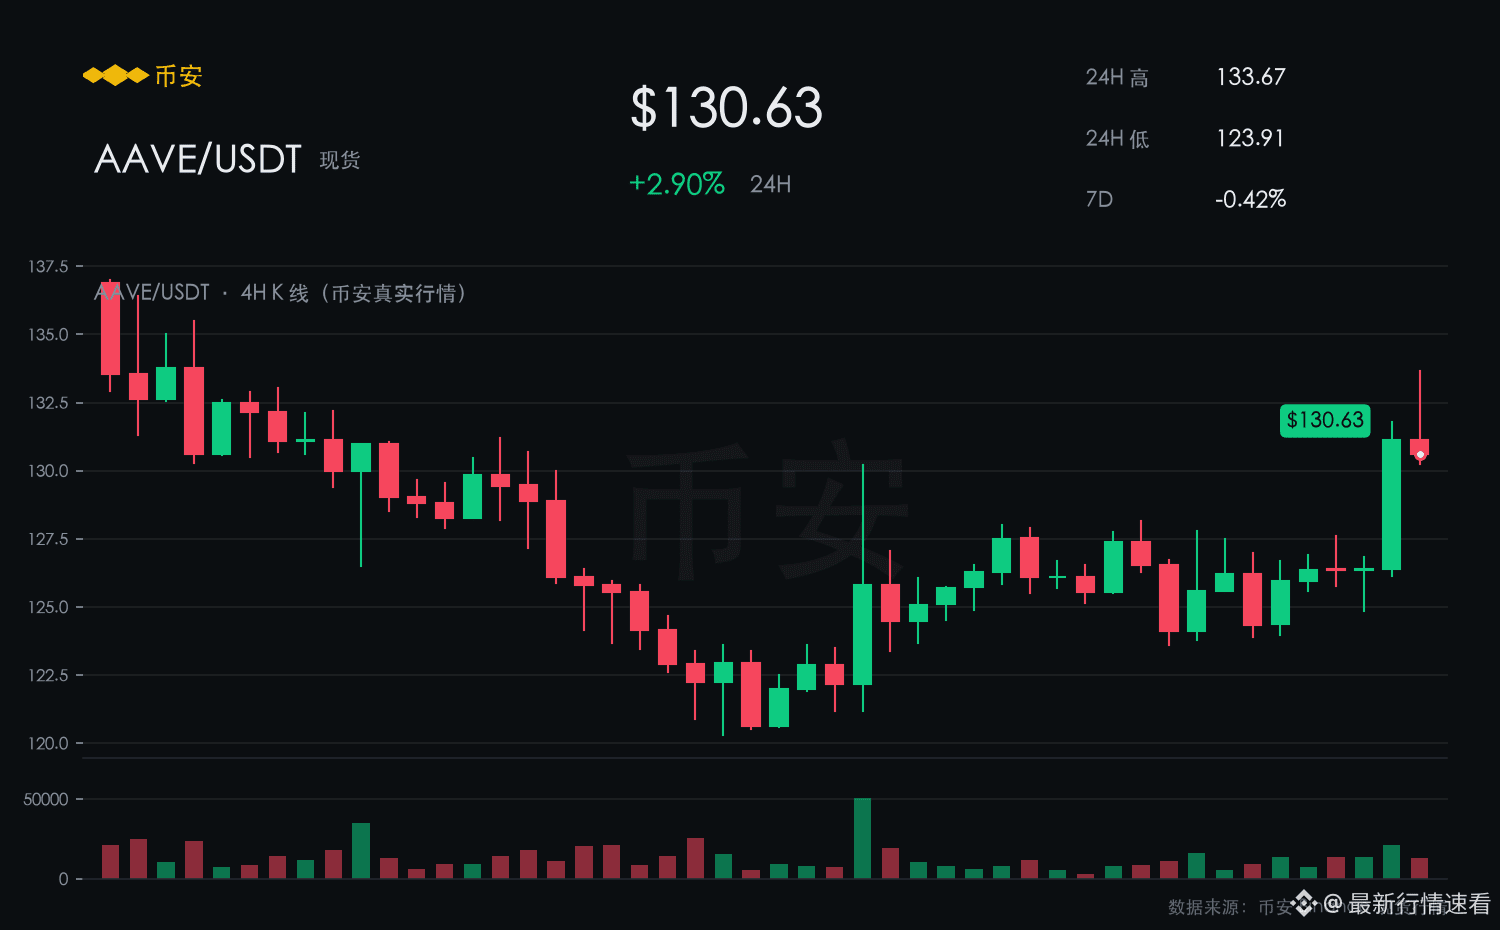
AAVE is currently quoted at 130.63, up 2.90% over the past 24 hours, with a 7-day gain of 0.42%. Today's range is 123.91–133.67.
This pullback in AAVE shows clear resilience; short-term strength ranks among the top in the market.
As long as 123.91 isn’t lost, the current correction can be regarded as a strong consolidation.
In the short term, the outlook is bullish.
【Bullish Rationale】
A 7-day gain of 0.42% counts as hard currency in the current market environment, and the pullback looks more like accumulation.
For the rebound, first look at the intraday high of 133.67. After an effective breakout, it will open up new room.
$AAVE #AAVE
【View Up】
AAVE is currently quoted at 130.63, up 2.90% over the past 24 hours, with a 7-day gain of 0.42%. Today's range is 123.91–133.67.
This pullback in AAVE shows clear resilience; short-term strength ranks among the top in the market.
As long as 123.91 isn’t lost, the current correction can be regarded as a strong consolidation.
In the short term, the outlook is bullish.
【Bullish Rationale】
A 7-day gain of 0.42% counts as hard currency in the current market environment, and the pullback looks more like accumulation.
For the rebound, first look at the intraday high of 133.67. After an effective breakout, it will open up new room.
$AAVE #AAVE
AAVE is currently quoted at 130.63, up 2.90% over the past 24 hours, with a 7-day gain of 0.42%. Today's range is 123.91–133.67.
This pullback in AAVE shows clear resilience; short-term strength ranks among the top in the market.
As long as 123.91 isn’t lost, the current correction can be regarded as a strong consolidation.
In the short term, the outlook is bullish.
【Bullish Rationale】
A 7-day gain of 0.42% counts as hard currency in the current market environment, and the pullback looks more like accumulation.
For the rebound, first look at the intraday high of 133.67. After an effective breakout, it will open up new room.
$AAVE #AAVE
18
·
--
【See the rise】
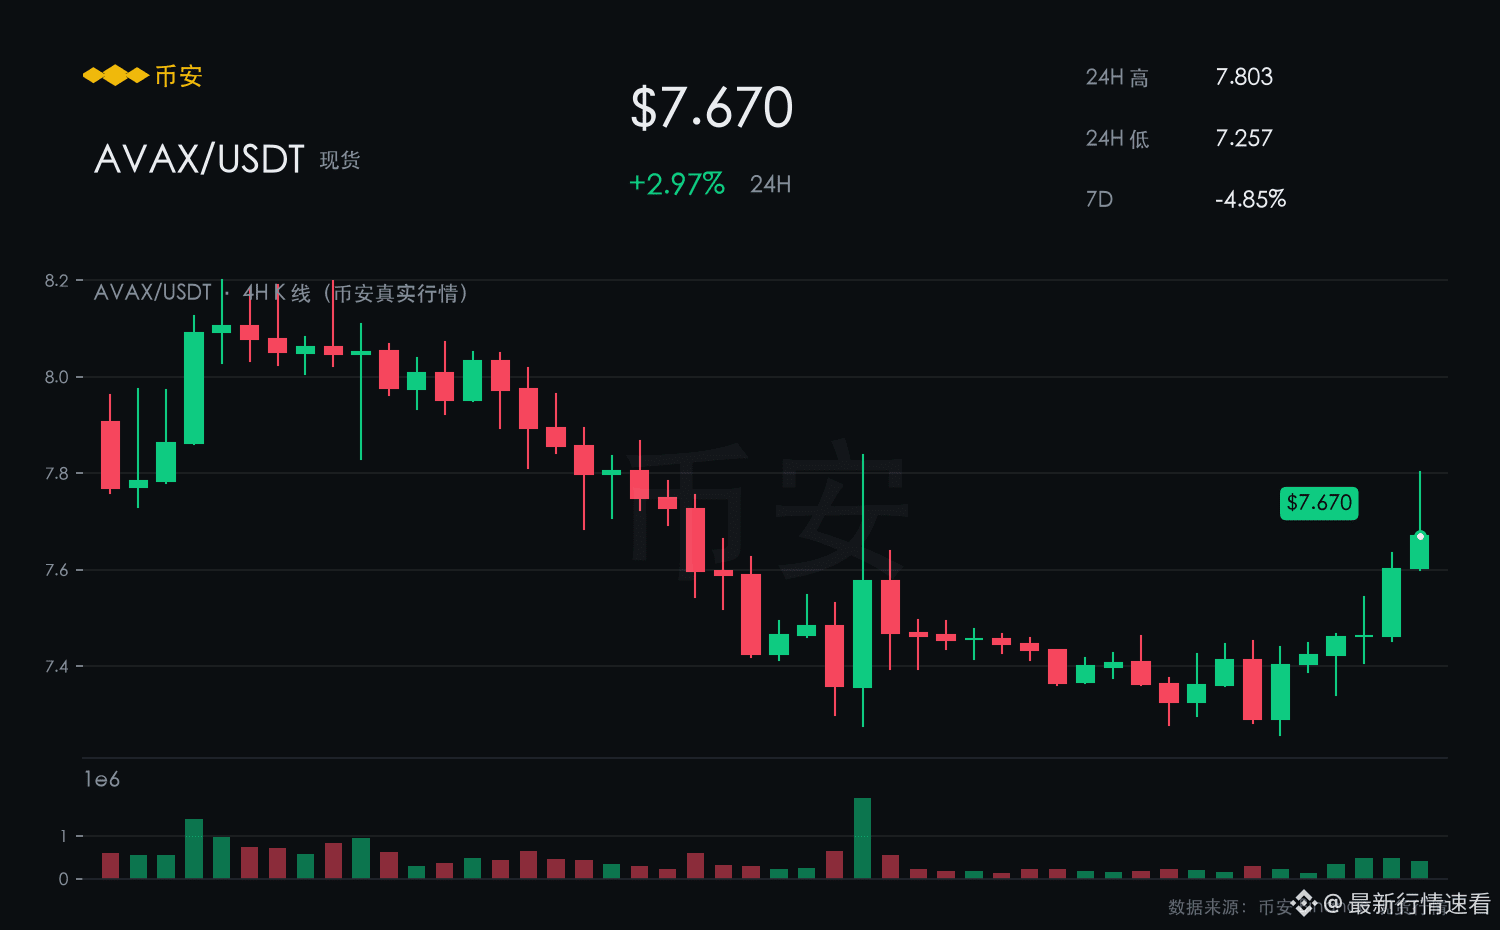
AVAX is currently at 7.663, up 2.87% over the past 24 hours, with a 7-day increase of 4.94%, trading intraday in the range of 7.257–7.803.
In a market where it follows down but not up, AVAX goes the opposite way—turning green in the last 24 hours is the attitude.
The 7.257 level has been retested multiple times without breaking; pullbacks are met with strong follow-through.
In the short term, it leans bullish.
【Bullish reasons】
A single-day gain of 2.87% isn’t dramatic, but combined with the 7-day 4.94% slope, the trend is right.
For the rebound, first look at the intraday high of 7.803; once there’s a valid breakout, it opens up new room.
$AVAX #AVAX
【See the rise】
AVAX is currently at 7.663, up 2.87% over the past 24 hours, with a 7-day increase of 4.94%, trading intraday in the range of 7.257–7.803.
In a market where it follows down but not up, AVAX goes the opposite way—turning green in the last 24 hours is the attitude.
The 7.257 level has been retested multiple times without breaking; pullbacks are met with strong follow-through.
In the short term, it leans bullish.
【Bullish reasons】
A single-day gain of 2.87% isn’t dramatic, but combined with the 7-day 4.94% slope, the trend is right.
For the rebound, first look at the intraday high of 7.803; once there’s a valid breakout, it opens up new room.
$AVAX #AVAX
AVAX is currently at 7.663, up 2.87% over the past 24 hours, with a 7-day increase of 4.94%, trading intraday in the range of 7.257–7.803.
In a market where it follows down but not up, AVAX goes the opposite way—turning green in the last 24 hours is the attitude.
The 7.257 level has been retested multiple times without breaking; pullbacks are met with strong follow-through.
In the short term, it leans bullish.
【Bullish reasons】
A single-day gain of 2.87% isn’t dramatic, but combined with the 7-day 4.94% slope, the trend is right.
For the rebound, first look at the intraday high of 7.803; once there’s a valid breakout, it opens up new room.
$AVAX #AVAX
17
·
--
【Watch Up】
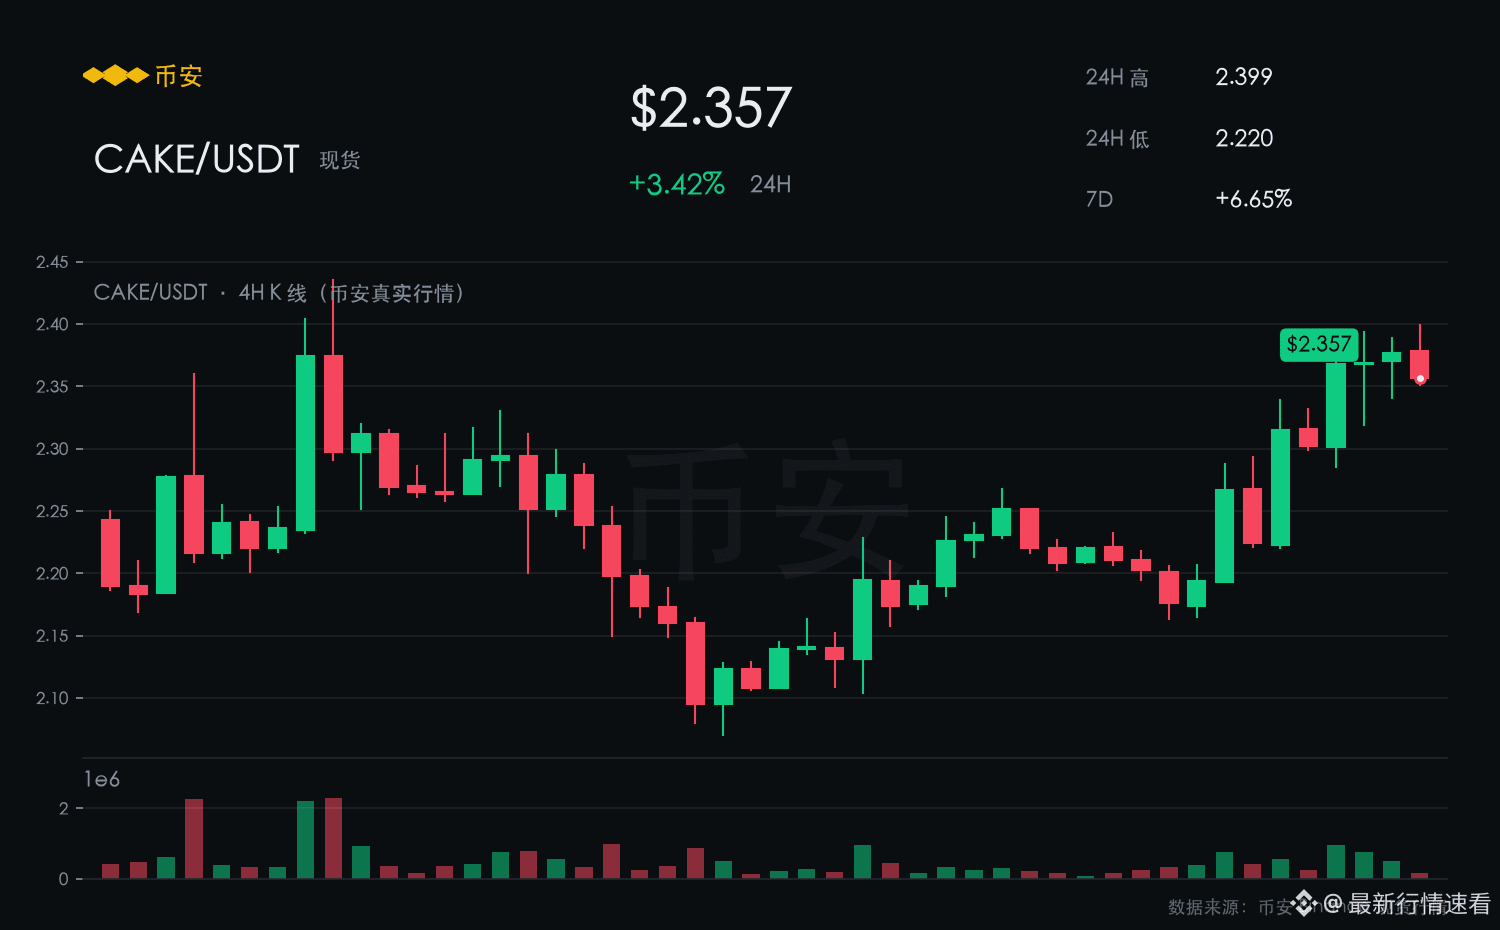
CAKE is currently quoted at 2.357; up 3.42% over the last 24 hours. The 7-day gain is 6.65%, with an intraday range of 2.220–2.399.
During the market bottoming phase, CAKE can still stay in the green for the past 24 hours, suggesting independent capital is propping it up.
The 2.220 level has been tested multiple times without breaking; pullbacks are met with strong support.
In the short term, it’s biased bullish.
【Bullish Reasons】
A 7-day rise of 6.65% is hard currency in the current market; pullbacks look more like accumulation.
For the rebound, first look at the intraday high of 2.399. An effective breakout would open up fresh room.
$CAKE #CAKE
【Watch Up】
CAKE is currently quoted at 2.357; up 3.42% over the last 24 hours. The 7-day gain is 6.65%, with an intraday range of 2.220–2.399.
During the market bottoming phase, CAKE can still stay in the green for the past 24 hours, suggesting independent capital is propping it up.
The 2.220 level has been tested multiple times without breaking; pullbacks are met with strong support.
In the short term, it’s biased bullish.
【Bullish Reasons】
A 7-day rise of 6.65% is hard currency in the current market; pullbacks look more like accumulation.
For the rebound, first look at the intraday high of 2.399. An effective breakout would open up fresh room.
$CAKE #CAKE
CAKE is currently quoted at 2.357; up 3.42% over the last 24 hours. The 7-day gain is 6.65%, with an intraday range of 2.220–2.399.
During the market bottoming phase, CAKE can still stay in the green for the past 24 hours, suggesting independent capital is propping it up.
The 2.220 level has been tested multiple times without breaking; pullbacks are met with strong support.
In the short term, it’s biased bullish.
【Bullish Reasons】
A 7-day rise of 6.65% is hard currency in the current market; pullbacks look more like accumulation.
For the rebound, first look at the intraday high of 2.399. An effective breakout would open up fresh room.
$CAKE #CAKE
16
·
--
【See the Rise】
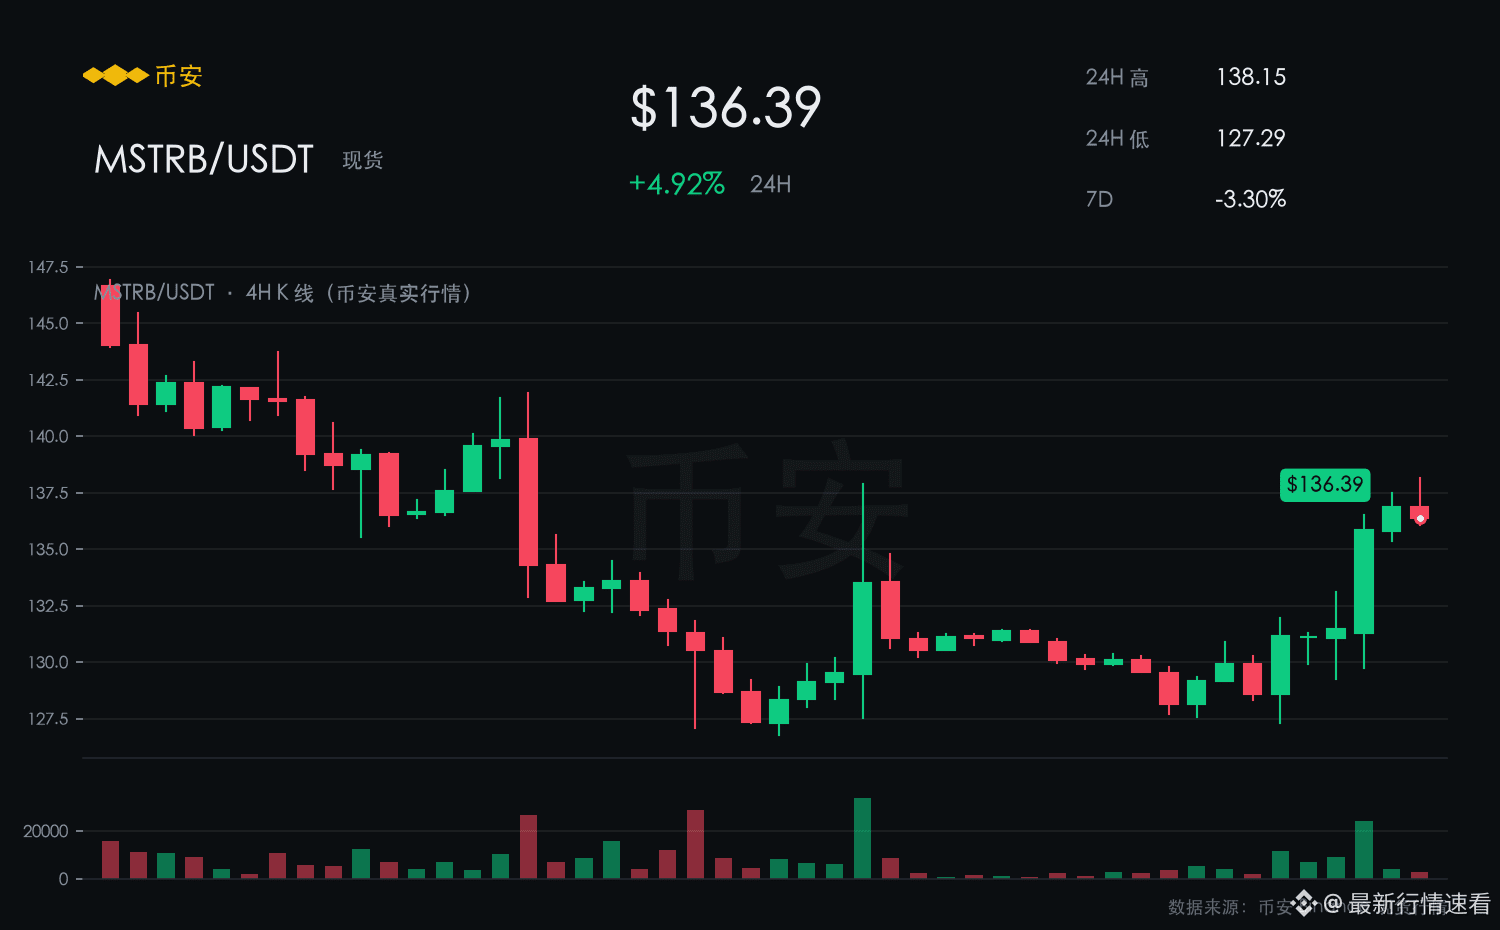
MSTRB is currently at 136.39, up 4.92% over the past 24 hours, with a 7-day gain of 3.30%, trading range today at 127.29–138.15.
In a market where it lags when others rise, MSTRB goes against the trend; a red candle in the last 24 hours is the attitude.
At 127.29, the price has tested it multiple times without breaking; the pullback has been met with strong support.
In the short term, it leans bullish.
【Bullish Rationale】
A 3.30% gain over 7 days is solid currency in the current market; any pullback looks more like building momentum.
Near-term resistance is at 138.15—if it breaks through on increased volume, then you follow.
$MSTRB #MSTRB
【See the Rise】
MSTRB is currently at 136.39, up 4.92% over the past 24 hours, with a 7-day gain of 3.30%, trading range today at 127.29–138.15.
In a market where it lags when others rise, MSTRB goes against the trend; a red candle in the last 24 hours is the attitude.
At 127.29, the price has tested it multiple times without breaking; the pullback has been met with strong support.
In the short term, it leans bullish.
【Bullish Rationale】
A 3.30% gain over 7 days is solid currency in the current market; any pullback looks more like building momentum.
Near-term resistance is at 138.15—if it breaks through on increased volume, then you follow.
$MSTRB #MSTRB
MSTRB is currently at 136.39, up 4.92% over the past 24 hours, with a 7-day gain of 3.30%, trading range today at 127.29–138.15.
In a market where it lags when others rise, MSTRB goes against the trend; a red candle in the last 24 hours is the attitude.
At 127.29, the price has tested it multiple times without breaking; the pullback has been met with strong support.
In the short term, it leans bullish.
【Bullish Rationale】
A 3.30% gain over 7 days is solid currency in the current market; any pullback looks more like building momentum.
Near-term resistance is at 138.15—if it breaks through on increased volume, then you follow.
$MSTRB #MSTRB
16
·
--
【Watch Rise】
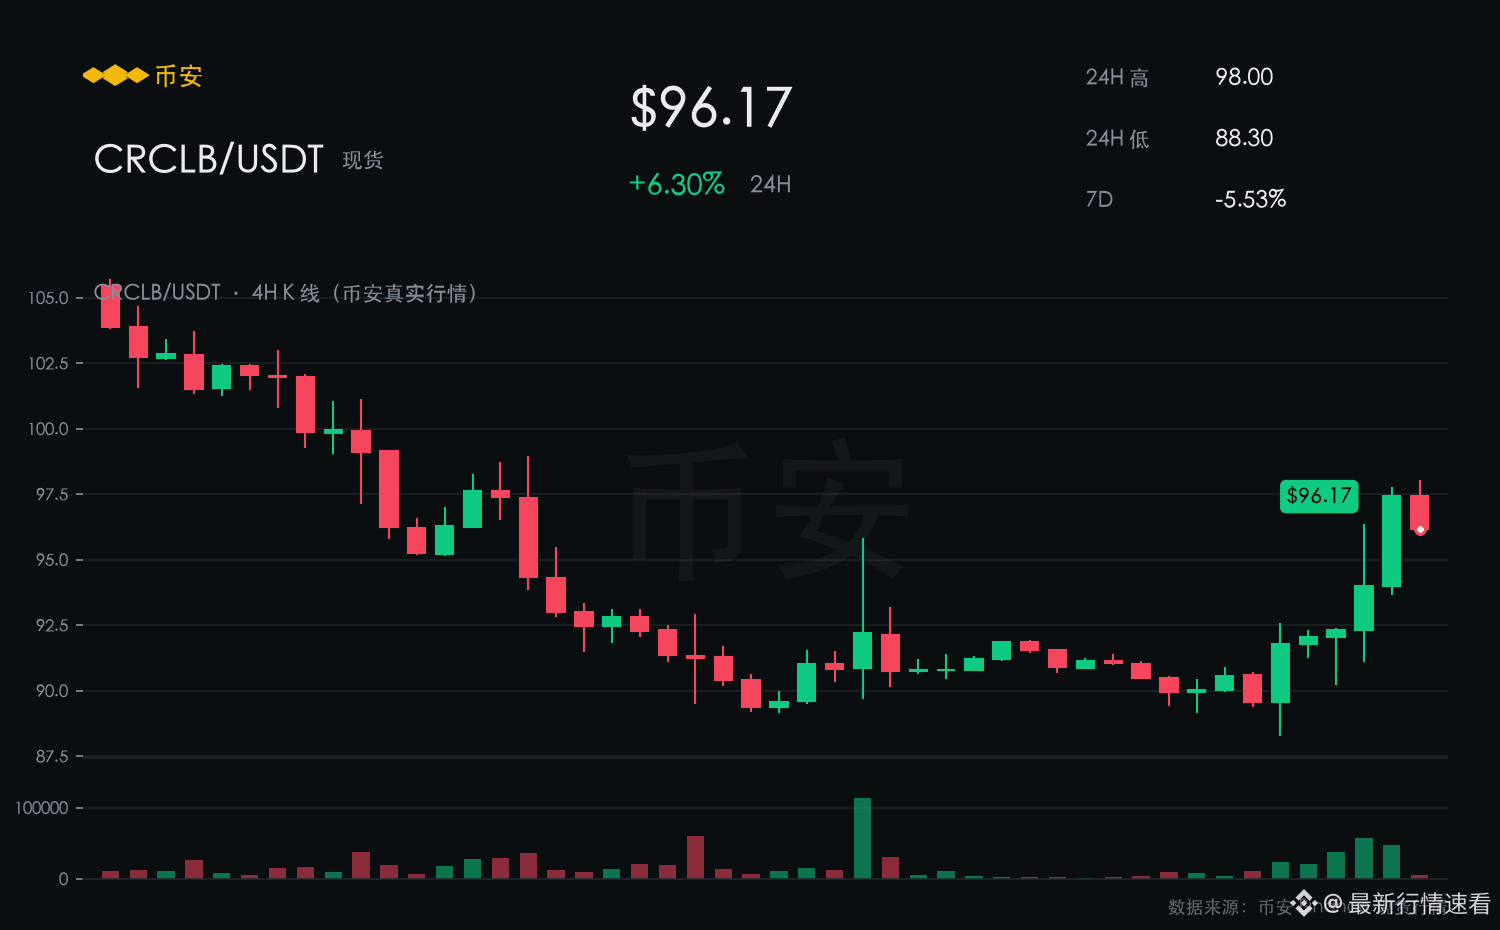
CRCLB is currently quoted at 96.170, up 6.30% over the past 24 hours, with a 7-day gain of 5.53%, trading in a range of 88.300–98.000 during the day.
During the market’s bottoming phase, CRCLB can still stay in the green over the past 24 hours, suggesting independent capital is supporting it.
As long as 88.300 holds, the current pullback can be considered a strong consolidation.
Near-term outlook is bullish.
【Reasons for Bullishness】
A 7-day gain of 5.53% is considered hard currency in today’s market; the pullback looks more like building momentum.
If it holds above 88.300, the next target is 98.000.
$CRCLB #CRCLB
【Watch Rise】
CRCLB is currently quoted at 96.170, up 6.30% over the past 24 hours, with a 7-day gain of 5.53%, trading in a range of 88.300–98.000 during the day.
During the market’s bottoming phase, CRCLB can still stay in the green over the past 24 hours, suggesting independent capital is supporting it.
As long as 88.300 holds, the current pullback can be considered a strong consolidation.
Near-term outlook is bullish.
【Reasons for Bullishness】
A 7-day gain of 5.53% is considered hard currency in today’s market; the pullback looks more like building momentum.
If it holds above 88.300, the next target is 98.000.
$CRCLB #CRCLB
CRCLB is currently quoted at 96.170, up 6.30% over the past 24 hours, with a 7-day gain of 5.53%, trading in a range of 88.300–98.000 during the day.
During the market’s bottoming phase, CRCLB can still stay in the green over the past 24 hours, suggesting independent capital is supporting it.
As long as 88.300 holds, the current pullback can be considered a strong consolidation.
Near-term outlook is bullish.
【Reasons for Bullishness】
A 7-day gain of 5.53% is considered hard currency in today’s market; the pullback looks more like building momentum.
If it holds above 88.300, the next target is 98.000.
$CRCLB #CRCLB
36
·
--
【See Rise】
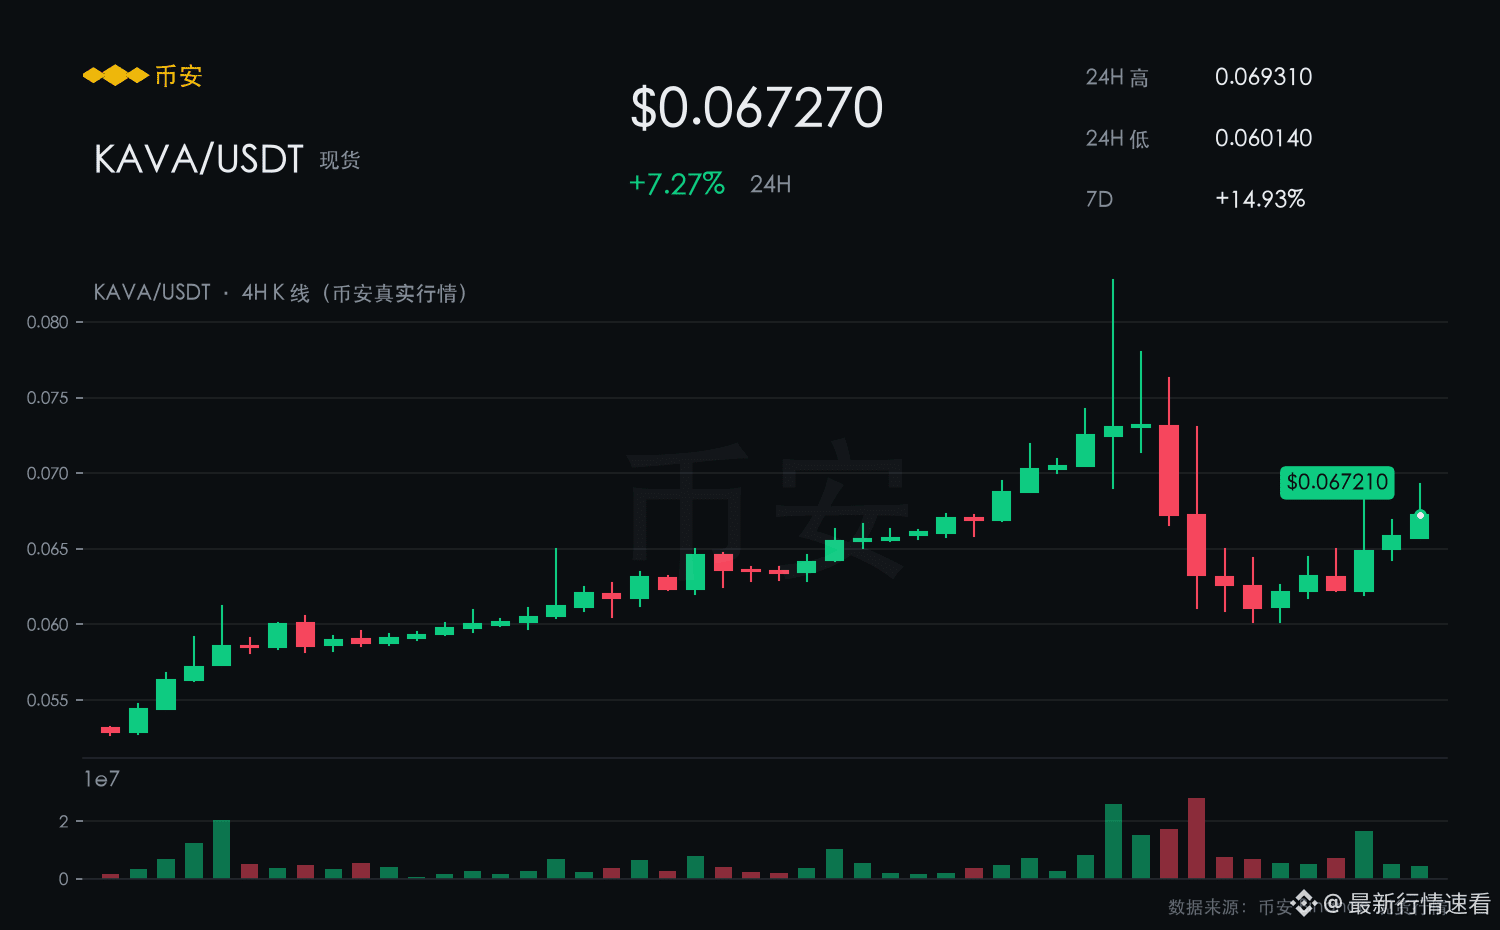
KAVA current price 0.0673, up 7.27% over the past 24 hours, with a 7-day gain of 14.93%, and trading range within the day of 0.0601–0.0693.
During the market’s bottoming phase, KAVA can still stay in the green over the past 24 hours, indicating that there is independent capital propping it up.
The support at 0.0601 has held up after two rounds of tests.
In the short term, the bias is bullish.
【Bullish Rationale】
A 7-day increase of 14.93% is considered hard currency for the current market environment; any pullback looks more like buildup.
As long as it holds above 0.0601, the next target is 0.0693.
$KAVA #KAVA
【See Rise】
KAVA current price 0.0673, up 7.27% over the past 24 hours, with a 7-day gain of 14.93%, and trading range within the day of 0.0601–0.0693.
During the market’s bottoming phase, KAVA can still stay in the green over the past 24 hours, indicating that there is independent capital propping it up.
The support at 0.0601 has held up after two rounds of tests.
In the short term, the bias is bullish.
【Bullish Rationale】
A 7-day increase of 14.93% is considered hard currency for the current market environment; any pullback looks more like buildup.
As long as it holds above 0.0601, the next target is 0.0693.
$KAVA #KAVA
KAVA current price 0.0673, up 7.27% over the past 24 hours, with a 7-day gain of 14.93%, and trading range within the day of 0.0601–0.0693.
During the market’s bottoming phase, KAVA can still stay in the green over the past 24 hours, indicating that there is independent capital propping it up.
The support at 0.0601 has held up after two rounds of tests.
In the short term, the bias is bullish.
【Bullish Rationale】
A 7-day increase of 14.93% is considered hard currency for the current market environment; any pullback looks more like buildup.
As long as it holds above 0.0601, the next target is 0.0693.
$KAVA #KAVA
31
·
--
【See Rise】
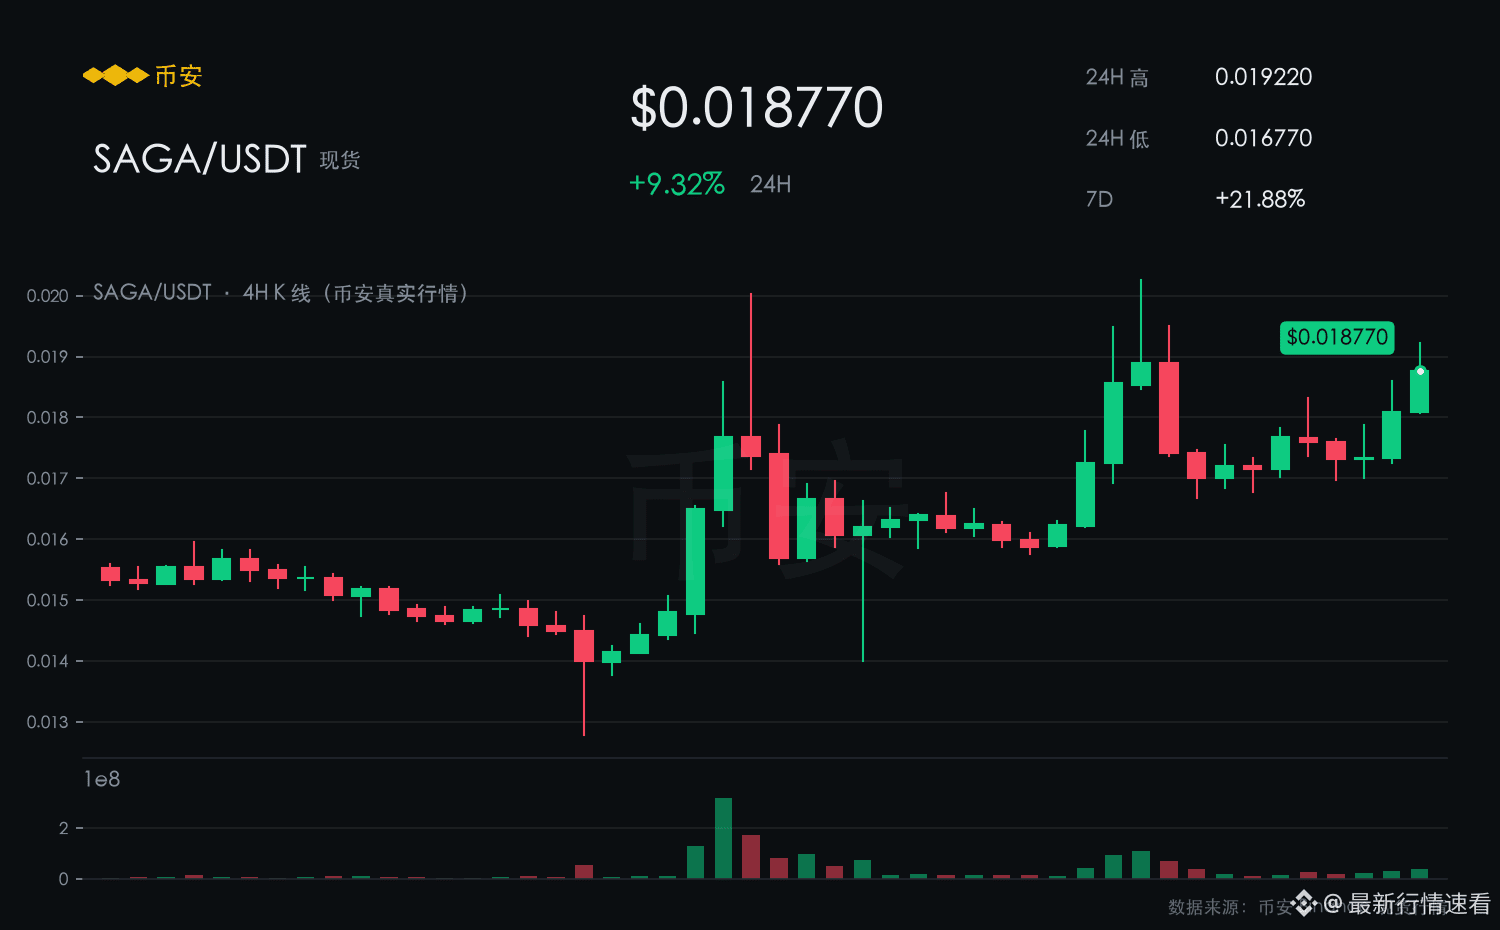
SAGA is currently reporting 0.0187; it’s up 9.20% over the past 24 hours. The 7-day gain is 21.75%, with an intraday range of 0.0168–0.0192.
The price has been fluctuating within the 0.0168–0.0192 range intraday. The lows are gradually rising, and there are clear signs of long-side control.
The support at 0.0168 has held up after two rounds of testing.
In the short term, it leans bullish.
【Bullish Rationale】
A single-day gain of 9.20% isn’t especially extreme, but combined with a 21.75% rise over 7 days (the slope), the trend is right.
As long as it holds above 0.0168, the next target is 0.0192.
$SAGA #SAGA
【See Rise】
SAGA is currently reporting 0.0187; it’s up 9.20% over the past 24 hours. The 7-day gain is 21.75%, with an intraday range of 0.0168–0.0192.
The price has been fluctuating within the 0.0168–0.0192 range intraday. The lows are gradually rising, and there are clear signs of long-side control.
The support at 0.0168 has held up after two rounds of testing.
In the short term, it leans bullish.
【Bullish Rationale】
A single-day gain of 9.20% isn’t especially extreme, but combined with a 21.75% rise over 7 days (the slope), the trend is right.
As long as it holds above 0.0168, the next target is 0.0192.
$SAGA #SAGA
SAGA is currently reporting 0.0187; it’s up 9.20% over the past 24 hours. The 7-day gain is 21.75%, with an intraday range of 0.0168–0.0192.
The price has been fluctuating within the 0.0168–0.0192 range intraday. The lows are gradually rising, and there are clear signs of long-side control.
The support at 0.0168 has held up after two rounds of testing.
In the short term, it leans bullish.
【Bullish Rationale】
A single-day gain of 9.20% isn’t especially extreme, but combined with a 21.75% rise over 7 days (the slope), the trend is right.
As long as it holds above 0.0168, the next target is 0.0192.
$SAGA #SAGA
42
·
--
【See Increase】
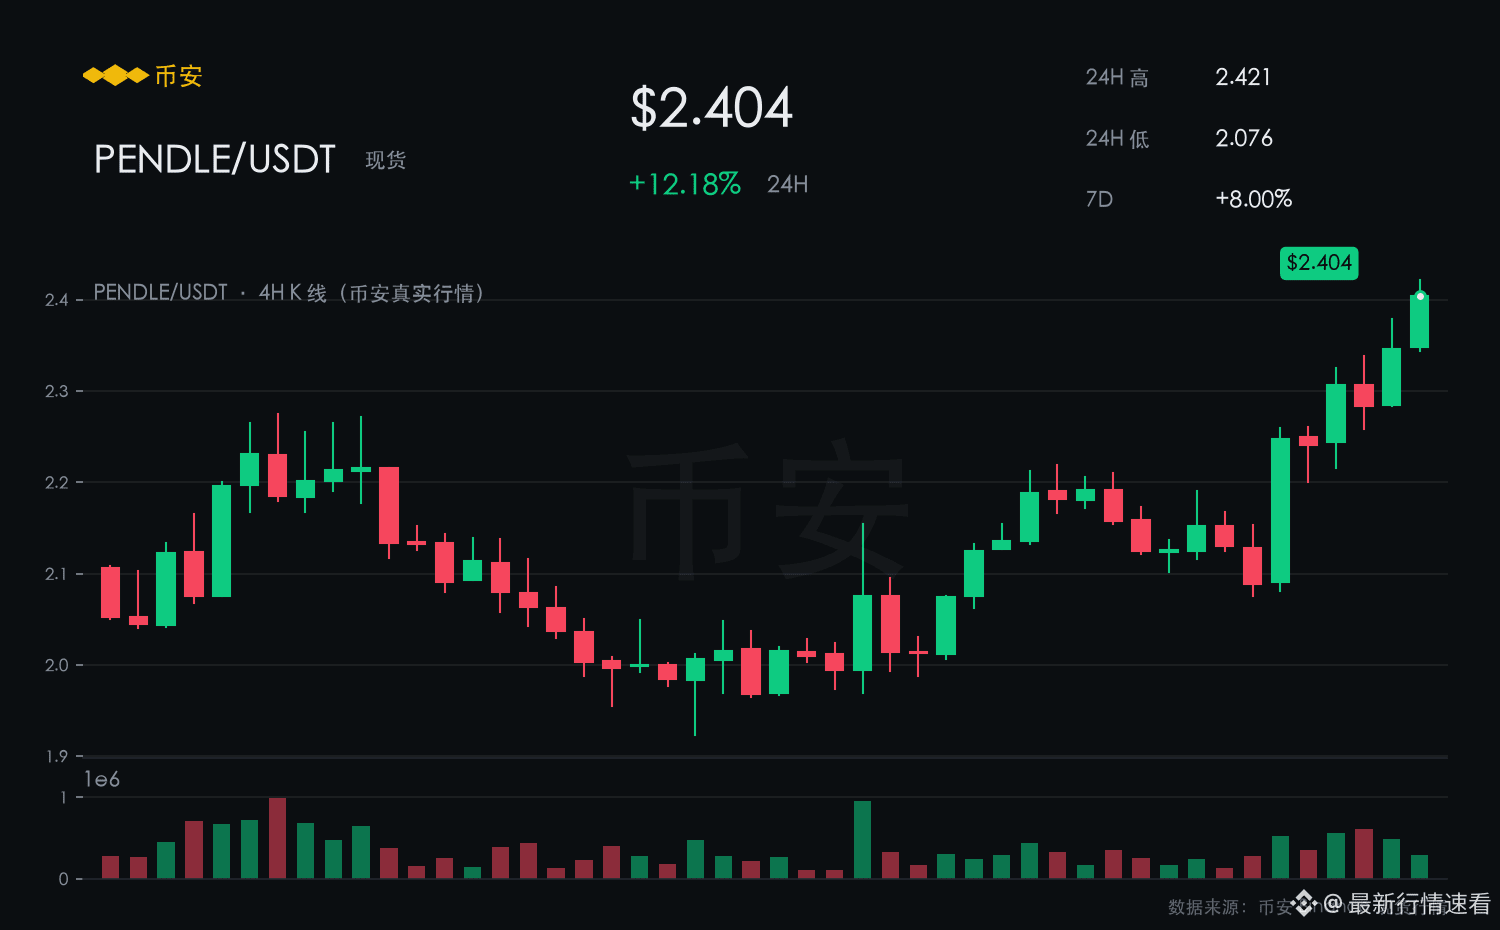
PENDLE is currently at 2.404, up 12.18% in the past 24 hours, with a 7-day increase of 8.00%. Today’s range is 2.076–2.421.
In a market where it follows down but not up, PENDLE does the opposite—going red in the last 24 hours is the attitude.
As long as 2.076 is not lost, the current pullback is still a strong consolidation.
Near-term bias is bullish.
【Bullish Rationale】
A 12.18% single-day gain isn’t extreme, but paired with the 7-day 8.00% slope, the trend is right.
Hold above 2.076, and the next target is 2.421.
$PENDLE #PENDLE
【See Increase】
PENDLE is currently at 2.404, up 12.18% in the past 24 hours, with a 7-day increase of 8.00%. Today’s range is 2.076–2.421.
In a market where it follows down but not up, PENDLE does the opposite—going red in the last 24 hours is the attitude.
As long as 2.076 is not lost, the current pullback is still a strong consolidation.
Near-term bias is bullish.
【Bullish Rationale】
A 12.18% single-day gain isn’t extreme, but paired with the 7-day 8.00% slope, the trend is right.
Hold above 2.076, and the next target is 2.421.
$PENDLE #PENDLE
PENDLE is currently at 2.404, up 12.18% in the past 24 hours, with a 7-day increase of 8.00%. Today’s range is 2.076–2.421.
In a market where it follows down but not up, PENDLE does the opposite—going red in the last 24 hours is the attitude.
As long as 2.076 is not lost, the current pullback is still a strong consolidation.
Near-term bias is bullish.
【Bullish Rationale】
A 12.18% single-day gain isn’t extreme, but paired with the 7-day 8.00% slope, the trend is right.
Hold above 2.076, and the next target is 2.421.
$PENDLE #PENDLE
52
·
--
[See Rise]
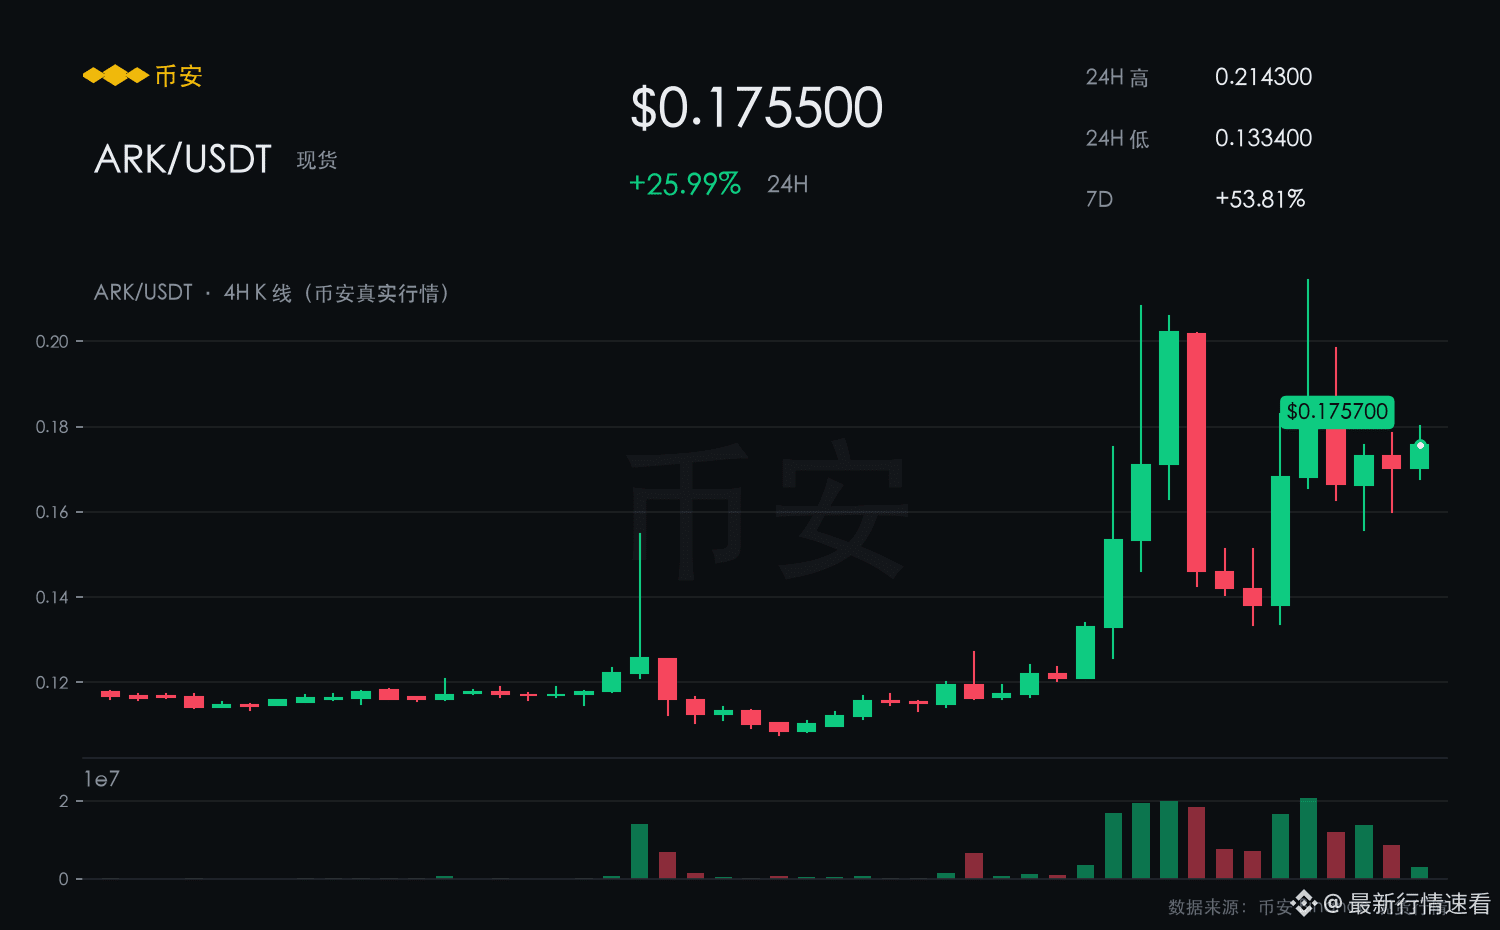
ARK currently reports 0.1754, up 25.92% over the past 24 hours, with a 53.72% gain over the last 7 days, ranging from 0.1334–0.2143 within the day.
In a market where some move down but don’t follow up, ARK goes the opposite way—going green over the past 24 hours is the attitude.
Support at 0.1334 has held up after two rounds of testing.
In the short term, it’s leaning bullish.
[Bullish Rationale]
A 53.72% gain over 7 days is solid “hard currency” in the current market—any pullback looks more like building momentum.
Near-term resistance is at 0.2143; once it breaks through with increased volume, then you follow in.
$ARK #ARK
[See Rise]
ARK currently reports 0.1754, up 25.92% over the past 24 hours, with a 53.72% gain over the last 7 days, ranging from 0.1334–0.2143 within the day.
In a market where some move down but don’t follow up, ARK goes the opposite way—going green over the past 24 hours is the attitude.
Support at 0.1334 has held up after two rounds of testing.
In the short term, it’s leaning bullish.
[Bullish Rationale]
A 53.72% gain over 7 days is solid “hard currency” in the current market—any pullback looks more like building momentum.
Near-term resistance is at 0.2143; once it breaks through with increased volume, then you follow in.
$ARK #ARK
ARK currently reports 0.1754, up 25.92% over the past 24 hours, with a 53.72% gain over the last 7 days, ranging from 0.1334–0.2143 within the day.
In a market where some move down but don’t follow up, ARK goes the opposite way—going green over the past 24 hours is the attitude.
Support at 0.1334 has held up after two rounds of testing.
In the short term, it’s leaning bullish.
[Bullish Rationale]
A 53.72% gain over 7 days is solid “hard currency” in the current market—any pullback looks more like building momentum.
Near-term resistance is at 0.2143; once it breaks through with increased volume, then you follow in.
$ARK #ARK
63
·
--
【See Decline】
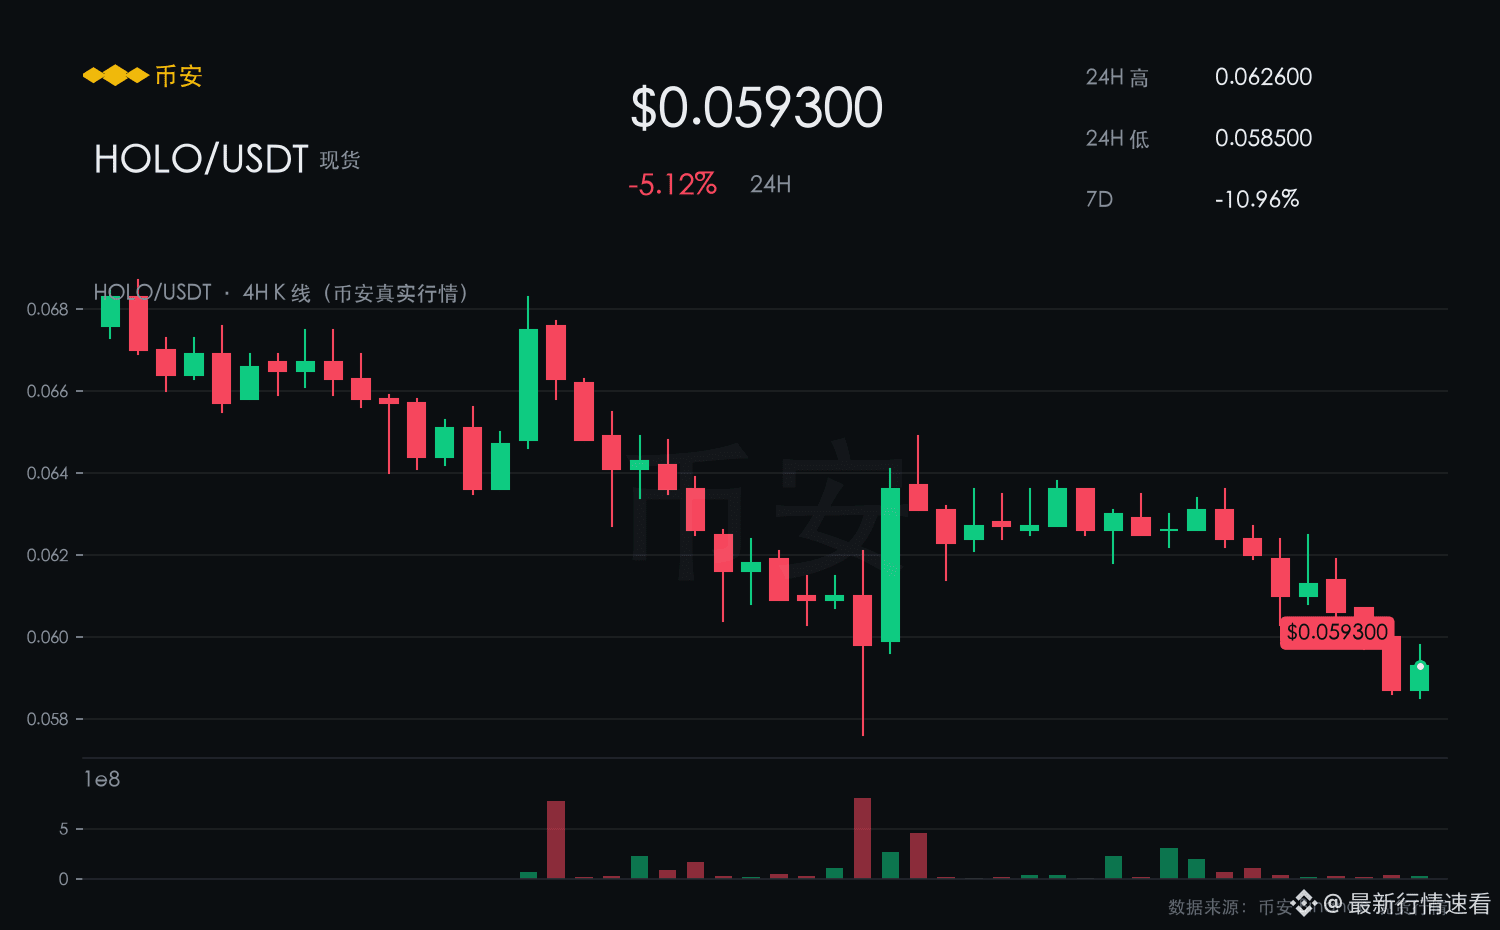
HOLO is currently quoted at 0.0593, down 5.12% over the past 24 hours. It is still down 10.96% over 7 days, with an intraday range of 0.0585–0.0626.
HOLO is down 5.12% over the last 24 hours. After rebounding to around 0.0626, it was pushed back down; there is a high density of trapped sell orders above.
The single-day rebound has not reversed the weakness on the weekly chart, and selling pressure continues to be released.
In the short term, the bias is bearish.
【Bearish Rationale】
A 24-hour drop of 5.12% indicates that active sell orders have not exhausted.
Once 0.0585 is broken, it will continue looking for support lower down.
$HOLO #HOLO
【See Decline】
HOLO is currently quoted at 0.0593, down 5.12% over the past 24 hours. It is still down 10.96% over 7 days, with an intraday range of 0.0585–0.0626.
HOLO is down 5.12% over the last 24 hours. After rebounding to around 0.0626, it was pushed back down; there is a high density of trapped sell orders above.
The single-day rebound has not reversed the weakness on the weekly chart, and selling pressure continues to be released.
In the short term, the bias is bearish.
【Bearish Rationale】
A 24-hour drop of 5.12% indicates that active sell orders have not exhausted.
Once 0.0585 is broken, it will continue looking for support lower down.
$HOLO #HOLO
HOLO is currently quoted at 0.0593, down 5.12% over the past 24 hours. It is still down 10.96% over 7 days, with an intraday range of 0.0585–0.0626.
HOLO is down 5.12% over the last 24 hours. After rebounding to around 0.0626, it was pushed back down; there is a high density of trapped sell orders above.
The single-day rebound has not reversed the weakness on the weekly chart, and selling pressure continues to be released.
In the short term, the bias is bearish.
【Bearish Rationale】
A 24-hour drop of 5.12% indicates that active sell orders have not exhausted.
Once 0.0585 is broken, it will continue looking for support lower down.
$HOLO #HOLO
4
·
--
【Look Down】
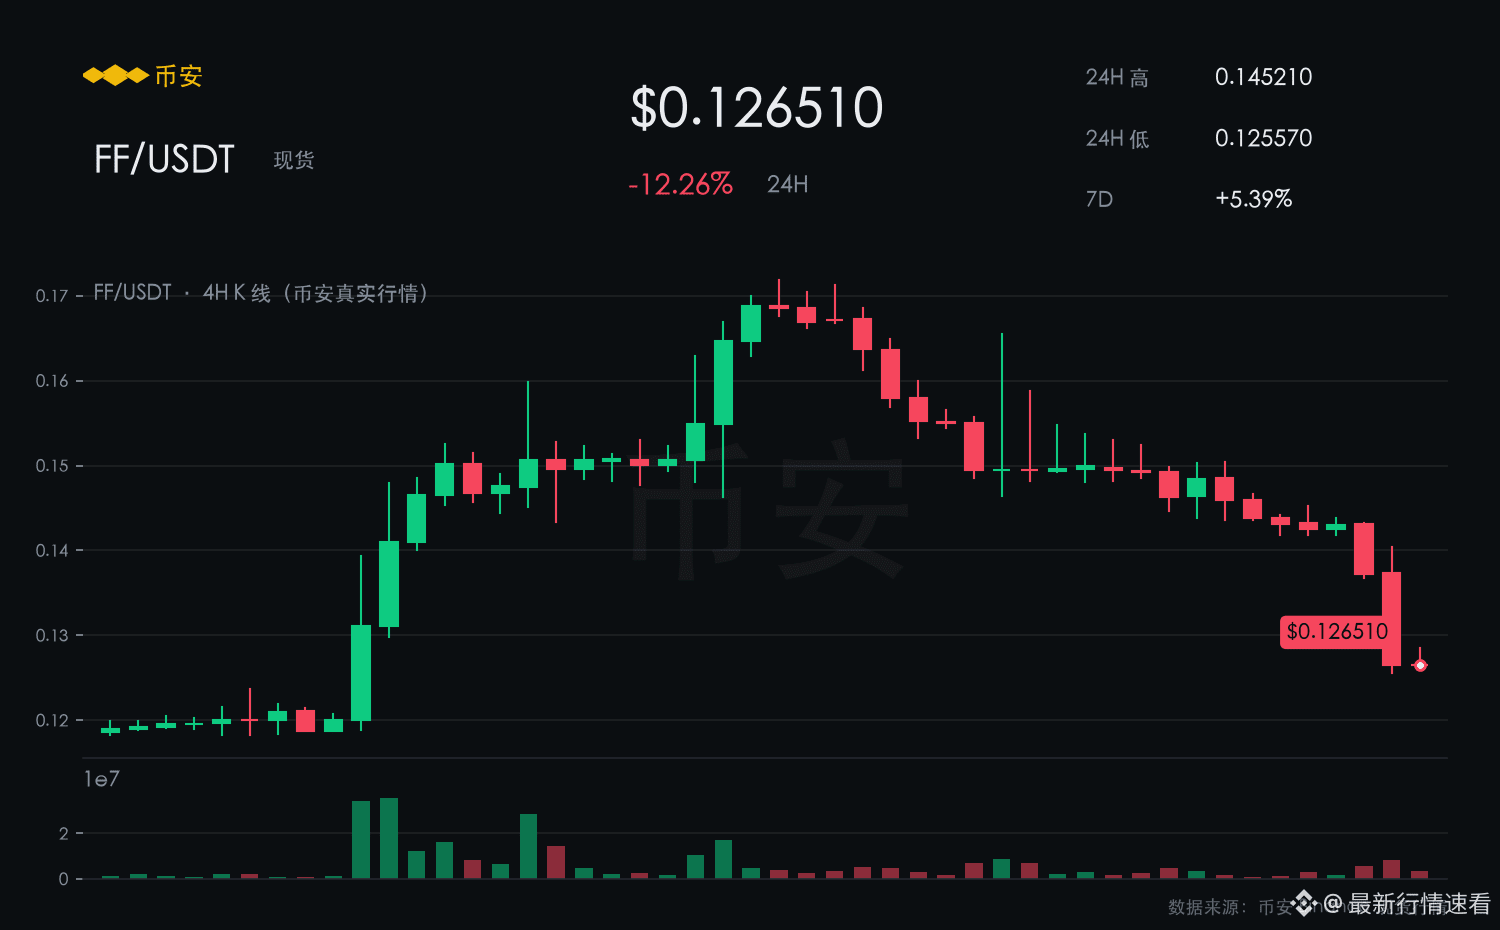
FF current price: 0.1265, down 12.26% in the past 24 hours; down 5.39% over the past 7 days; intraday range 0.1256–0.1452.
In the past 24 hours, FF is down 12.26%. After rebounding to around 0.1452, it was pushed back down again. There is a high density of trapped-sell orders overhead.
The rebound comes on lower volume, while the decline comes on higher volume; the volume-price structure is bearish.
Short-term bias is bearish.
【Bearish Reasons】
Against the weekly backdrop of -5.39% over 7 days, a single-day small green candle can only be treated as a weak pullback.
Unless the rebound breaks above 0.1452 with increased volume, it should be handled as a weak consolidation.
$FF #FF
【Look Down】
FF current price: 0.1265, down 12.26% in the past 24 hours; down 5.39% over the past 7 days; intraday range 0.1256–0.1452.
In the past 24 hours, FF is down 12.26%. After rebounding to around 0.1452, it was pushed back down again. There is a high density of trapped-sell orders overhead.
The rebound comes on lower volume, while the decline comes on higher volume; the volume-price structure is bearish.
Short-term bias is bearish.
【Bearish Reasons】
Against the weekly backdrop of -5.39% over 7 days, a single-day small green candle can only be treated as a weak pullback.
Unless the rebound breaks above 0.1452 with increased volume, it should be handled as a weak consolidation.
$FF #FF
FF current price: 0.1265, down 12.26% in the past 24 hours; down 5.39% over the past 7 days; intraday range 0.1256–0.1452.
In the past 24 hours, FF is down 12.26%. After rebounding to around 0.1452, it was pushed back down again. There is a high density of trapped-sell orders overhead.
The rebound comes on lower volume, while the decline comes on higher volume; the volume-price structure is bearish.
Short-term bias is bearish.
【Bearish Reasons】
Against the weekly backdrop of -5.39% over 7 days, a single-day small green candle can only be treated as a weak pullback.
Unless the rebound breaks above 0.1452 with increased volume, it should be handled as a weak consolidation.
$FF #FF
4
Log in to explore more content
Join global crypto users on Binance Square
⚡️ Get latest and useful information about crypto.
💬 Trusted by the world’s largest crypto exchange.
👍 Discover real insights from verified creators.
Email / Phone number
Trending Topics
BitcoinReboundsTo$79K
13,247 views
126 Discussing
🚨 $BTC is pushing higher.
Bitcoin is trading around $78,804, up roughly 1.9%, after reclaiming the $78K area. The next level to watch is the intraday high near $78,905.
A clean break above that level could open the way toward $79K–$80K. If BTC gets rejected, support sits around $78,300, then $77,975.
Bulls have momentum, but BTC needs to hold above $78K.
#Bitcoin #BTC #CryptoTrading #CryptoMarket #CryptoAnalysis
PulseON
·13 Likes
·13k views
SouthKoreaCryptoTaxDelayPetitionTops50000
2 views
12 Discussing
SolanaTransactionV1GoesLiveOnMainnet
16 views
7 Discussing