
Don - G
64 Posts

Don - G
Investing Profile
Investing Style: Day trading, Growth Investments
Area of Expertise: Commodities
4 Following
45 Followers
62 Liked
Posts
All
Quotes
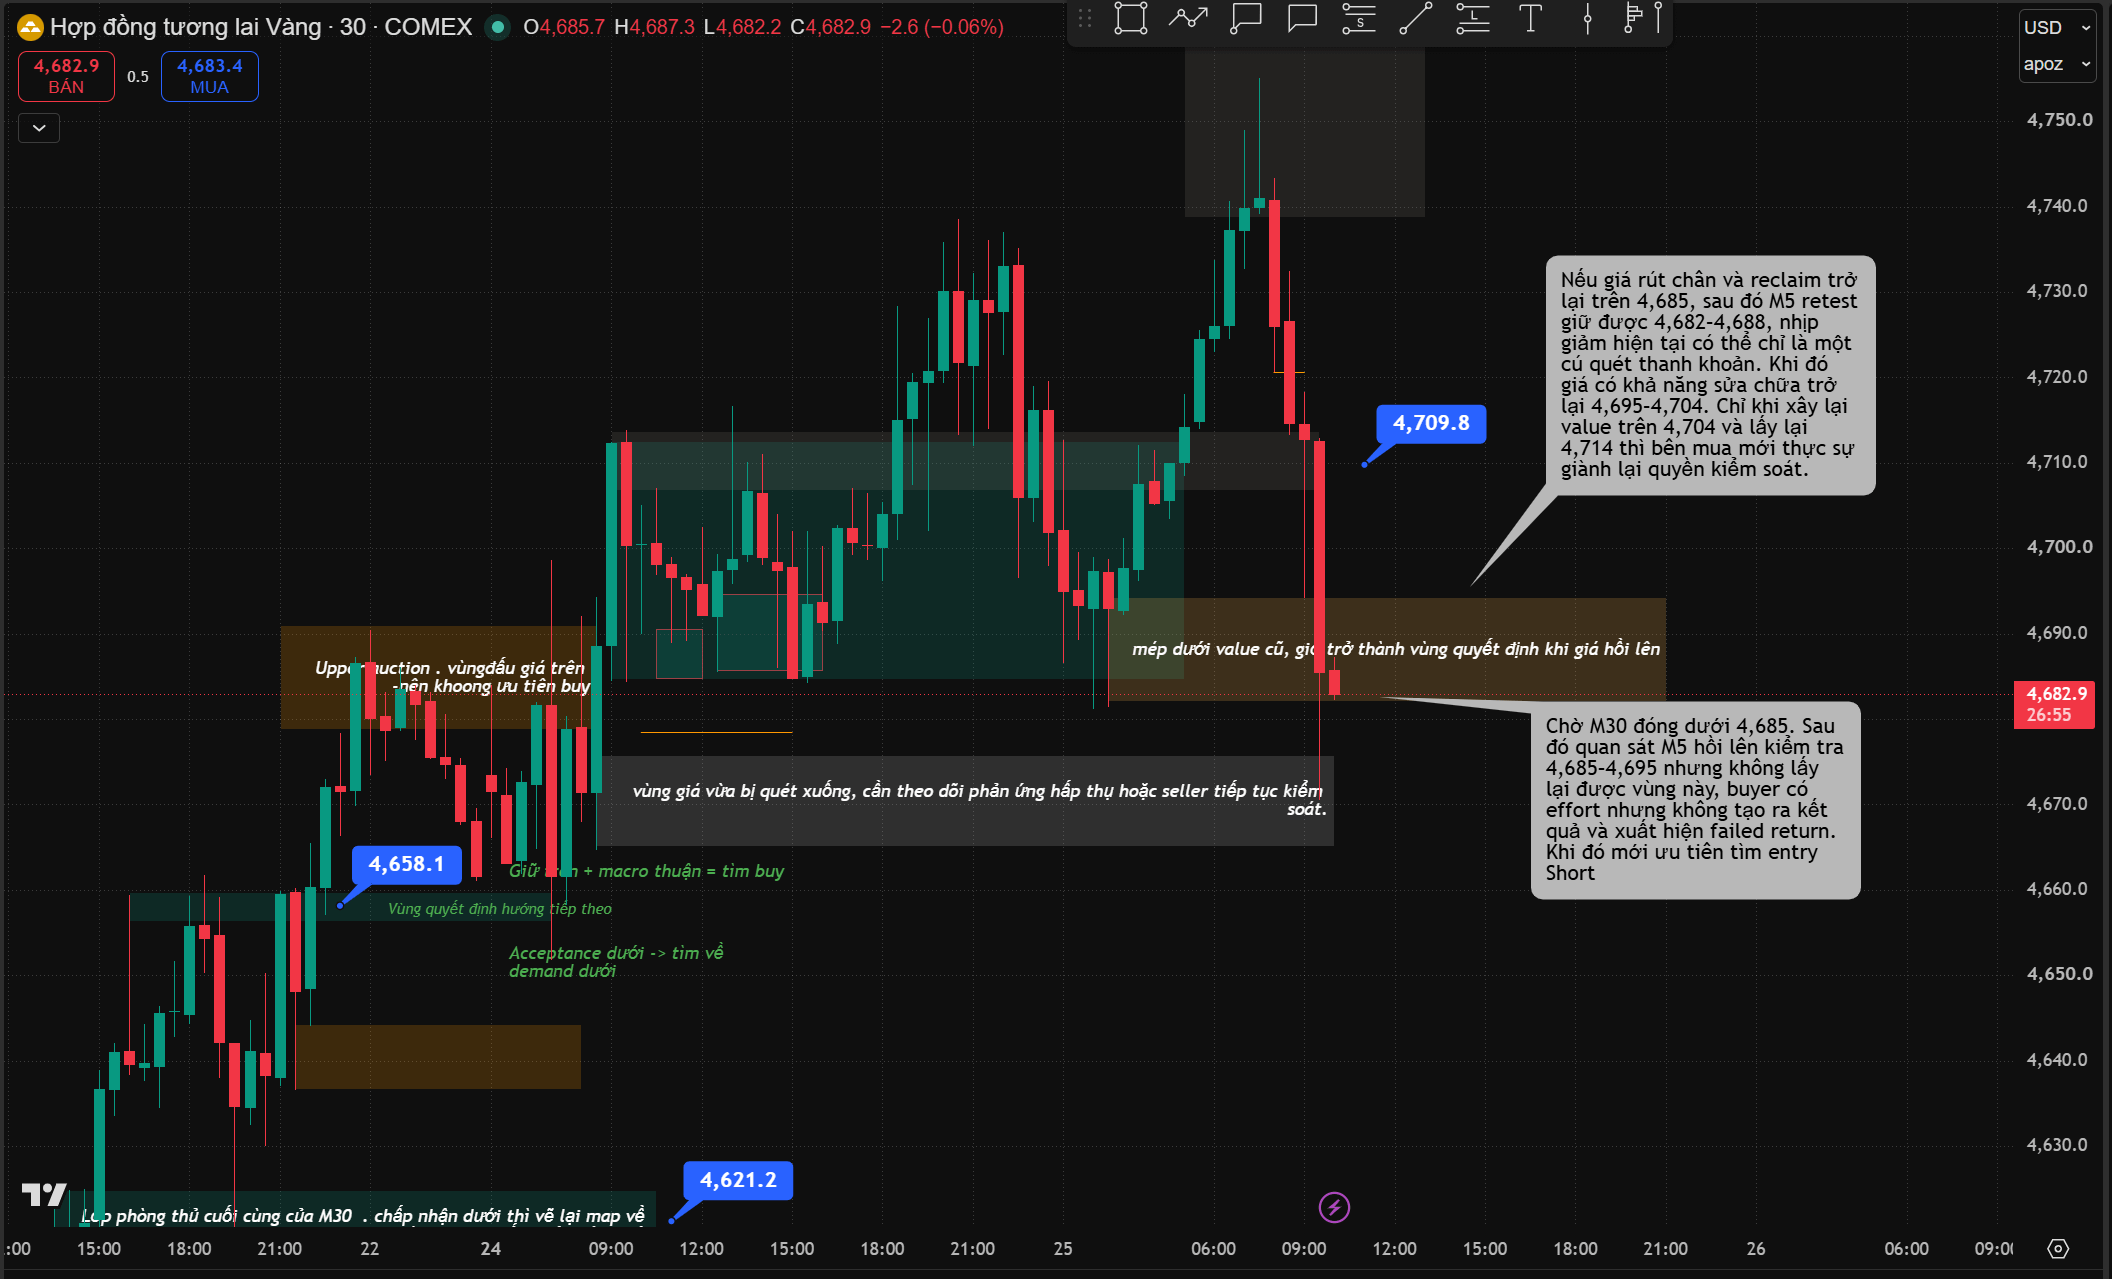
#XAU – UPDATE PLAN
Prices have been rejected in the 4,740–4,755 peak zone and are now pulling back to check the entire lower value area. The current M30 candle opened around 4,712, pushed down to 4,670.5, and is now trading around 4,682.
This indicates that the sellers are controlling the short-term momentum and have already broken through the lower edge of the 4,685–4,714 value zone. However, the M30 candle has not closed yet, so this is currently only a breakdown attempt; it is not enough to conclude that the market has accepted trading lower.
Areas to watch:
• 4,685–4,695: the lower edge of the old value, now becoming the decision zone when price retraces.
• 4,670–4,676: the zone that was just swept; watch for absorption behavior or whether sellers continue to control.
• 4,658–4,668: the deeper defensive zone of the M30 structure.
• 4,700–4,714: the price area that must be reclaimed if buyers want to correct the current bearish move.
Sell continuation scenario:
Wait for the M30 candle to close below 4,685. Then watch for an M5 pullback to test 4,685–4,695, but if it cannot reclaim that zone, with buyers showing effort yet not producing results and a failed return appearing—only then prioritize a Short entry, with the next observation zones being 4,670 and 4,658–4,668.
Failed breakdown scenario:
If price wicks down and then reclaims above 4,685, and afterward the M5 retest holds within 4,682–4,688, then the current bearish move may only be a liquidity sweep. In that case, price has a higher chance of correcting back to 4,695–4,704. Only if value is rebuilt above 4,704 and 4,714 is reclaimed will buyers truly regain control.
I updated the image to be clearer
#TinFed #tinhieugiaodich
Prices have been rejected in the 4,740–4,755 peak zone and are now pulling back to check the entire lower value area. The current M30 candle opened around 4,712, pushed down to 4,670.5, and is now trading around 4,682.
This indicates that the sellers are controlling the short-term momentum and have already broken through the lower edge of the 4,685–4,714 value zone. However, the M30 candle has not closed yet, so this is currently only a breakdown attempt; it is not enough to conclude that the market has accepted trading lower.
Areas to watch:
• 4,685–4,695: the lower edge of the old value, now becoming the decision zone when price retraces.
• 4,670–4,676: the zone that was just swept; watch for absorption behavior or whether sellers continue to control.
• 4,658–4,668: the deeper defensive zone of the M30 structure.
• 4,700–4,714: the price area that must be reclaimed if buyers want to correct the current bearish move.
Sell continuation scenario:
Wait for the M30 candle to close below 4,685. Then watch for an M5 pullback to test 4,685–4,695, but if it cannot reclaim that zone, with buyers showing effort yet not producing results and a failed return appearing—only then prioritize a Short entry, with the next observation zones being 4,670 and 4,658–4,668.
Failed breakdown scenario:
If price wicks down and then reclaims above 4,685, and afterward the M5 retest holds within 4,682–4,688, then the current bearish move may only be a liquidity sweep. In that case, price has a higher chance of correcting back to 4,695–4,704. Only if value is rebuilt above 4,704 and 4,714 is reclaimed will buyers truly regain control.
I updated the image to be clearer
#TinFed #tinhieugiaodich
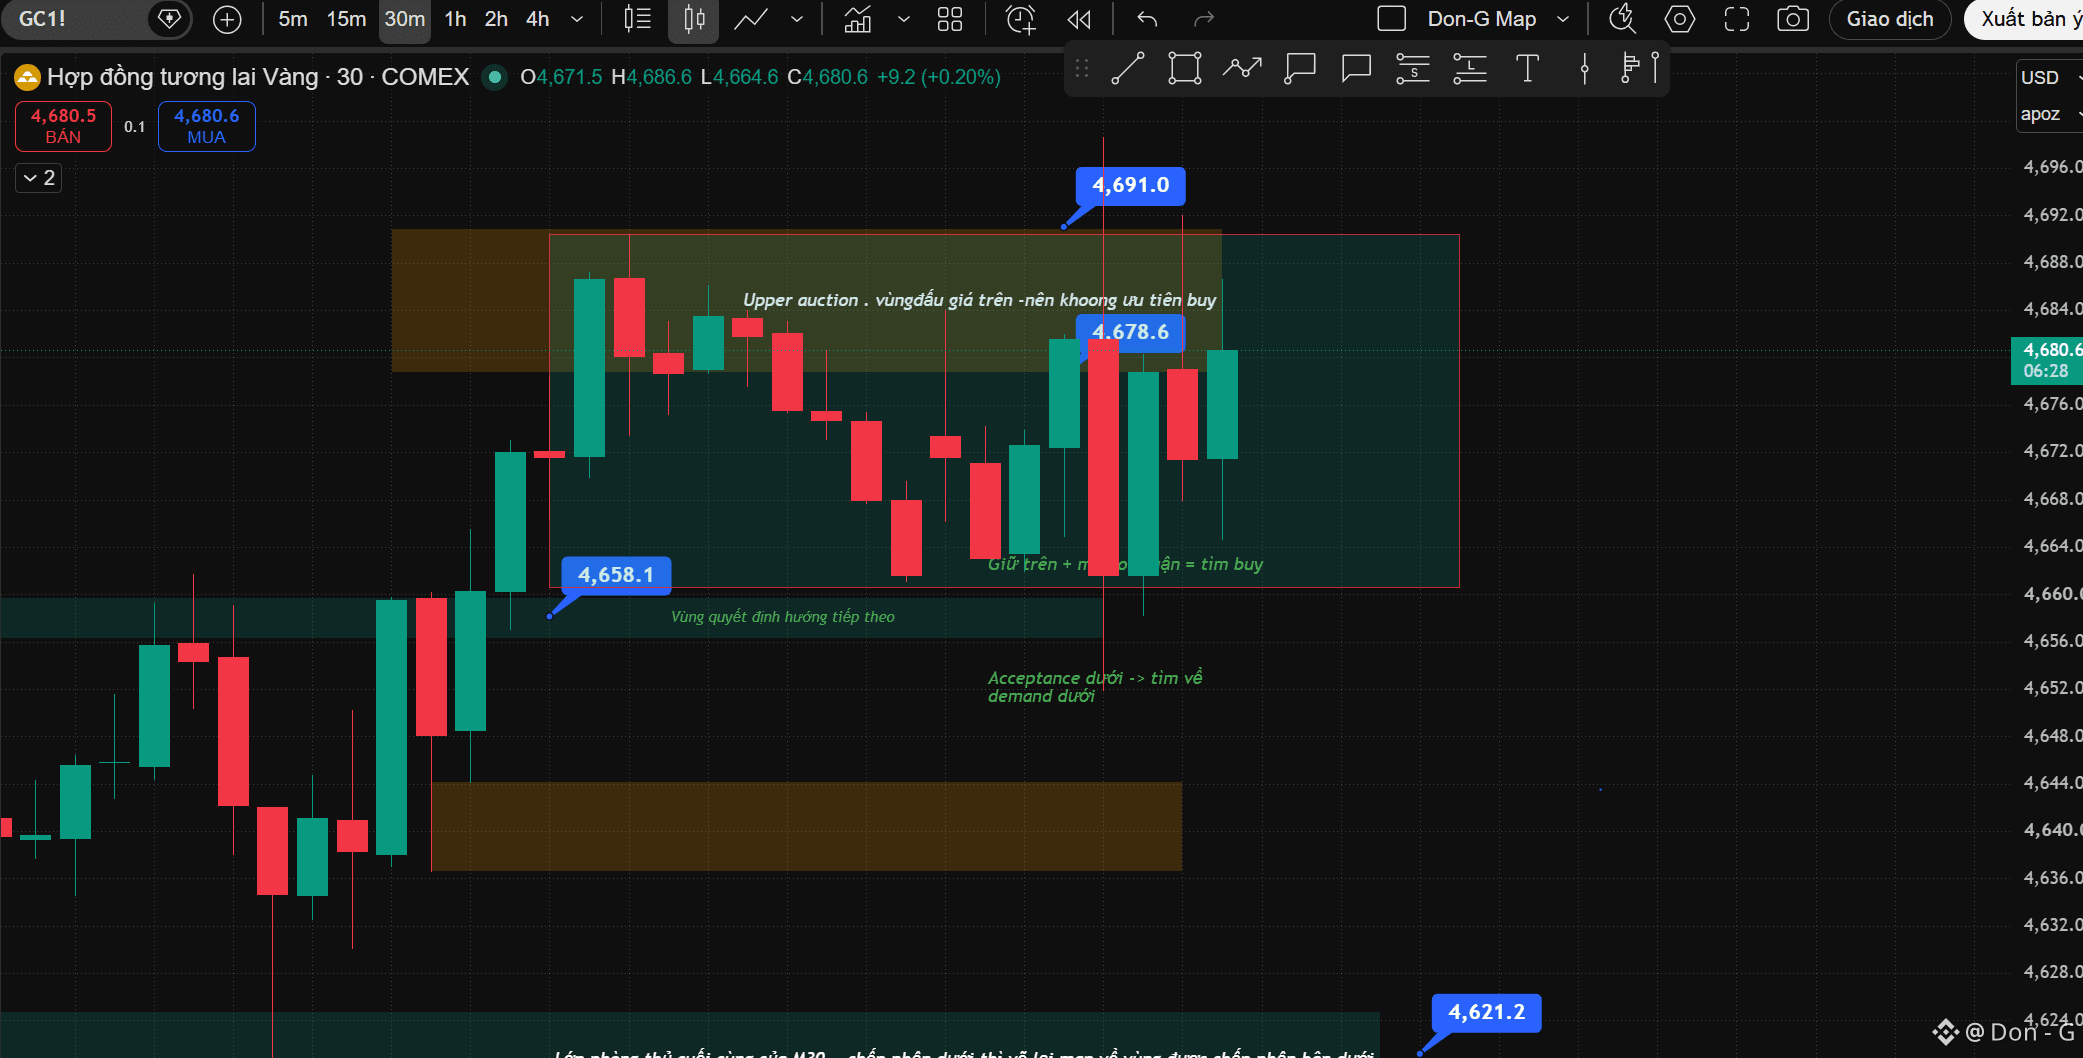
Brief update: Gold #XAUUSD #PAXG
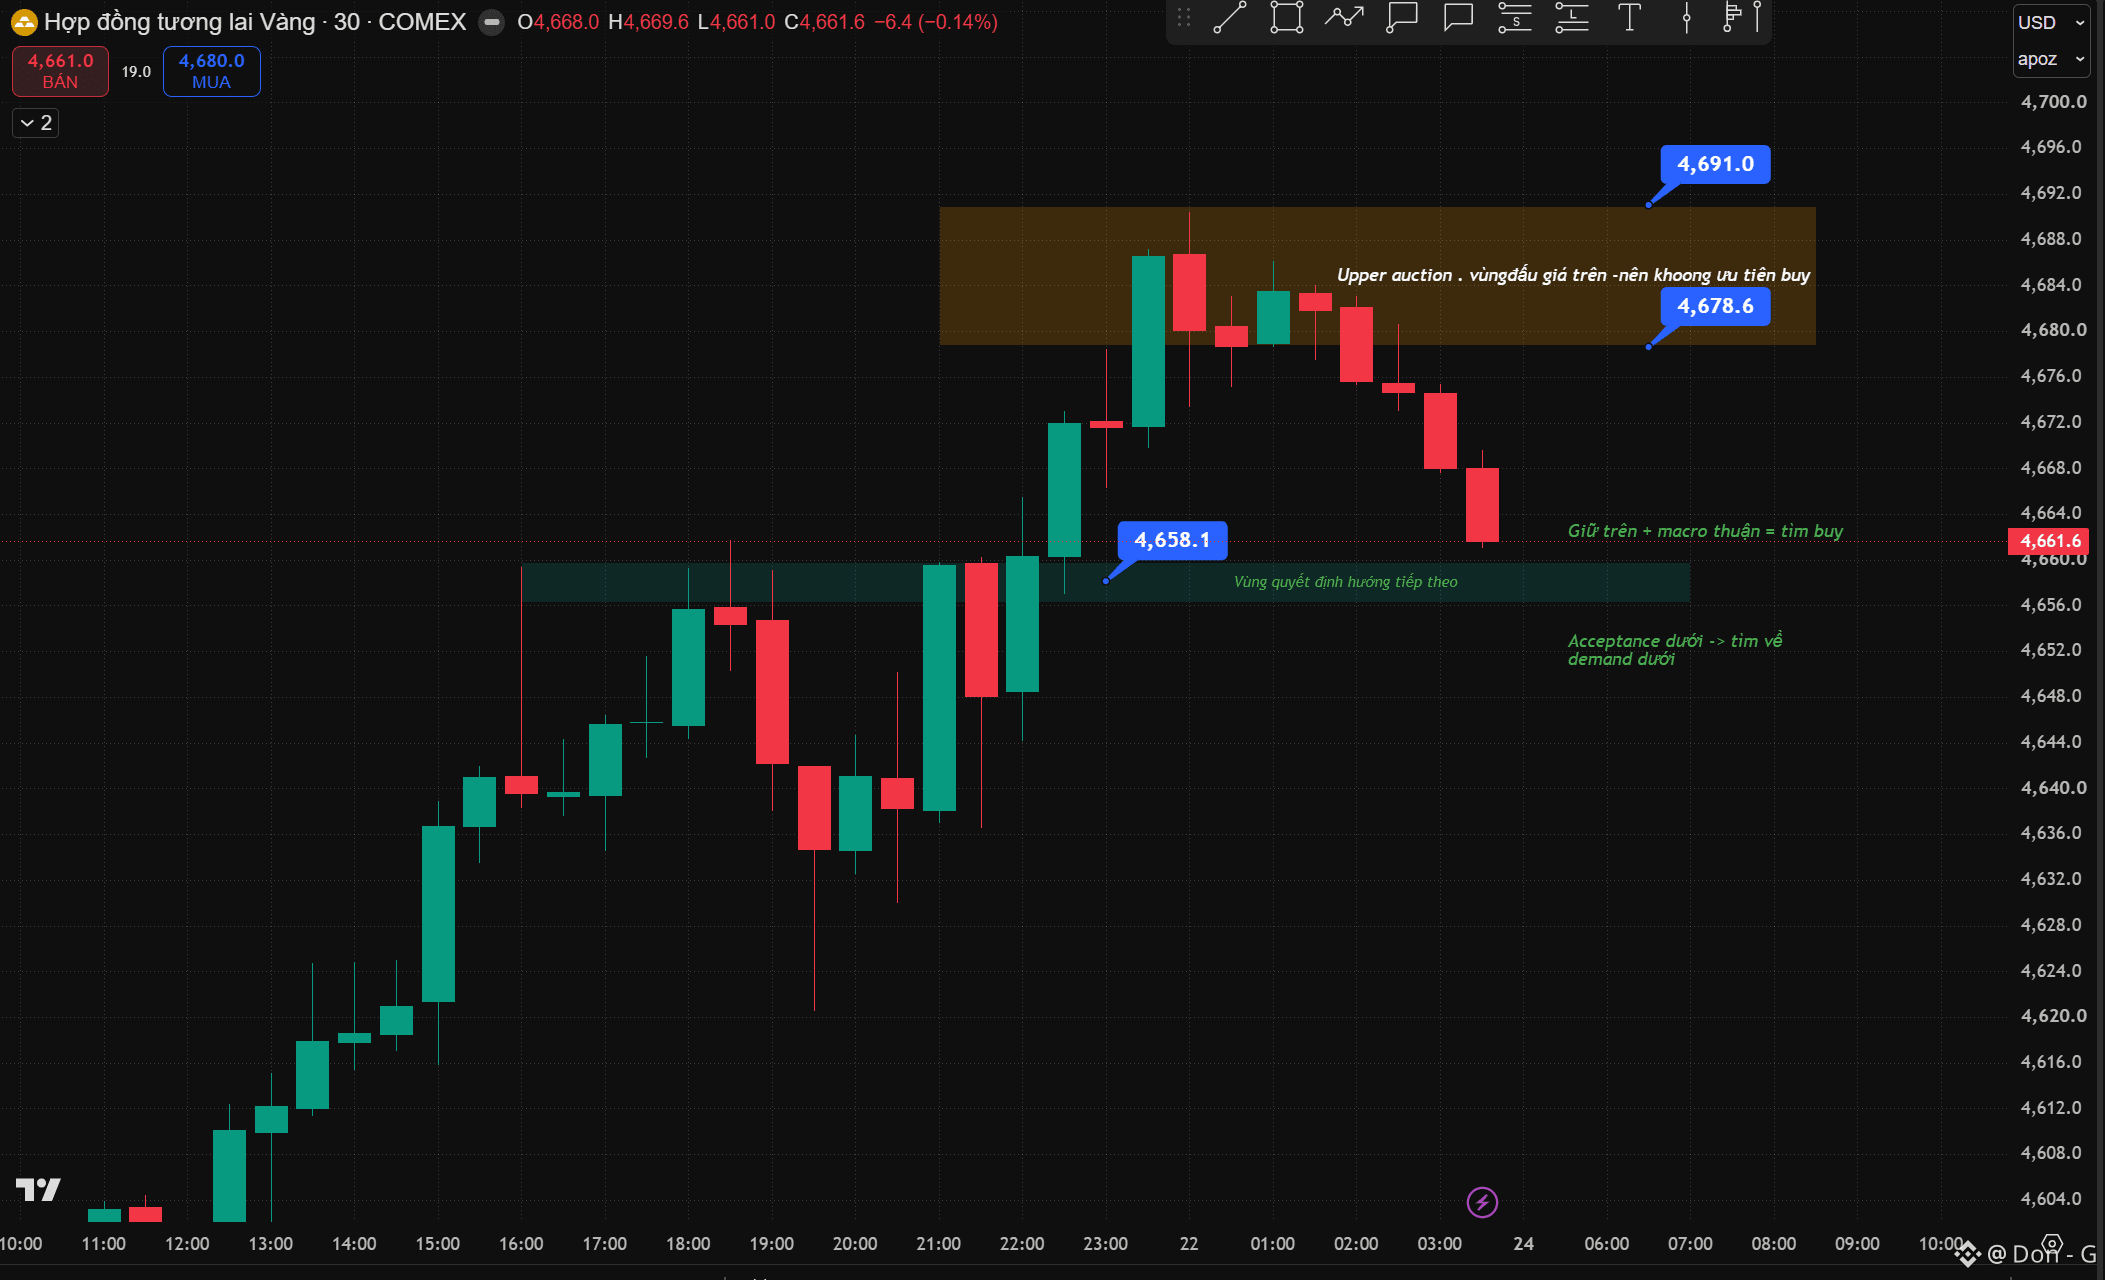
4,658 successfully defended; the price bounced up to check 4,678.6. However, the buyer failed to gain acceptance in the upper auction 4,679–4,691 and was pushed back down. Current price is 4,667.5, sitting between two zones → no good entry location. M30 temporarily shifts to an auction-range battle band of 4,658–4,679; H4 still maintains a bullish bias.
Plan:
Hold 4,658 and wait for M5 confirmation → look to buy again at 4,679, then further targets beyond 4,691. Acceptance above 4,679 → continue opening/pressing on toward 4,691. Close and hold below 4,658 → abandon the buy, switch the map down to 4,637–4,644, and even deeper to 4,618–4,625. If it returns to 4,679 and failure continues → only look for sells when conditions are sufficient.
Conclusion: The map is not broken yet. The buyer can hold the lower zone, but has not won the upper zone.
#cryptouniverseofficial #coinaute
4,658 successfully defended; the price bounced up to check 4,678.6. However, the buyer failed to gain acceptance in the upper auction 4,679–4,691 and was pushed back down. Current price is 4,667.5, sitting between two zones → no good entry location. M30 temporarily shifts to an auction-range battle band of 4,658–4,679; H4 still maintains a bullish bias.
Plan:
Hold 4,658 and wait for M5 confirmation → look to buy again at 4,679, then further targets beyond 4,691. Acceptance above 4,679 → continue opening/pressing on toward 4,691. Close and hold below 4,658 → abandon the buy, switch the map down to 4,637–4,644, and even deeper to 4,618–4,625. If it returns to 4,679 and failure continues → only look for sells when conditions are sufficient.
Conclusion: The map is not broken yet. The buyer can hold the lower zone, but has not won the upper zone.
#cryptouniverseofficial #coinaute
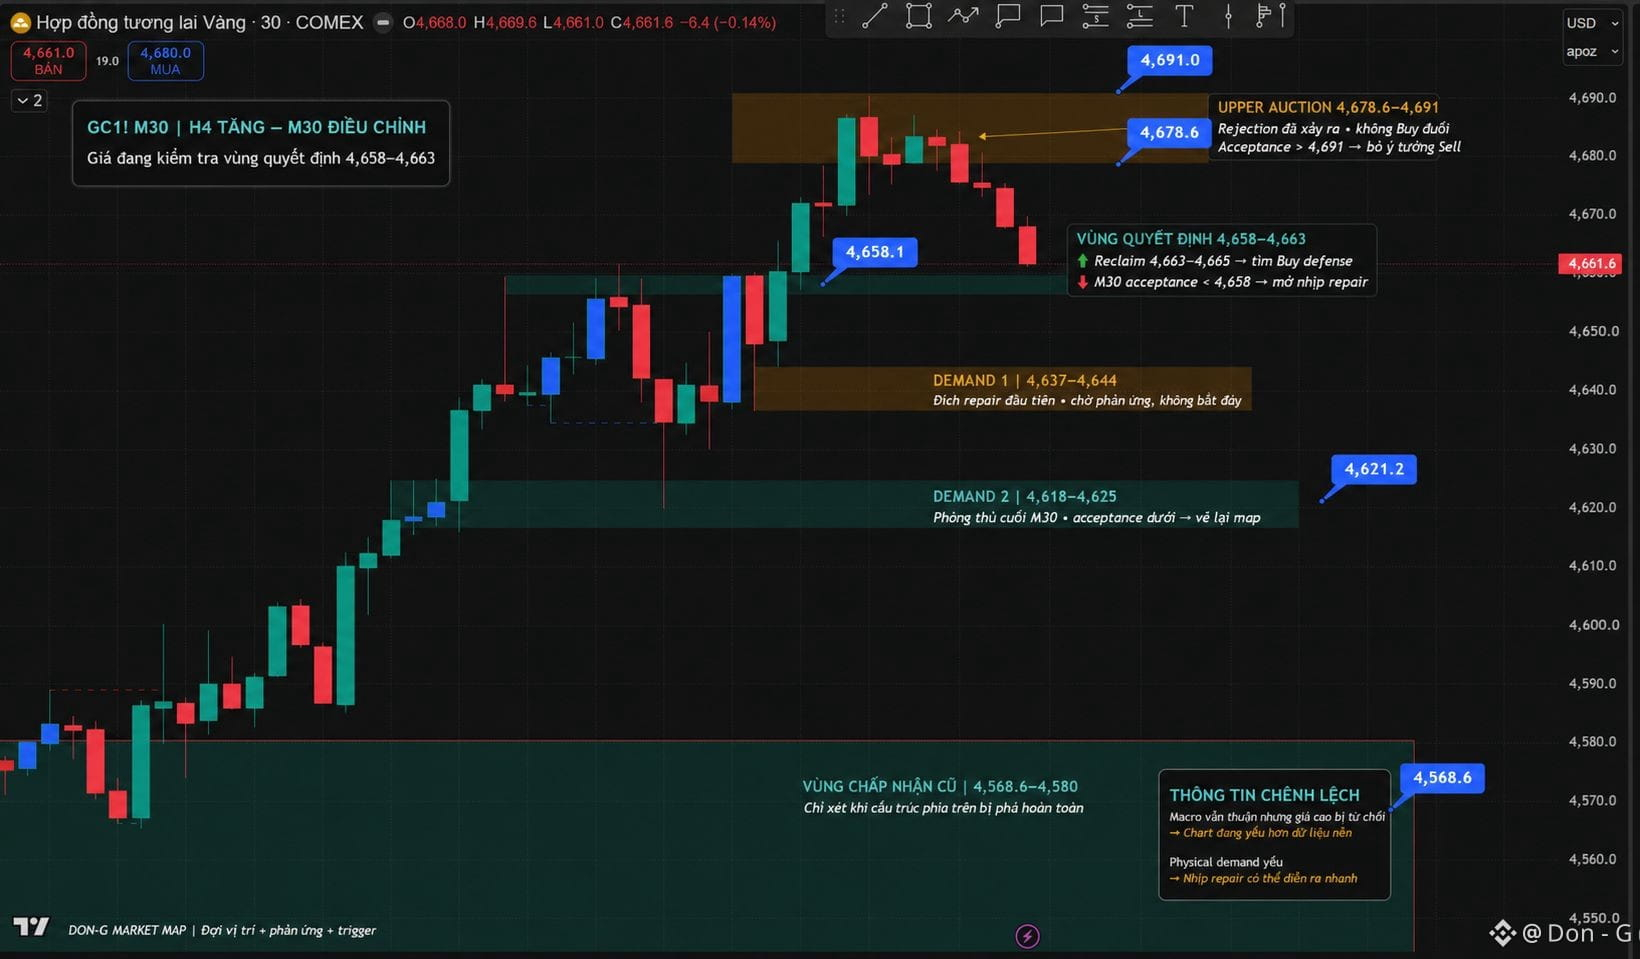
#XAU 24 - 28/8 If the buyer continues to be unable to protect the 4,658 level, the financial premium from the recent increase may be quickly removed to lower demand zones.
#45NgayTuDoTaiChinh #TinFed #tinhieugiaodich
#45NgayTuDoTaiChinh #TinFed #tinhieugiaodich
Gold #XAU rises despite nominal long-term yields remaining high. This suggests the fiscal/debasement regime or term premium is overpowering the simple rule of thumb “yield up = gold down.” Therefore, you must prioritize DXY and real yields, not just nominal yields.
OI and net longs both increase ahead of the breakout. The move involves new positioning, not purely short-covering. However, the COT data is as of 18/8, before the strongest impulse midweek; we cannot accurately confirm who bought on the last weekend session.
Call hedging amplifies both directions. Dealers buy futures when delta rises, which can push prices up quickly; when options are unwound, hedging may reverse as well, enabling a fast “repair.” Don’t label 4,700 as an option wall because there’s no strike-allocation data yet.
Physical demand doesn’t chase prices. The current trend relies heavily on financial flows. If DXY/real yields turn around, the weak physical cushion makes the thin auction segment from 4,658 to 4,640 easier to move through quickly.
#XAUUSD #TrendingTopic
OI and net longs both increase ahead of the breakout. The move involves new positioning, not purely short-covering. However, the COT data is as of 18/8, before the strongest impulse midweek; we cannot accurately confirm who bought on the last weekend session.
Call hedging amplifies both directions. Dealers buy futures when delta rises, which can push prices up quickly; when options are unwound, hedging may reverse as well, enabling a fast “repair.” Don’t label 4,700 as an option wall because there’s no strike-allocation data yet.
Physical demand doesn’t chase prices. The current trend relies heavily on financial flows. If DXY/real yields turn around, the weak physical cushion makes the thin auction segment from 4,658 to 4,640 easier to move through quickly.
#XAUUSD #TrendingTopic
Don - G
·
--
GOLD #XAUUSD #PAXG TỈNH – BUT NOT JUST A SINGLE BREAKOUT
The current uptrend is being supported by multiple streams of data at the same time: the DXY weakens to around 98.8, the real yield on 10Y falls from 2.44% to 2.35%, precious metals funds attract about $2.04 billion, and speculative long positioning continues to increase.
Options call demand could also force dealers to buy futures for hedging, thereby amplifying the upward momentum when price breaks above the high.
But what needs attention is that physical gold demand is not keeping up with the price. This suggests that a significant portion of the rally is coming from financial flows. When the USD and real yields reverse, this premium could also unwind very quickly.
Link the data to the Market Map:
• #DXY remains weak; real yields fall and price holds above 4,658 → the backdrop is still favorable for Buy defense, but you need to wait for a confirmation trigger.
• DXY rebounds strongly; real yields rise and price is accepted below 4,658 → the likelihood of the market repairing downward to lower demand zones increases.
• Macro is still supportive, but the 4,677–4,691 area is repeatedly rejected → don’t force a Buy. The chart is telling you that money flows have not yet been accepted at higher price levels.
The gap in information is here:
It’s not just that gold is rising—know where the buying strength is coming from, what buffer layer is missing, and what could cause the flows to reverse.
#TheoDõiFOMC #tinhieugiaodich
The current uptrend is being supported by multiple streams of data at the same time: the DXY weakens to around 98.8, the real yield on 10Y falls from 2.44% to 2.35%, precious metals funds attract about $2.04 billion, and speculative long positioning continues to increase.
Options call demand could also force dealers to buy futures for hedging, thereby amplifying the upward momentum when price breaks above the high.
But what needs attention is that physical gold demand is not keeping up with the price. This suggests that a significant portion of the rally is coming from financial flows. When the USD and real yields reverse, this premium could also unwind very quickly.
Link the data to the Market Map:
• #DXY remains weak; real yields fall and price holds above 4,658 → the backdrop is still favorable for Buy defense, but you need to wait for a confirmation trigger.
• DXY rebounds strongly; real yields rise and price is accepted below 4,658 → the likelihood of the market repairing downward to lower demand zones increases.
• Macro is still supportive, but the 4,677–4,691 area is repeatedly rejected → don’t force a Buy. The chart is telling you that money flows have not yet been accepted at higher price levels.
The gap in information is here:
It’s not just that gold is rising—know where the buying strength is coming from, what buffer layer is missing, and what could cause the flows to reverse.
#TheoDõiFOMC #tinhieugiaodich
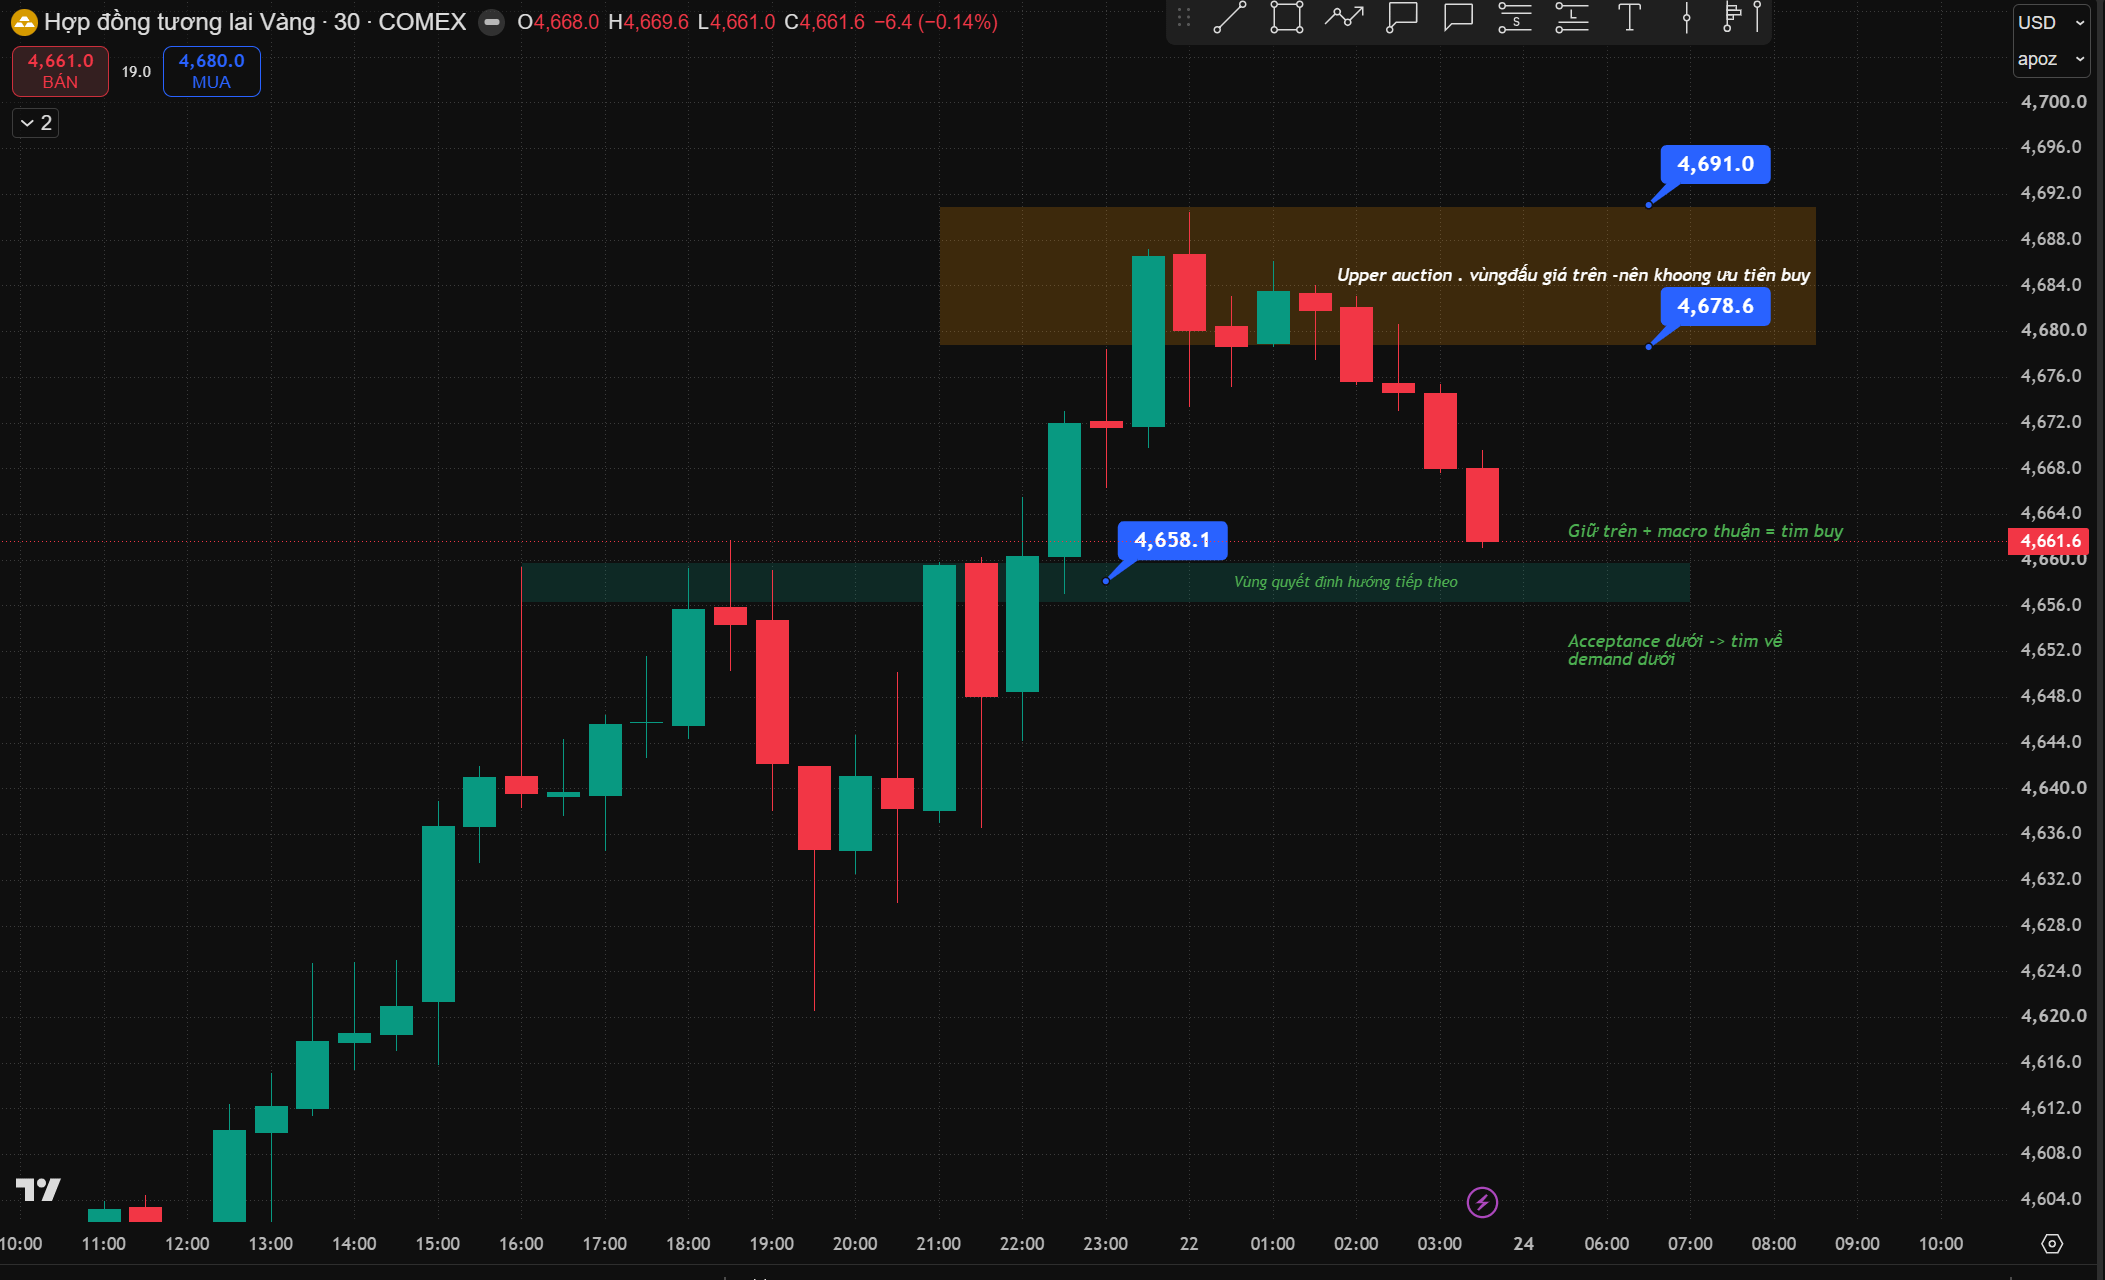
GOLD #XAUUSD #PAXG TỈNH – BUT NOT JUST A SINGLE BREAKOUT
The current uptrend is being supported by multiple streams of data at the same time: the DXY weakens to around 98.8, the real yield on 10Y falls from 2.44% to 2.35%, precious metals funds attract about $2.04 billion, and speculative long positioning continues to increase.
Options call demand could also force dealers to buy futures for hedging, thereby amplifying the upward momentum when price breaks above the high.
But what needs attention is that physical gold demand is not keeping up with the price. This suggests that a significant portion of the rally is coming from financial flows. When the USD and real yields reverse, this premium could also unwind very quickly.
Link the data to the Market Map:
• #DXY remains weak; real yields fall and price holds above 4,658 → the backdrop is still favorable for Buy defense, but you need to wait for a confirmation trigger.
• DXY rebounds strongly; real yields rise and price is accepted below 4,658 → the likelihood of the market repairing downward to lower demand zones increases.
• Macro is still supportive, but the 4,677–4,691 area is repeatedly rejected → don’t force a Buy. The chart is telling you that money flows have not yet been accepted at higher price levels.
The gap in information is here:
It’s not just that gold is rising—know where the buying strength is coming from, what buffer layer is missing, and what could cause the flows to reverse.
#TheoDõiFOMC #tinhieugiaodich
The current uptrend is being supported by multiple streams of data at the same time: the DXY weakens to around 98.8, the real yield on 10Y falls from 2.44% to 2.35%, precious metals funds attract about $2.04 billion, and speculative long positioning continues to increase.
Options call demand could also force dealers to buy futures for hedging, thereby amplifying the upward momentum when price breaks above the high.
But what needs attention is that physical gold demand is not keeping up with the price. This suggests that a significant portion of the rally is coming from financial flows. When the USD and real yields reverse, this premium could also unwind very quickly.
Link the data to the Market Map:
• #DXY remains weak; real yields fall and price holds above 4,658 → the backdrop is still favorable for Buy defense, but you need to wait for a confirmation trigger.
• DXY rebounds strongly; real yields rise and price is accepted below 4,658 → the likelihood of the market repairing downward to lower demand zones increases.
• Macro is still supportive, but the 4,677–4,691 area is repeatedly rejected → don’t force a Buy. The chart is telling you that money flows have not yet been accepted at higher price levels.
The gap in information is here:
It’s not just that gold is rising—know where the buying strength is coming from, what buffer layer is missing, and what could cause the flows to reverse.
#TheoDõiFOMC #tinhieugiaodich
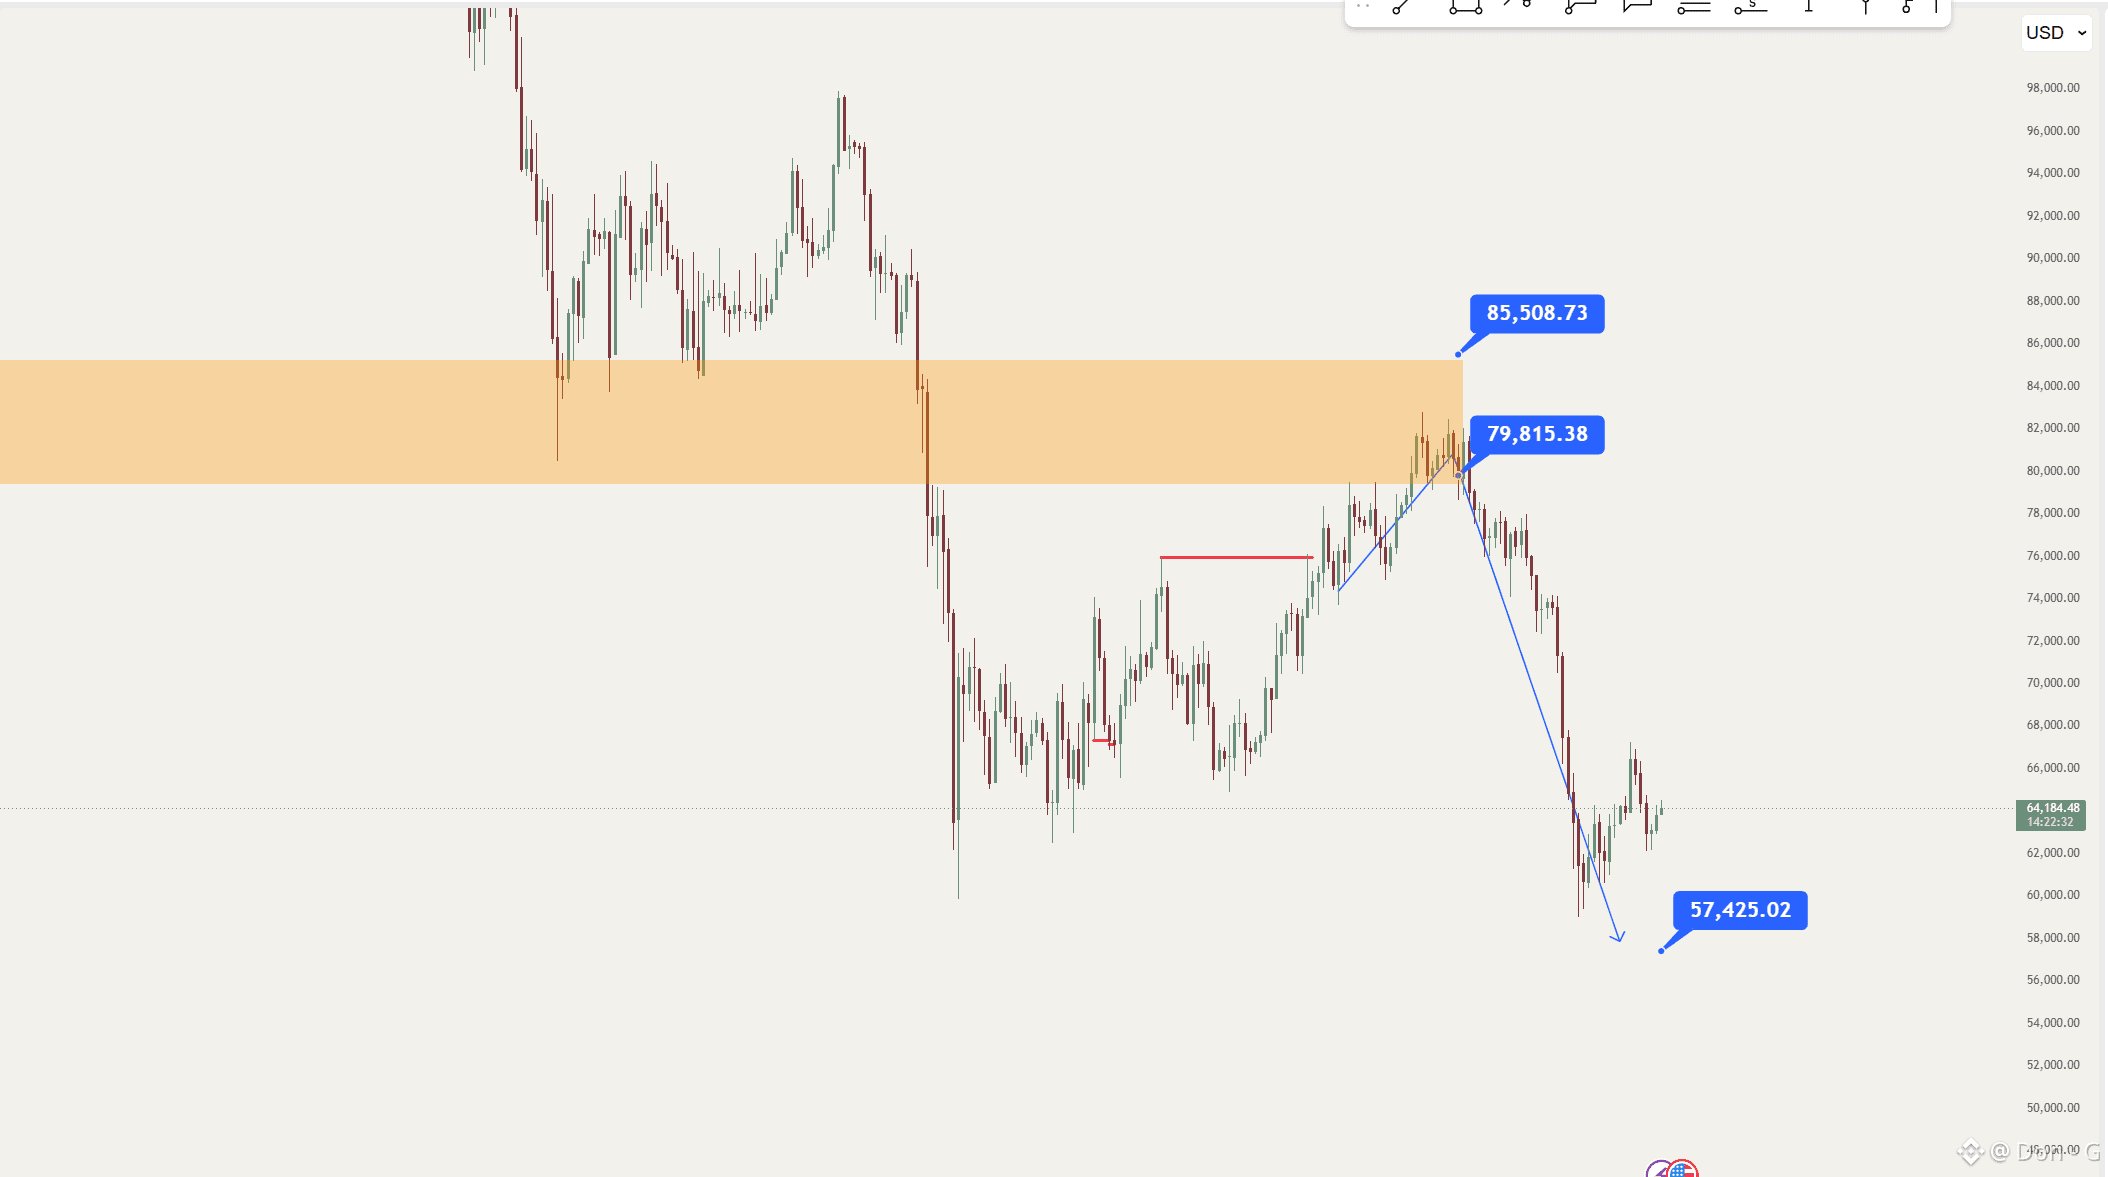
Old stories coming back. I also highlighted the confirmation time for the drop when the price approached the 79-85k zone in the previous post. The market had already provided us with enough data before taking action. So, we just need to follow what the market has shown us, and that's more than enough. #CreatorpadVN #45NgayTuDoTaiChinh #BTC
Don - G
·
--
#BTC will have a monitoring range of 79-85
Most of the time, it is currently not a good time to aim for a higher target, and it is likely that the price will react at 79-85 and return to 55-60 once again.
In the case of a break through, there will be a retest back to 79-85 once again before going up further.
#CreatorpadVN #AltcoinRecoverySignals? #BitcoinPriceTrends #ARKInvestReducedPositionsinCircleandBullish
Most of the time, it is currently not a good time to aim for a higher target, and it is likely that the price will react at 79-85 and return to 55-60 once again.
In the case of a break through, there will be a retest back to 79-85 once again before going up further.
#CreatorpadVN #AltcoinRecoverySignals? #BitcoinPriceTrends #ARKInvestReducedPositionsinCircleandBullish
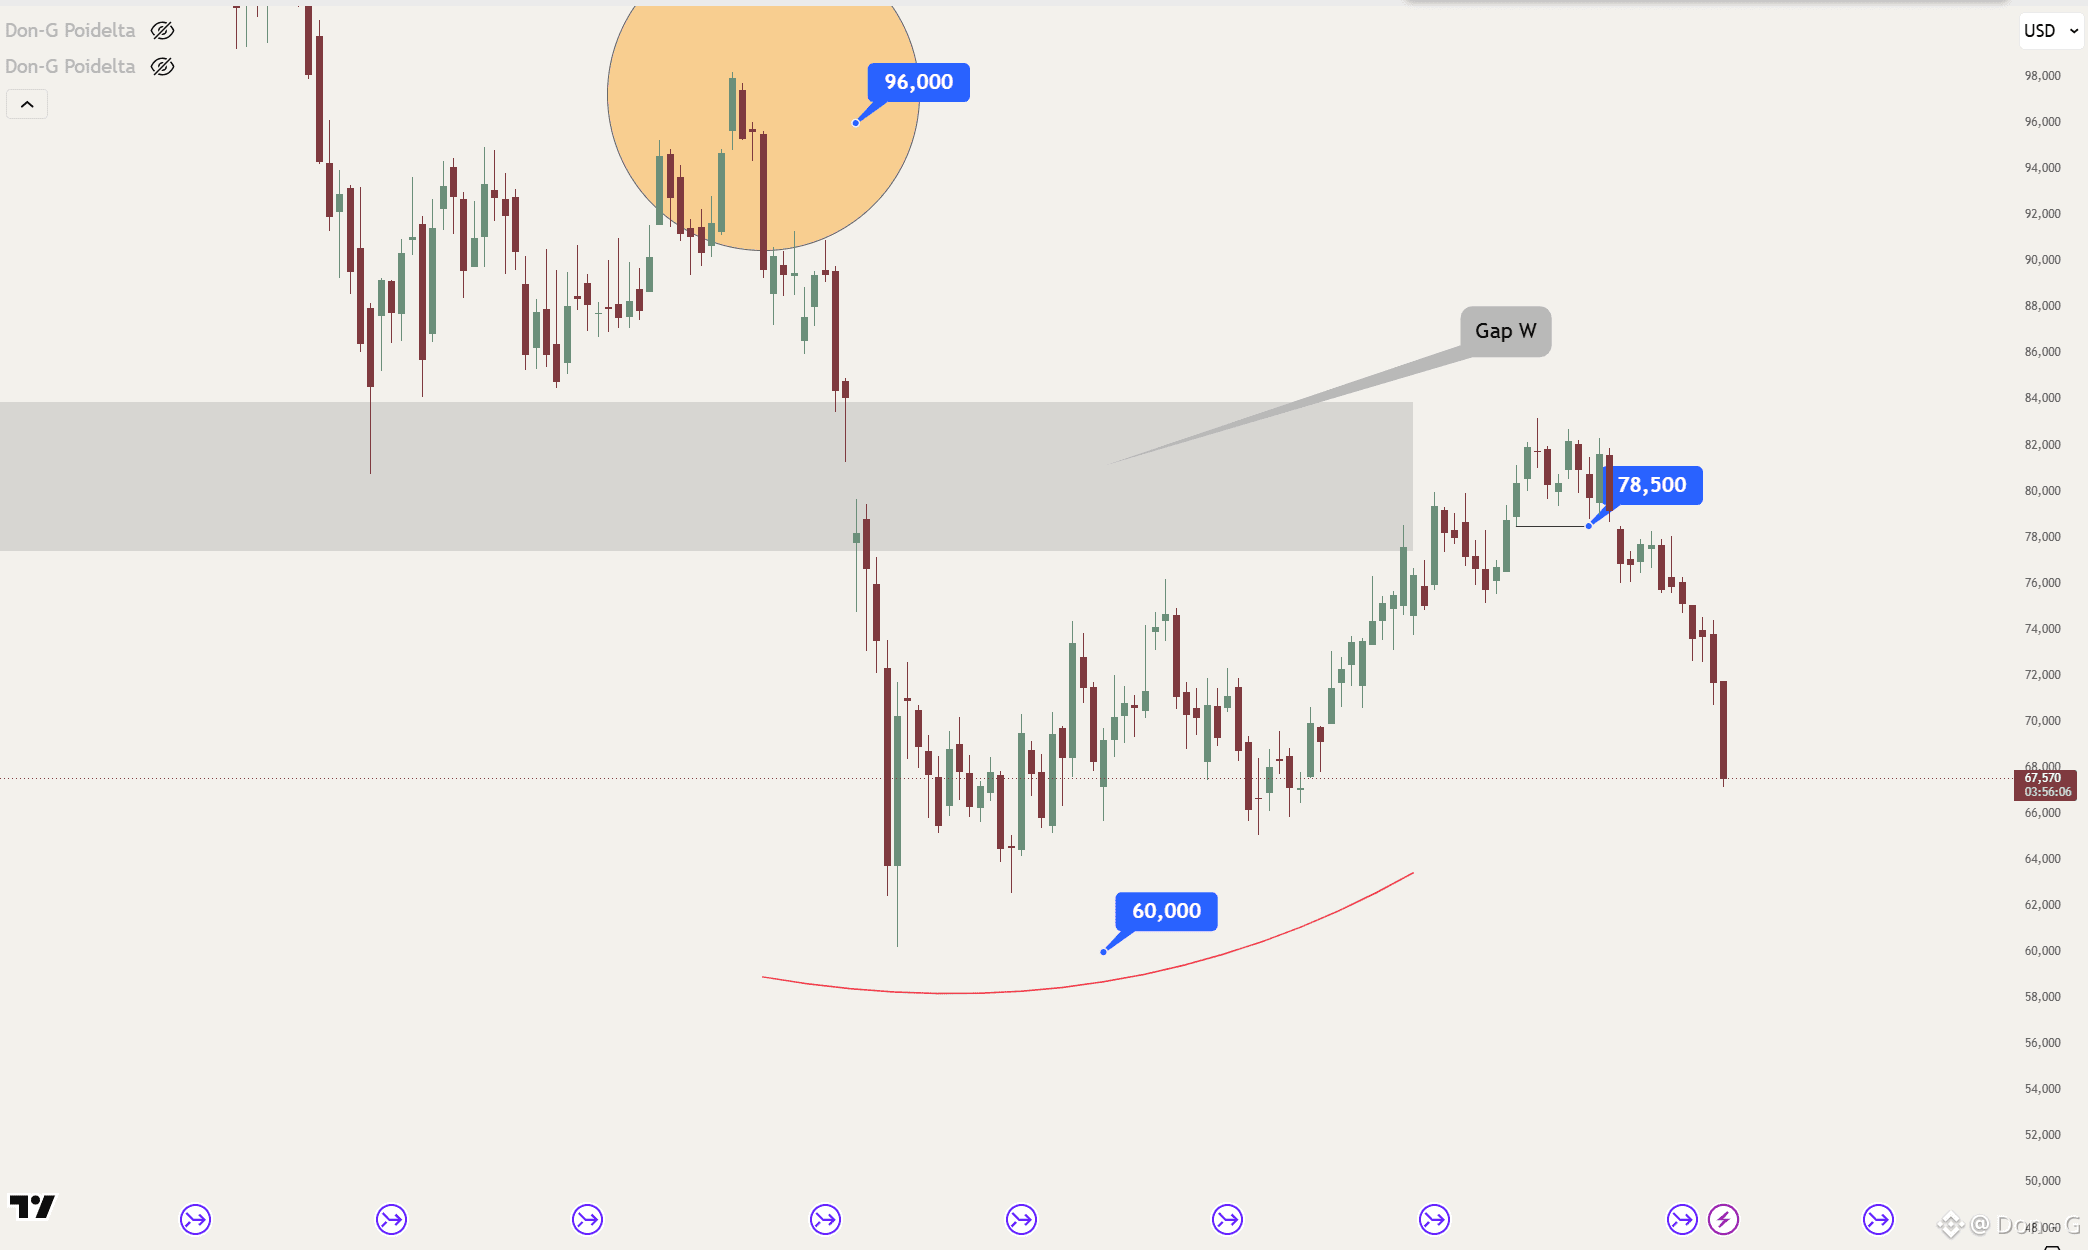
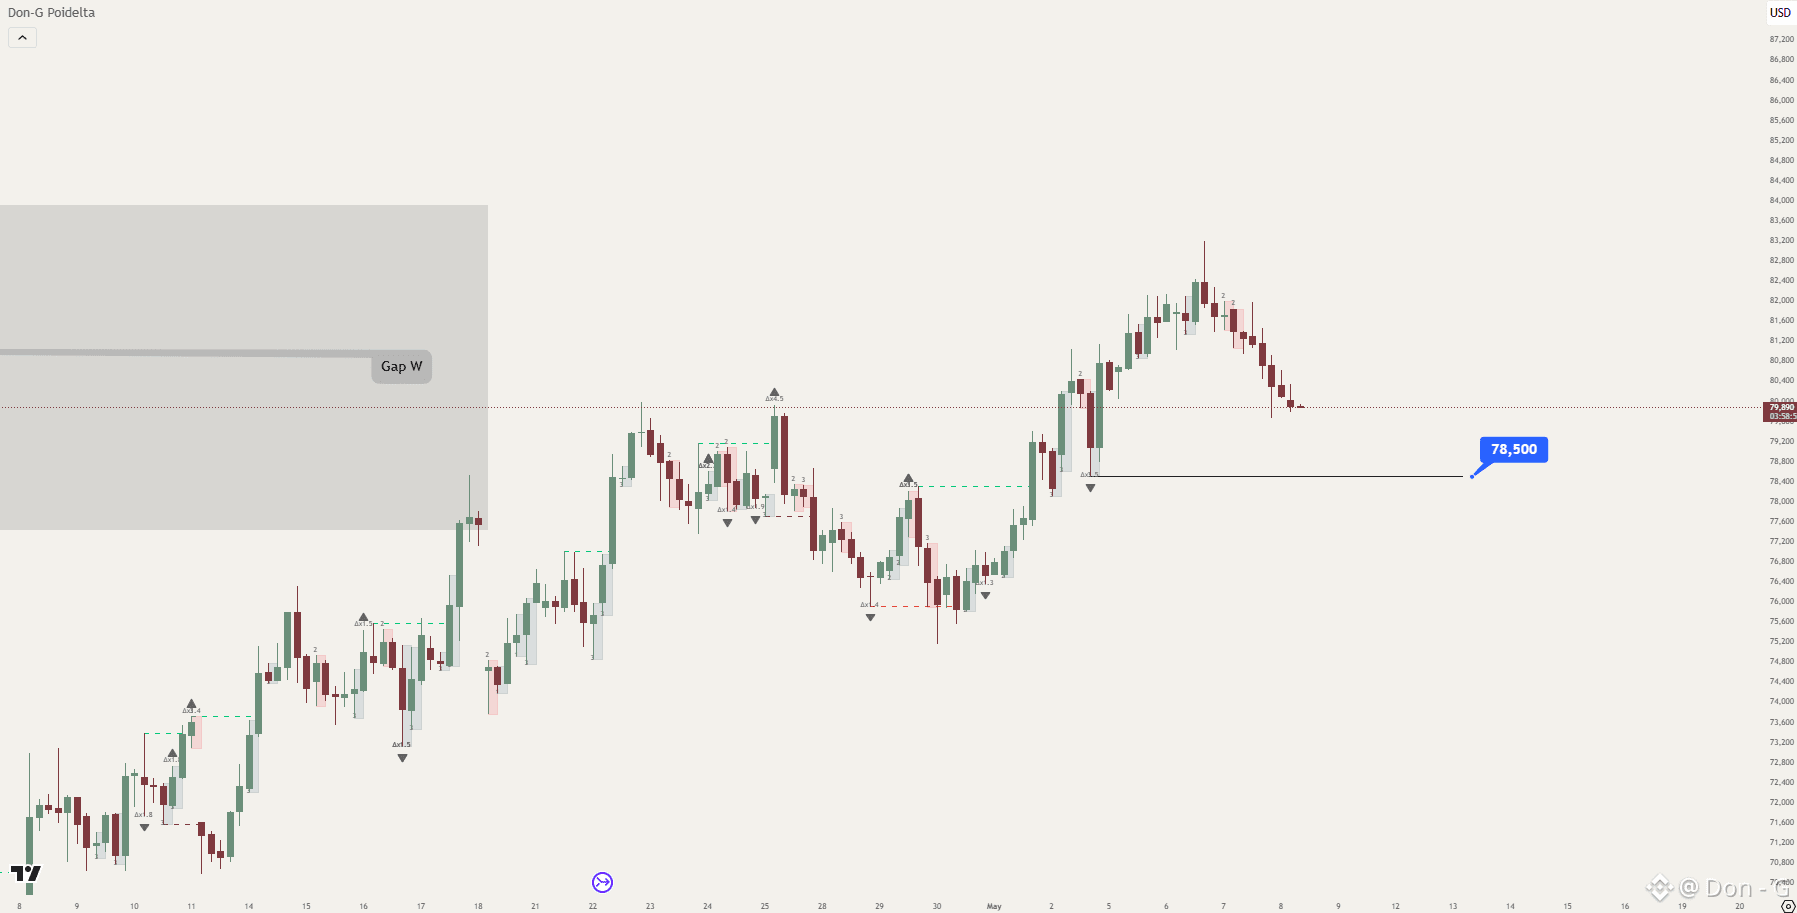
As I warned almost a month ago, those who have been trading alongside me have already exited their positions when #BTC the price broke through 78,500 to target lower levels.
At this point, everything is crystal clear. We can't hope for an uptrend to emerge at this time.
#CreatorpadVN #BTCDOMINACE #downtrend
At this point, everything is crystal clear. We can't hope for an uptrend to emerge at this time.
#CreatorpadVN #BTCDOMINACE #downtrend
Don - G
·
--
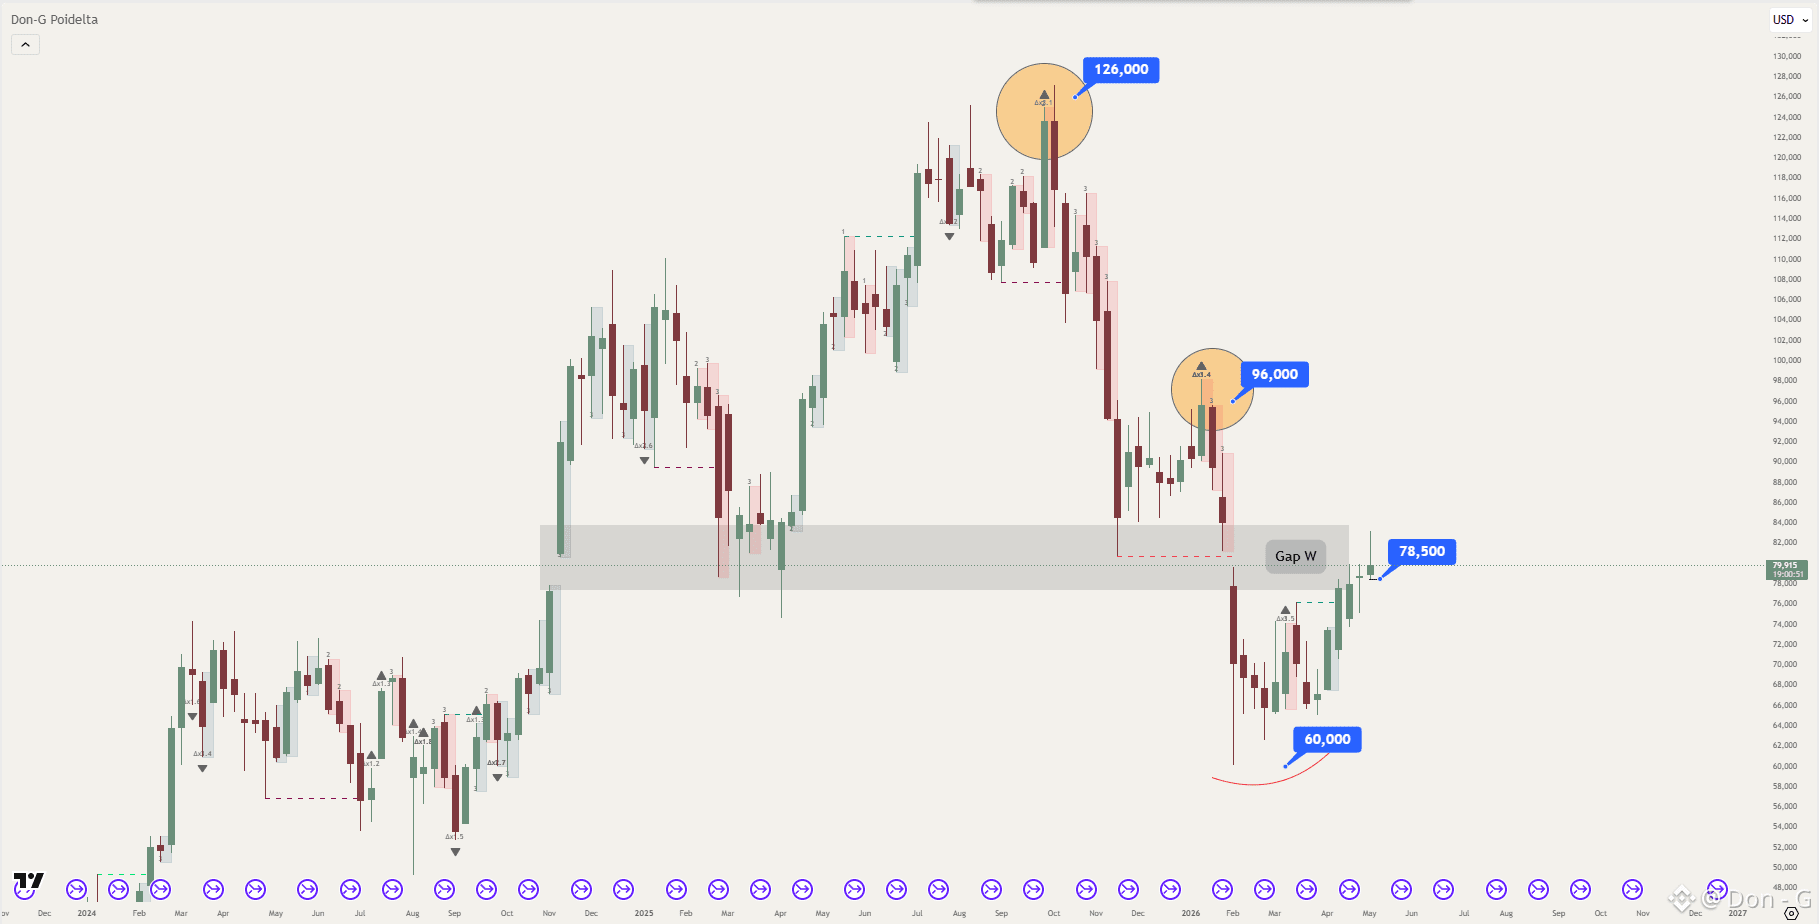
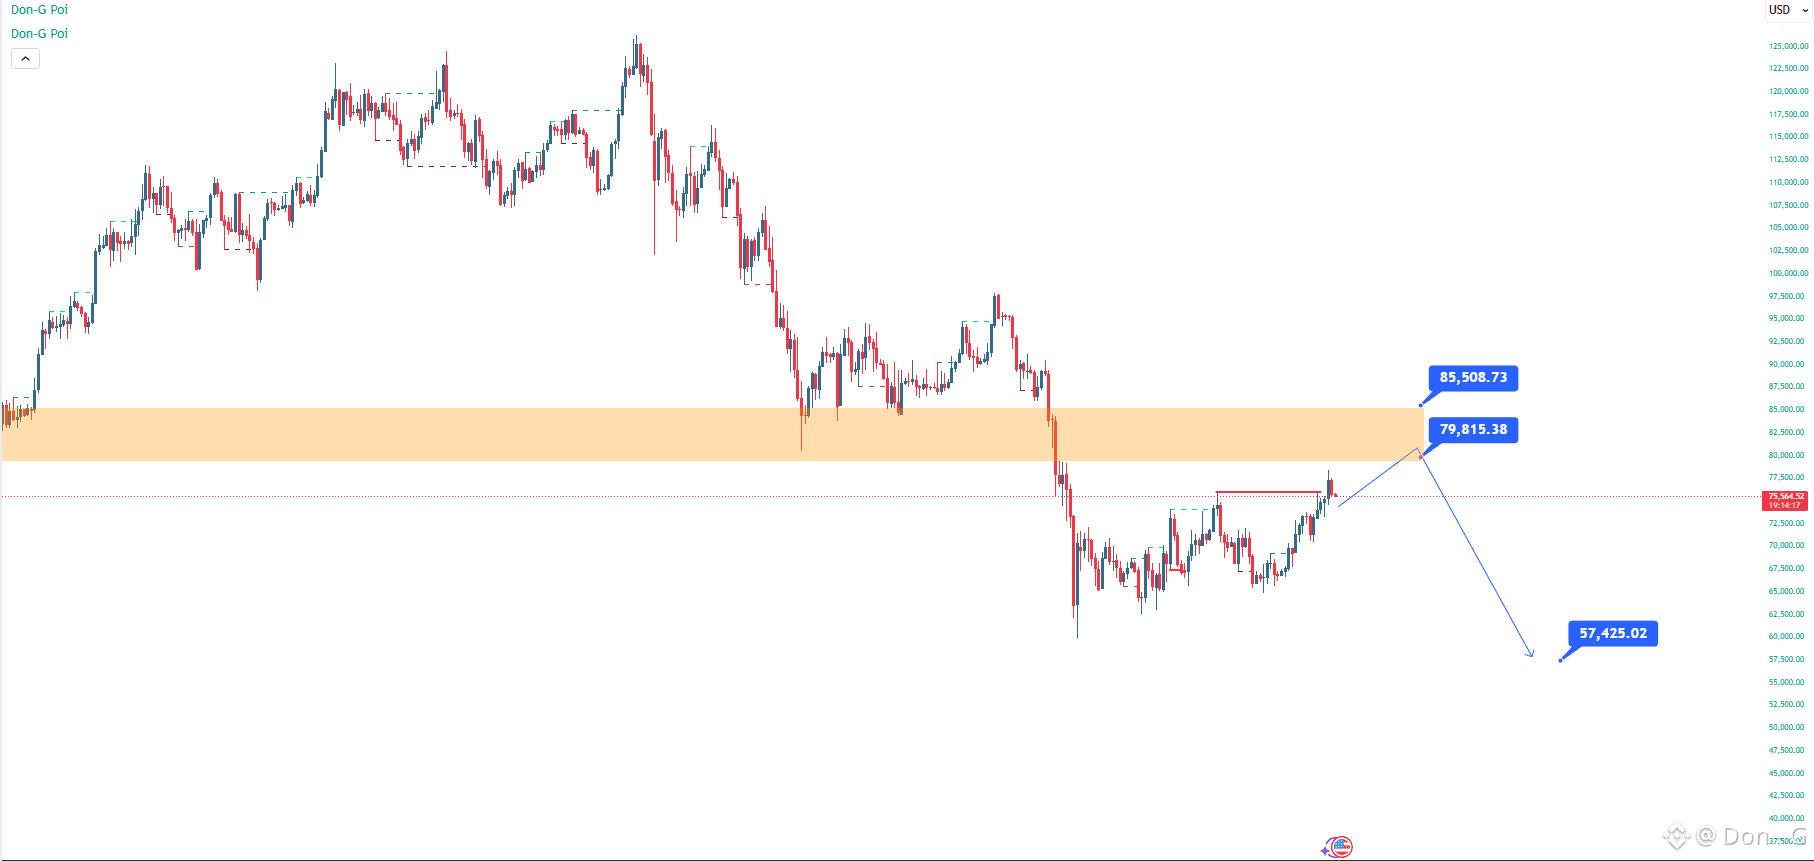
Bearish#BTC isn't necessarily on a real uptrend — it might just be a GAP fill
Looking at the CME data, BTC's current uptick resembles more of a GAP fill than a signal for a strong bullish trend.
On the larger timeframe, the levels at 96,000 and the peak at 126,000 clearly show exhaustion from the bulls. Meanwhile, the recent low around 60,000 hasn't seen enough active buying pressure to confirm a sustainable bottom.
At this point, BTC seems to have completed most of the GAP fill action. Therefore, the 78,500 area is a crucial confirmation zone.
If the price breaks strongly above 78,500, the current uptick scenario will be reinforced as merely a technical bounce, and BTC may enter a deeper downtrend.
(this is just a personal perspective)
#CreatorpadVN #BinanceLaunchesGoldvs.BTCTradingCompetition #ADPPayrollsSurge
Looking at the CME data, BTC's current uptick resembles more of a GAP fill than a signal for a strong bullish trend.
On the larger timeframe, the levels at 96,000 and the peak at 126,000 clearly show exhaustion from the bulls. Meanwhile, the recent low around 60,000 hasn't seen enough active buying pressure to confirm a sustainable bottom.
At this point, BTC seems to have completed most of the GAP fill action. Therefore, the 78,500 area is a crucial confirmation zone.
If the price breaks strongly above 78,500, the current uptick scenario will be reinforced as merely a technical bounce, and BTC may enter a deeper downtrend.
(this is just a personal perspective)
#CreatorpadVN #BinanceLaunchesGoldvs.BTCTradingCompetition #ADPPayrollsSurge
#BTC isn't necessarily on a real uptrend — it might just be a GAP fill
Looking at the CME data, BTC's current uptick resembles more of a GAP fill than a signal for a strong bullish trend.
On the larger timeframe, the levels at 96,000 and the peak at 126,000 clearly show exhaustion from the bulls. Meanwhile, the recent low around 60,000 hasn't seen enough active buying pressure to confirm a sustainable bottom.
At this point, BTC seems to have completed most of the GAP fill action. Therefore, the 78,500 area is a crucial confirmation zone.
If the price breaks strongly above 78,500, the current uptick scenario will be reinforced as merely a technical bounce, and BTC may enter a deeper downtrend.
(this is just a personal perspective)
#CreatorpadVN #BinanceLaunchesGoldvs.BTCTradingCompetition #ADPPayrollsSurge
Looking at the CME data, BTC's current uptick resembles more of a GAP fill than a signal for a strong bullish trend.
On the larger timeframe, the levels at 96,000 and the peak at 126,000 clearly show exhaustion from the bulls. Meanwhile, the recent low around 60,000 hasn't seen enough active buying pressure to confirm a sustainable bottom.
At this point, BTC seems to have completed most of the GAP fill action. Therefore, the 78,500 area is a crucial confirmation zone.
If the price breaks strongly above 78,500, the current uptick scenario will be reinforced as merely a technical bounce, and BTC may enter a deeper downtrend.
(this is just a personal perspective)
#CreatorpadVN #BinanceLaunchesGoldvs.BTCTradingCompetition #ADPPayrollsSurge
#XAUUSD #PAXGUSDT is showing signs of exhaustion on the M30 chart.
There’s a potential drop coming for those looking to set up a short position.
#CreatorpadVN #IranDealHormuzOpen #USAprilADPPayrollsBeatExpectations
There’s a potential drop coming for those looking to set up a short position.
#CreatorpadVN #IranDealHormuzOpen #USAprilADPPayrollsBeatExpectations
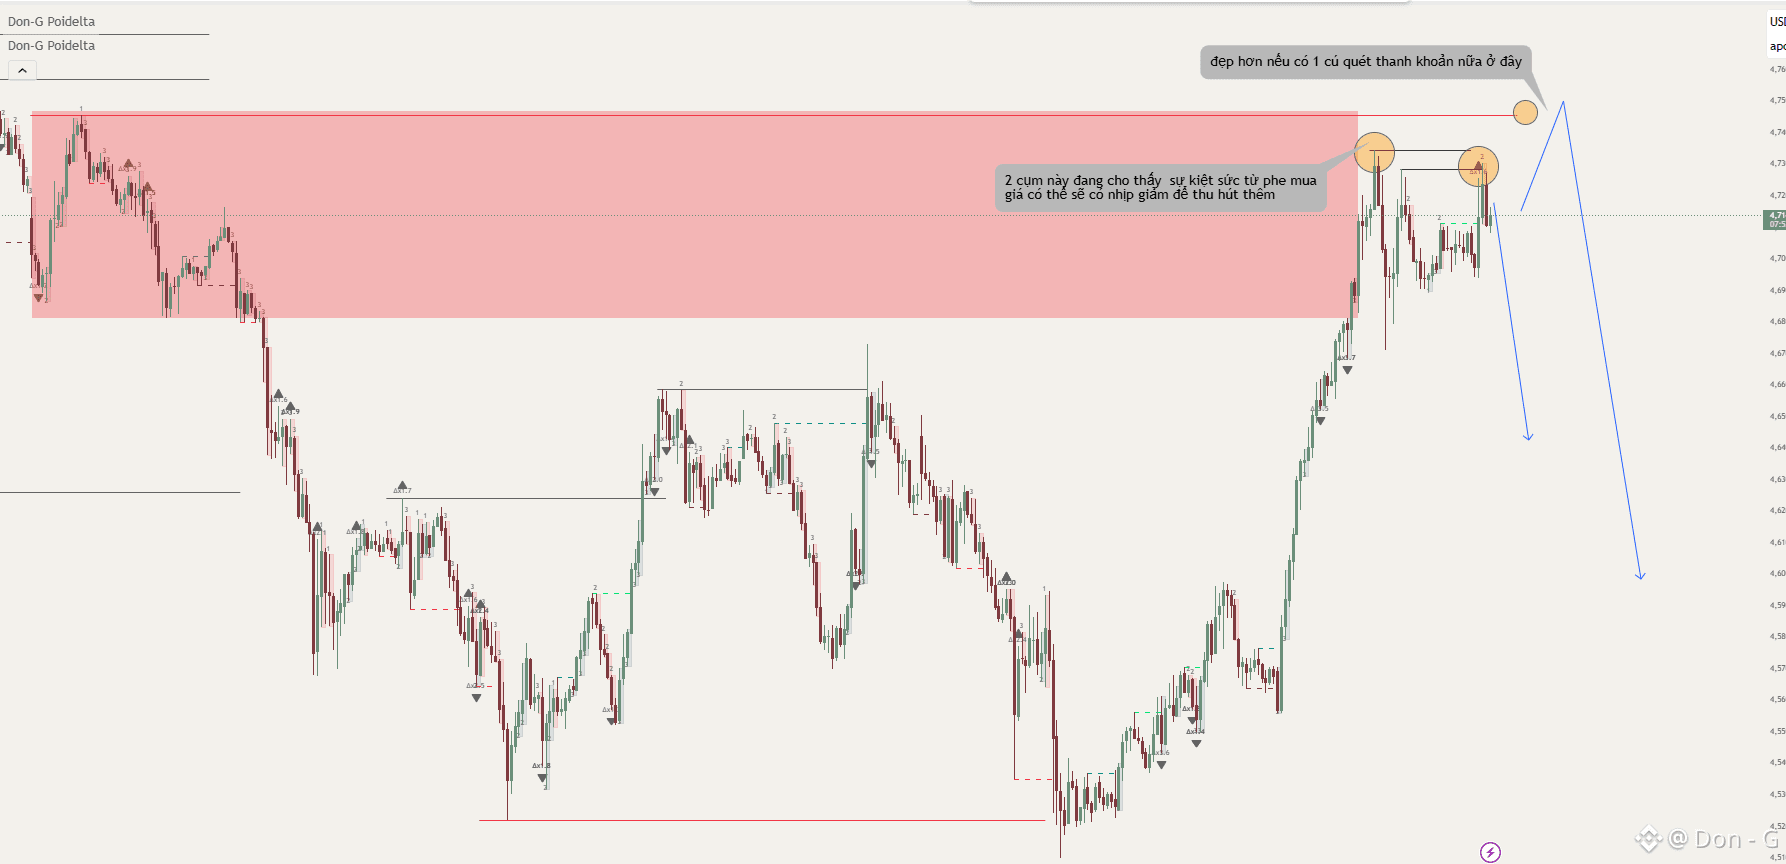
#BTC will have a monitoring range of 79-85
Most of the time, it is currently not a good time to aim for a higher target, and it is likely that the price will react at 79-85 and return to 55-60 once again.
In the case of a break through, there will be a retest back to 79-85 once again before going up further.
#CreatorpadVN #AltcoinRecoverySignals? #BitcoinPriceTrends #ARKInvestReducedPositionsinCircleandBullish
Most of the time, it is currently not a good time to aim for a higher target, and it is likely that the price will react at 79-85 and return to 55-60 once again.
In the case of a break through, there will be a retest back to 79-85 once again before going up further.
#CreatorpadVN #AltcoinRecoverySignals? #BitcoinPriceTrends #ARKInvestReducedPositionsinCircleandBullish
Many traders think that to make money, one must be really good at analysis.
One must read the market.
One must predict the direction.
One must read charts better than others.
But after enough time, one will see that most do not lose because their analysis is too poor.
They lose because they do not have a clear enough system to make decisions.
Today they enter because it looks good.
Tomorrow they enter because they are afraid of missing out.
Another day they enter because they heard someone say there’s a trade.
In the end, what drives the account is no longer strategy.
It's emotions.
The market does not reward those who think the most.
It rewards those who have a more consistent approach.
Therefore, if you are not really good at analysis yet, do not try to guess more.
Standardize your system first.
Standardize your perspective.
Standardize your entry conditions.
Standardize your method of ignoring.
Standardize your risk management.
Because analysis is just input.
The system is what creates the decision.
That is also how Don-G was built.
Not to make trading more complicated,
but to make it clearer, less noisy, and more stable.
No need to be the best analyst.
Be the one with the clearest system.
#CreatorpadVN #GoldmanSachsFilesforBitcoinIncomeETF #XAU #GoldPrice #GoldCrash #XAUUSD #GoldMarket #Bearish #CryptoNews #Trading #MarketUpdate #InvestWisely
One must read the market.
One must predict the direction.
One must read charts better than others.
But after enough time, one will see that most do not lose because their analysis is too poor.
They lose because they do not have a clear enough system to make decisions.
Today they enter because it looks good.
Tomorrow they enter because they are afraid of missing out.
Another day they enter because they heard someone say there’s a trade.
In the end, what drives the account is no longer strategy.
It's emotions.
The market does not reward those who think the most.
It rewards those who have a more consistent approach.
Therefore, if you are not really good at analysis yet, do not try to guess more.
Standardize your system first.
Standardize your perspective.
Standardize your entry conditions.
Standardize your method of ignoring.
Standardize your risk management.
Because analysis is just input.
The system is what creates the decision.
That is also how Don-G was built.
Not to make trading more complicated,
but to make it clearer, less noisy, and more stable.
No need to be the best analyst.
Be the one with the clearest system.
#CreatorpadVN #GoldmanSachsFilesforBitcoinIncomeETF #XAU #GoldPrice #GoldCrash #XAUUSD #GoldMarket #Bearish #CryptoNews #Trading #MarketUpdate #InvestWisely
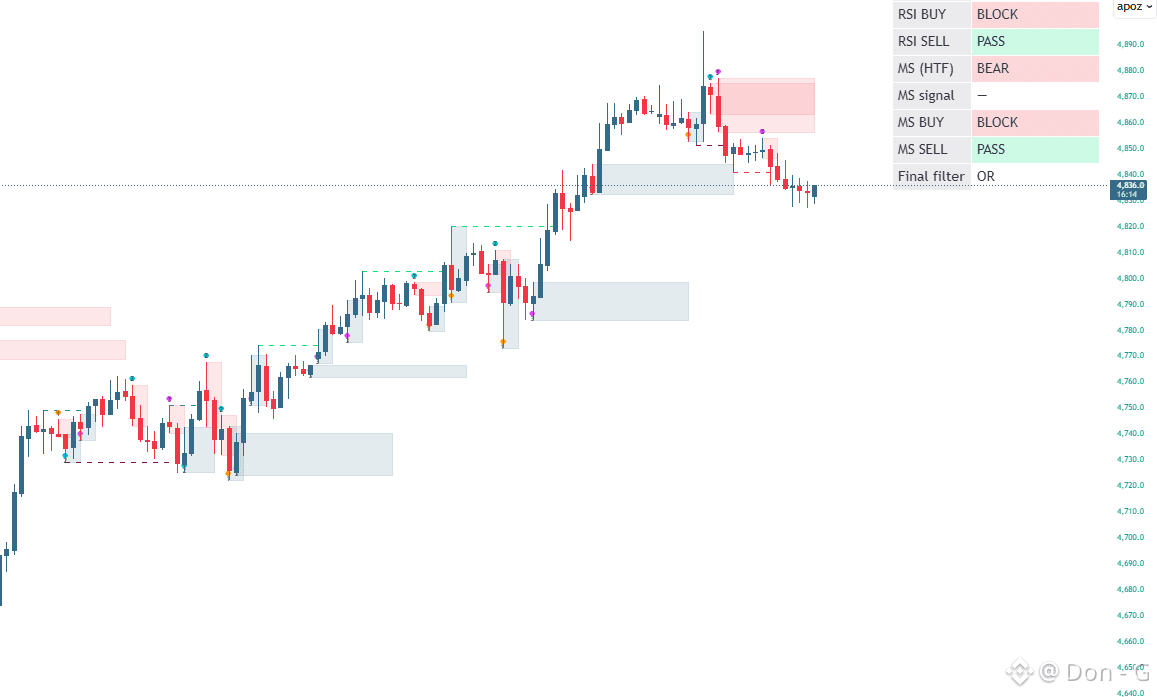
Changing the interface gives a brighter view of the chart but cannot overshadow the clarity of the planned strategy.
For myself, trading is just a directional plan; I don't execute a single order from bottom to top like this, but instead, I have many orders aligned with this bias, making trading during the week easier when there is a larger picture guiding me.
#CreatorpadVN #CZonTBPNInterview #GOLD
For myself, trading is just a directional plan; I don't execute a single order from bottom to top like this, but instead, I have many orders aligned with this bias, making trading during the week easier when there is a larger picture guiding me.
#CreatorpadVN #CZonTBPNInterview #GOLD
Don - G
·
--
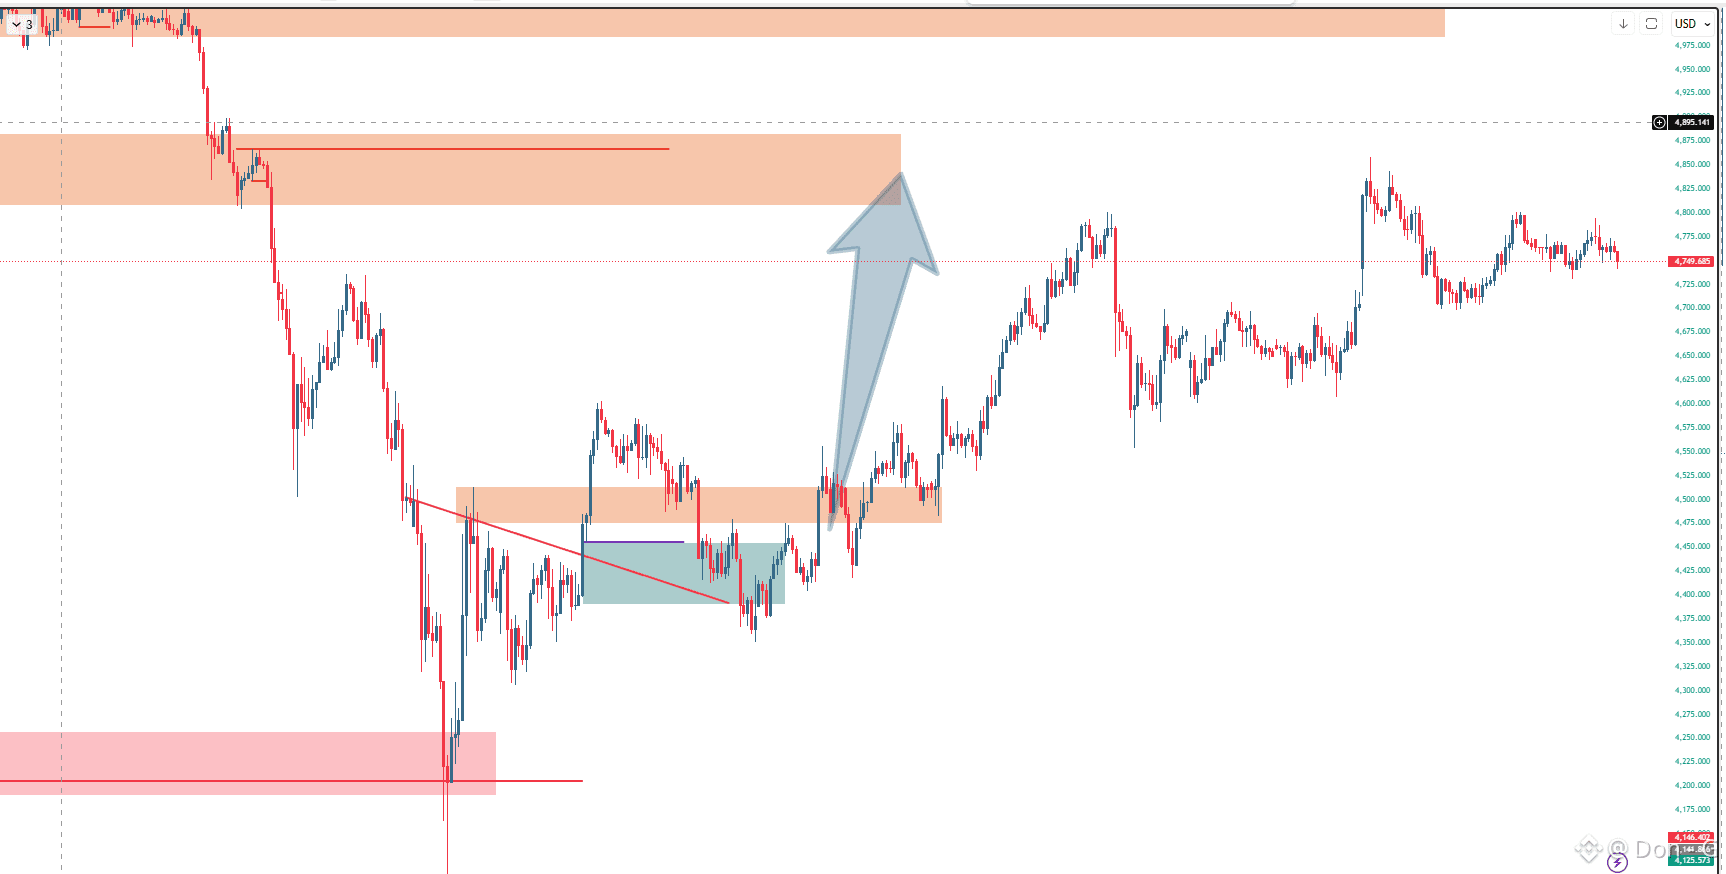
Gold #XAU is currently experiencing a rebound, but it is not yet a confirmed trend reversal.
After a sharp decline, prices have risen due to easing macroeconomic pressure, a cooling USD, and improved market sentiment. However, right now this still leans towards a technical rebound, not enough to conclude that an upward trend has returned.
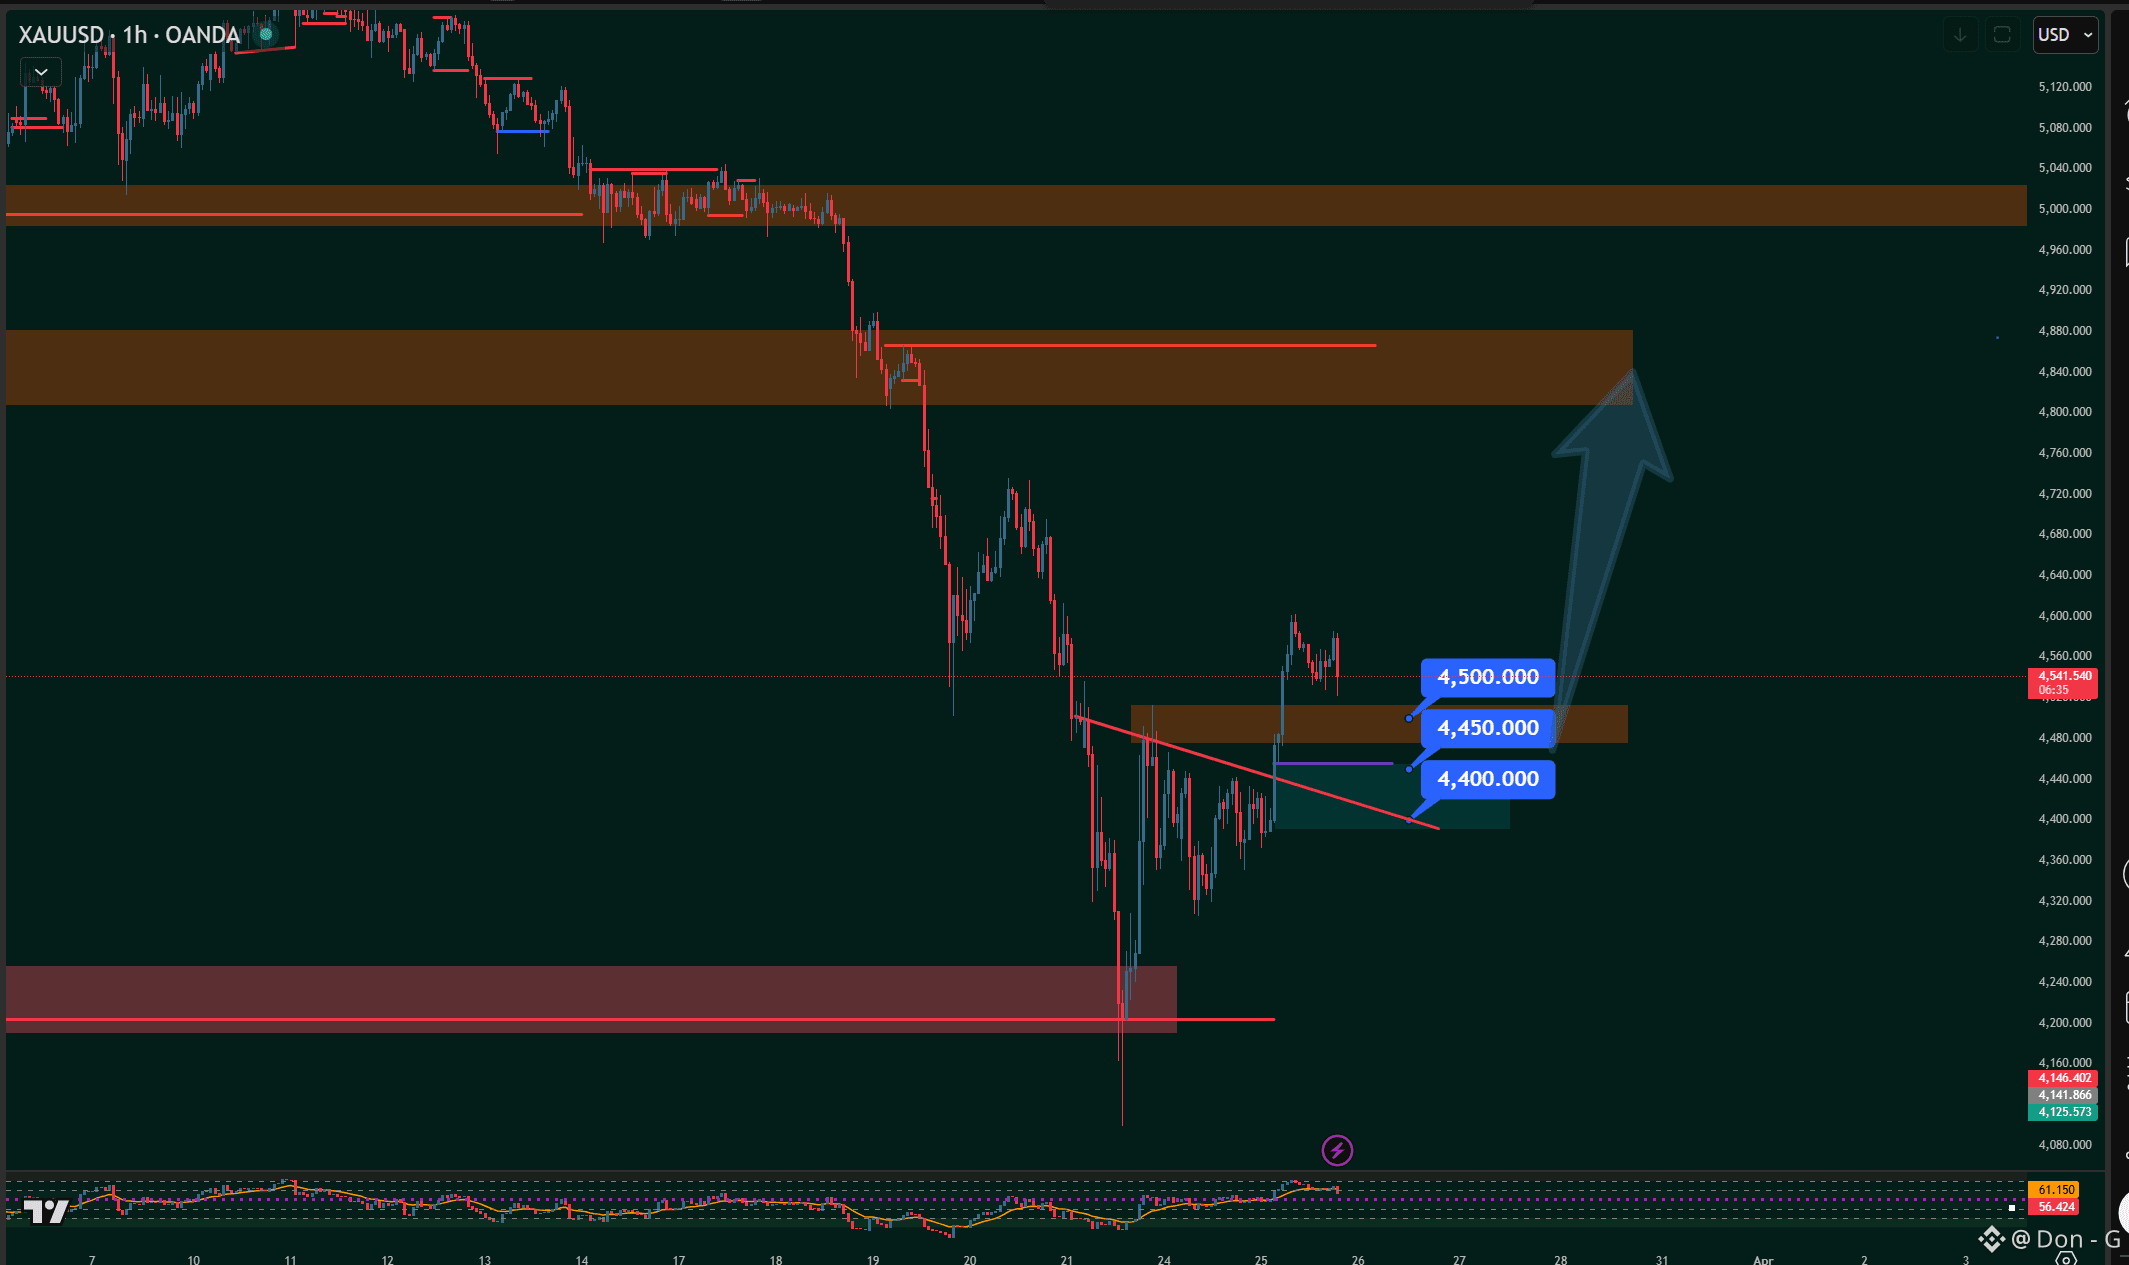
For this chart, I see 3 key levels:
4400: support zone for the rebound
4450: important reclaim zone
4500: confirmation level to expand higher
If prices can hold the cluster of 4400–4500 and turn it into a foundation, the recovery scenario will look brighter.
Conversely, if it cannot hold, this could easily just be a rebound to sell within a larger downtrend.
In short:
It's not the time for excitement yet. Prices need to prove that the 4400–4500 area is a new foundation, not just a temporary bounce.
#PAXGUSDT #TrumpSaysIranWarHasBeenWon #GOLD
After a sharp decline, prices have risen due to easing macroeconomic pressure, a cooling USD, and improved market sentiment. However, right now this still leans towards a technical rebound, not enough to conclude that an upward trend has returned.
For this chart, I see 3 key levels:
4400: support zone for the rebound
4450: important reclaim zone
4500: confirmation level to expand higher
If prices can hold the cluster of 4400–4500 and turn it into a foundation, the recovery scenario will look brighter.
Conversely, if it cannot hold, this could easily just be a rebound to sell within a larger downtrend.
In short:
It's not the time for excitement yet. Prices need to prove that the 4400–4500 area is a new foundation, not just a temporary bounce.
#PAXGUSDT #TrumpSaysIranWarHasBeenWon #GOLD
Gold #XAU is currently experiencing a rebound, but it is not yet a confirmed trend reversal.
After a sharp decline, prices have risen due to easing macroeconomic pressure, a cooling USD, and improved market sentiment. However, right now this still leans towards a technical rebound, not enough to conclude that an upward trend has returned.
For this chart, I see 3 key levels:
4400: support zone for the rebound
4450: important reclaim zone
4500: confirmation level to expand higher
If prices can hold the cluster of 4400–4500 and turn it into a foundation, the recovery scenario will look brighter.
Conversely, if it cannot hold, this could easily just be a rebound to sell within a larger downtrend.
In short:
It's not the time for excitement yet. Prices need to prove that the 4400–4500 area is a new foundation, not just a temporary bounce.
#PAXGUSDT #TrumpSaysIranWarHasBeenWon #GOLD
After a sharp decline, prices have risen due to easing macroeconomic pressure, a cooling USD, and improved market sentiment. However, right now this still leans towards a technical rebound, not enough to conclude that an upward trend has returned.
For this chart, I see 3 key levels:
4400: support zone for the rebound
4450: important reclaim zone
4500: confirmation level to expand higher
If prices can hold the cluster of 4400–4500 and turn it into a foundation, the recovery scenario will look brighter.
Conversely, if it cannot hold, this could easily just be a rebound to sell within a larger downtrend.
In short:
It's not the time for excitement yet. Prices need to prove that the 4400–4500 area is a new foundation, not just a temporary bounce.
#PAXGUSDT #TrumpSaysIranWarHasBeenWon #GOLD
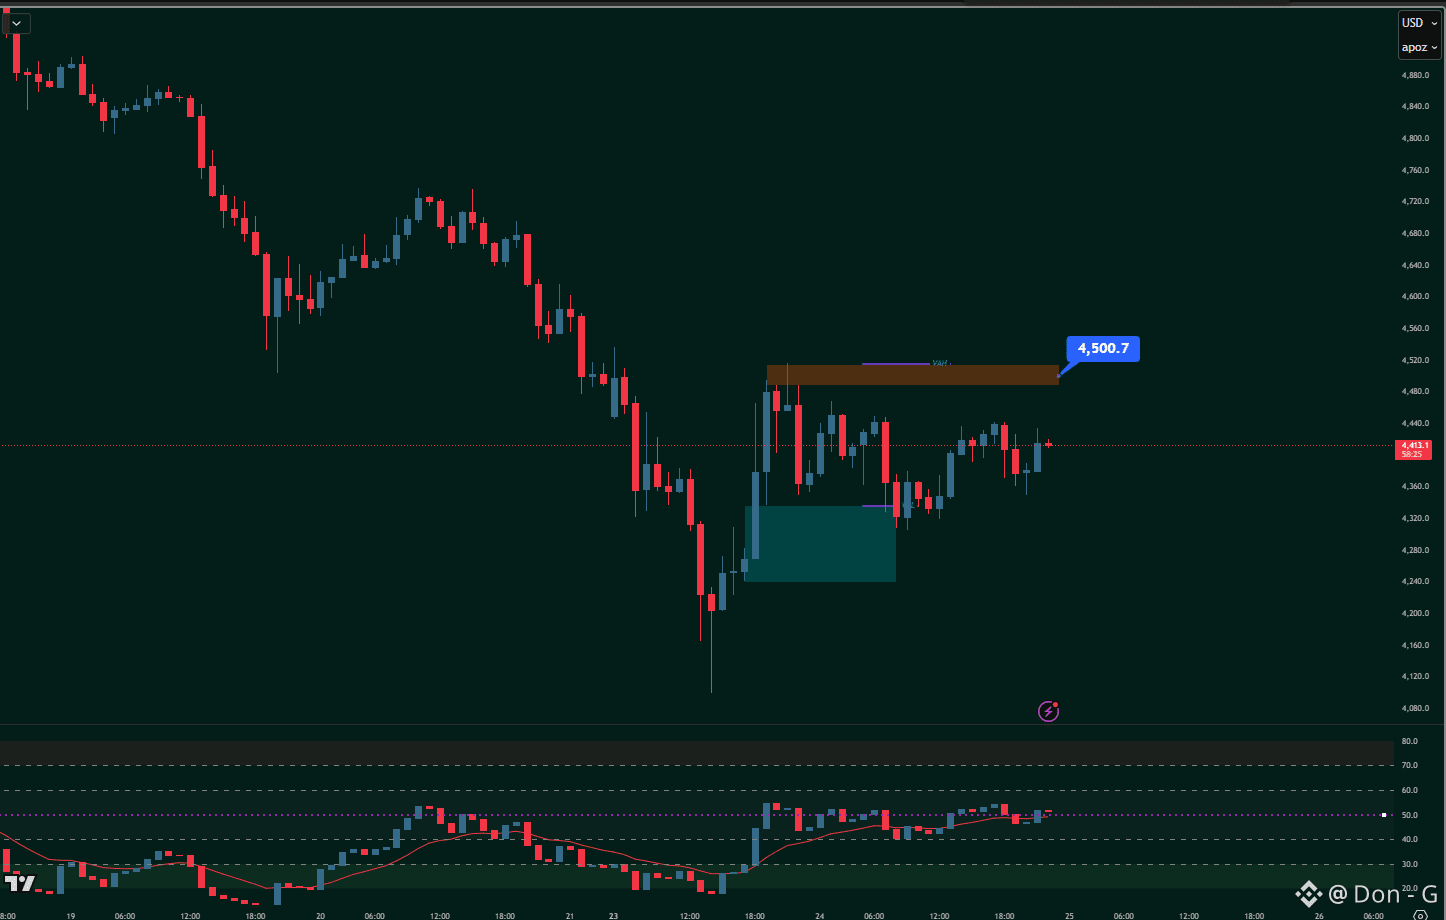
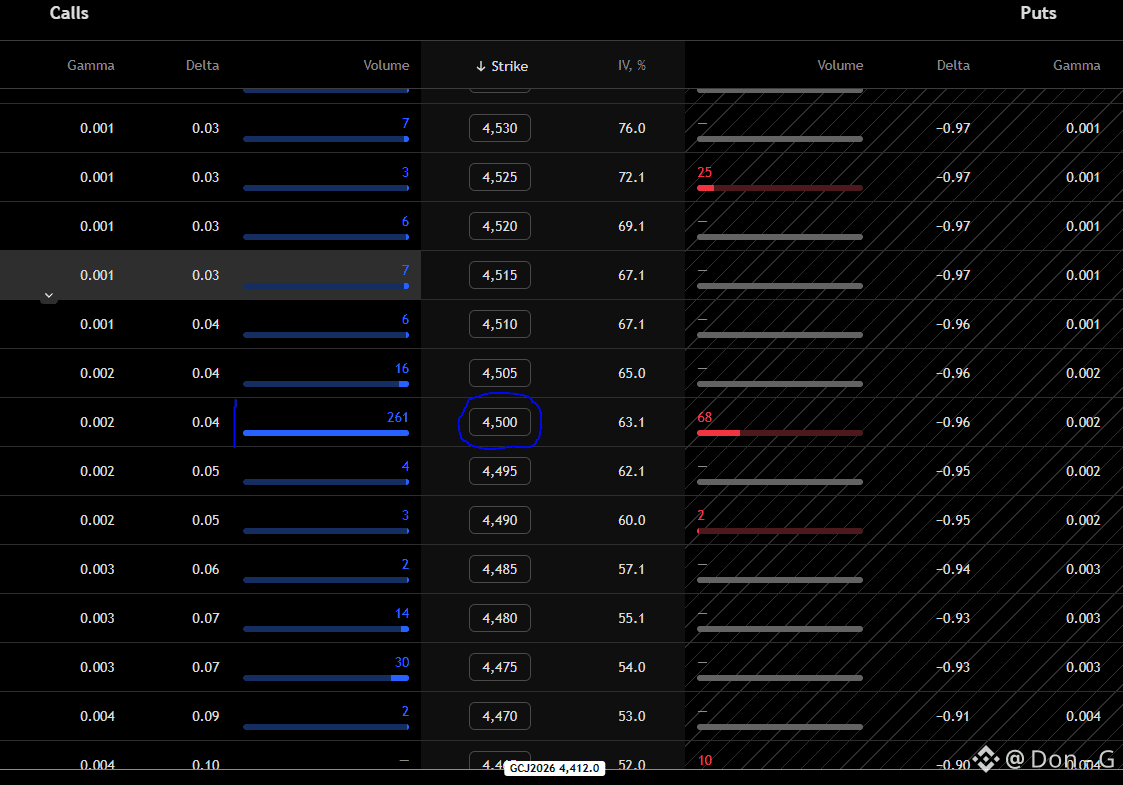
#XAU Gold has returned to the exact place I identified since last night and now the next reaction target is the 4500 mark
This is also an important reaction mark because it is a region with a large strike volume guiding the next step for gold
#PAXGUSDT #GOLD #GoldManSachs
This is also an important reaction mark because it is a region with a large strike volume guiding the next step for gold
#PAXGUSDT #GOLD #GoldManSachs
Don - G
·
--
Since February 2024, gold has only returned to touch the low level of the previous month once, which was in November 2024.
And currently, the market is repeating that once again.
It sounds scary.
But in a strong uptrend, such pullbacks are sometimes not a sign of weakness…
but rather a sign that the market is still moving with great strength.
The 4,300 mark is currently the lowest point of 2026.
If we look back at the history of bullish gold phases, retests of important low areas like this tend not to break the trend immediately, but are often where very noteworthy buying opportunities are created.
The important thing is not whether the market is declining or not.
The important thing is: in what context is it declining.
If this is still a true bull market, then those dips to the annual lows are often when pessimistic emotions peak… and also when opportunities begin to appear.
Thus, 4,300 is not just a number. It could be the zone that the market forces the majority to doubt, before continuing to prove that the larger trend is not yet over.
#XAU #PAXGUSDT #GOLD
And currently, the market is repeating that once again.
It sounds scary.
But in a strong uptrend, such pullbacks are sometimes not a sign of weakness…
but rather a sign that the market is still moving with great strength.
The 4,300 mark is currently the lowest point of 2026.
If we look back at the history of bullish gold phases, retests of important low areas like this tend not to break the trend immediately, but are often where very noteworthy buying opportunities are created.
The important thing is not whether the market is declining or not.
The important thing is: in what context is it declining.
If this is still a true bull market, then those dips to the annual lows are often when pessimistic emotions peak… and also when opportunities begin to appear.
Thus, 4,300 is not just a number. It could be the zone that the market forces the majority to doubt, before continuing to prove that the larger trend is not yet over.
#XAU #PAXGUSDT #GOLD
Since February 2024, gold has only returned to touch the low level of the previous month once, which was in November 2024.
And currently, the market is repeating that once again.
It sounds scary.
But in a strong uptrend, such pullbacks are sometimes not a sign of weakness…
but rather a sign that the market is still moving with great strength.
The 4,300 mark is currently the lowest point of 2026.
If we look back at the history of bullish gold phases, retests of important low areas like this tend not to break the trend immediately, but are often where very noteworthy buying opportunities are created.
The important thing is not whether the market is declining or not.
The important thing is: in what context is it declining.
If this is still a true bull market, then those dips to the annual lows are often when pessimistic emotions peak… and also when opportunities begin to appear.
Thus, 4,300 is not just a number. It could be the zone that the market forces the majority to doubt, before continuing to prove that the larger trend is not yet over.
#XAU #PAXGUSDT #GOLD
And currently, the market is repeating that once again.
It sounds scary.
But in a strong uptrend, such pullbacks are sometimes not a sign of weakness…
but rather a sign that the market is still moving with great strength.
The 4,300 mark is currently the lowest point of 2026.
If we look back at the history of bullish gold phases, retests of important low areas like this tend not to break the trend immediately, but are often where very noteworthy buying opportunities are created.
The important thing is not whether the market is declining or not.
The important thing is: in what context is it declining.
If this is still a true bull market, then those dips to the annual lows are often when pessimistic emotions peak… and also when opportunities begin to appear.
Thus, 4,300 is not just a number. It could be the zone that the market forces the majority to doubt, before continuing to prove that the larger trend is not yet over.
#XAU #PAXGUSDT #GOLD
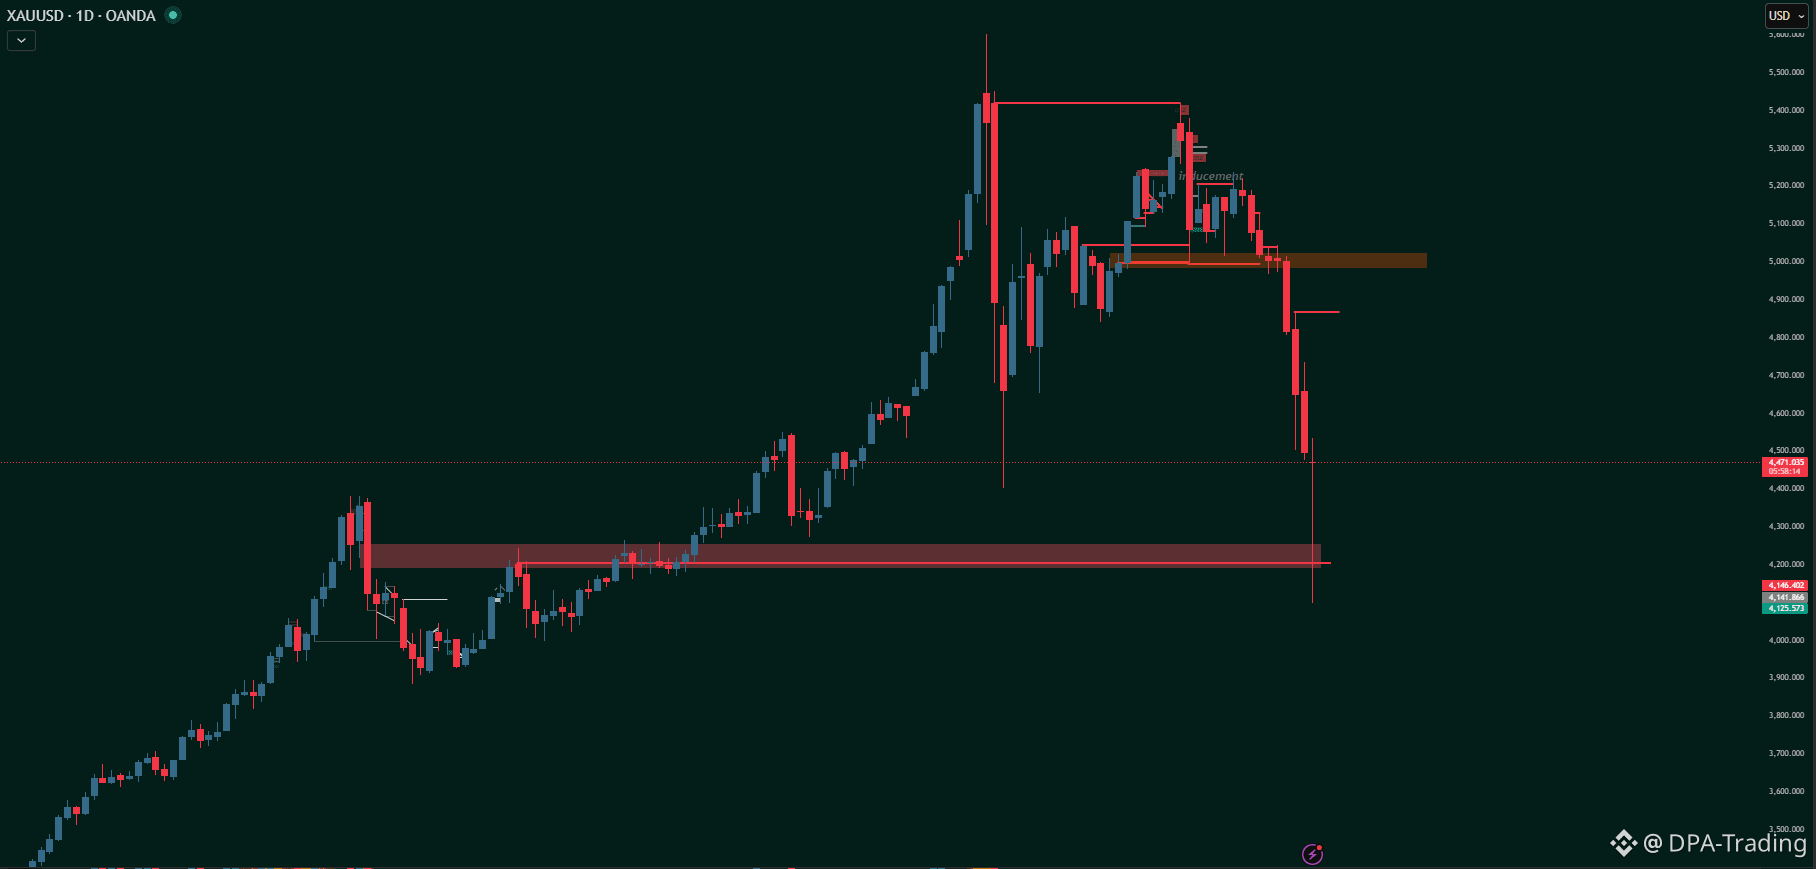
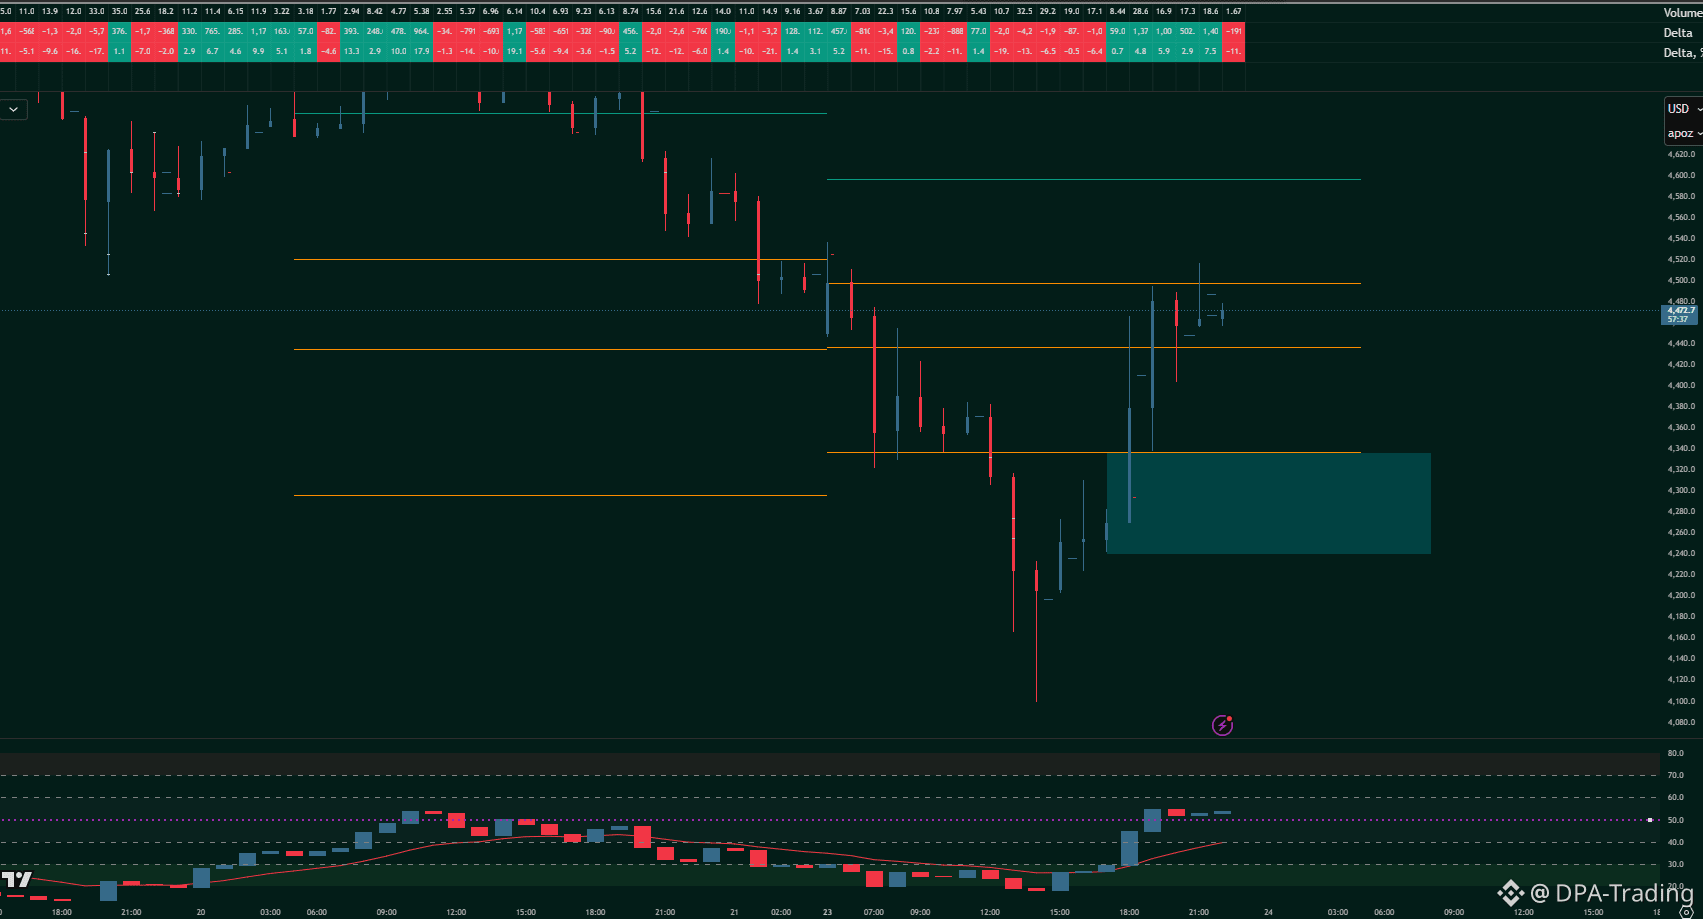
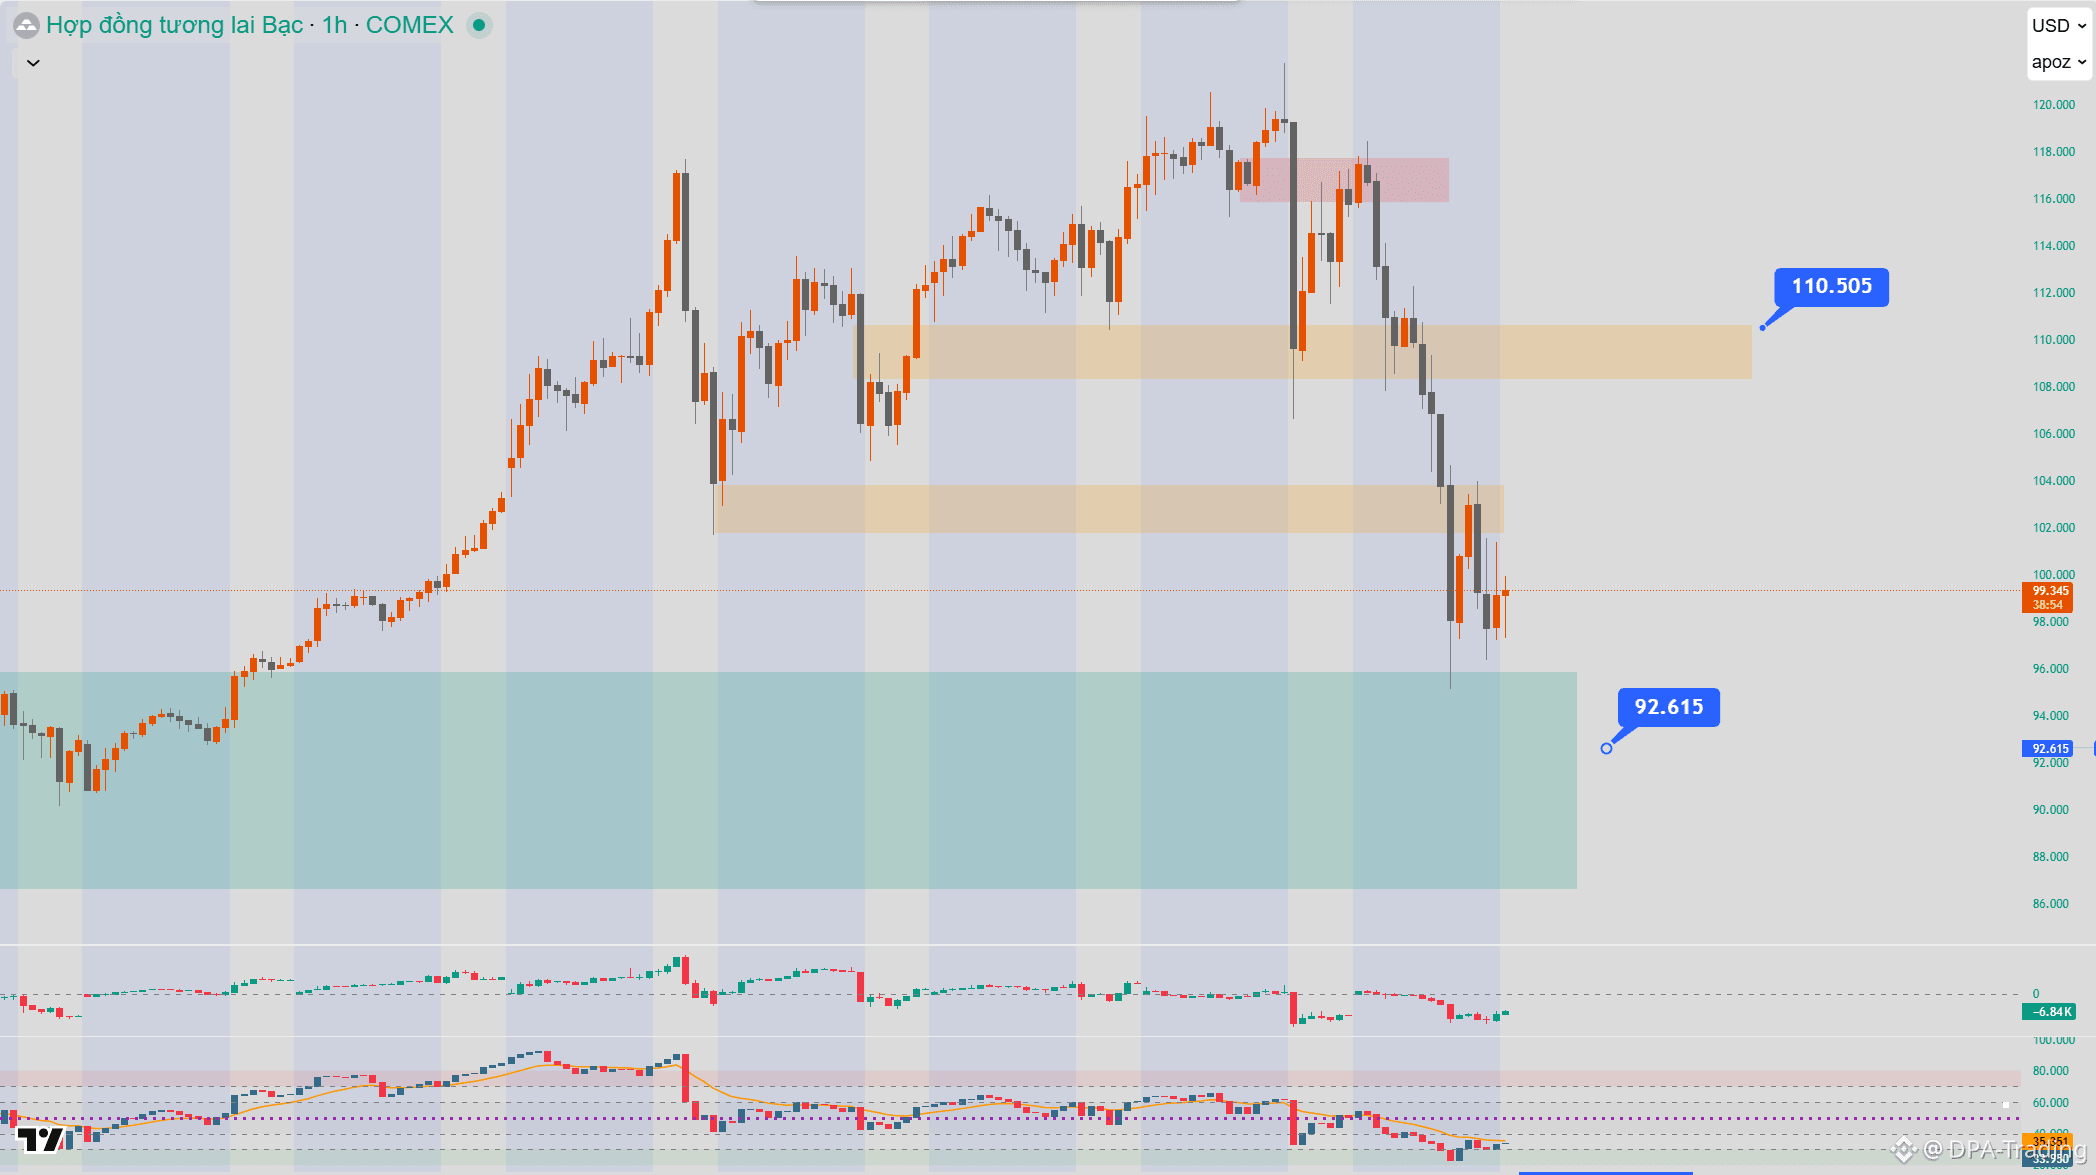
Silver continues to decrease in price after the Shanghai trading market closed, and the price difference between the Eastern and Western markets is 36$ . So the question is whether the market is being manipulated.
Another point is whether this price reduction behavior is just a pretense and next week the price will return to a new peak, as historically silver prices tend to drop at the end of the month.
#USPPIJump #MarketCorrection #Silver
Another point is whether this price reduction behavior is just a pretense and next week the price will return to a new peak, as historically silver prices tend to drop at the end of the month.
#USPPIJump #MarketCorrection #Silver
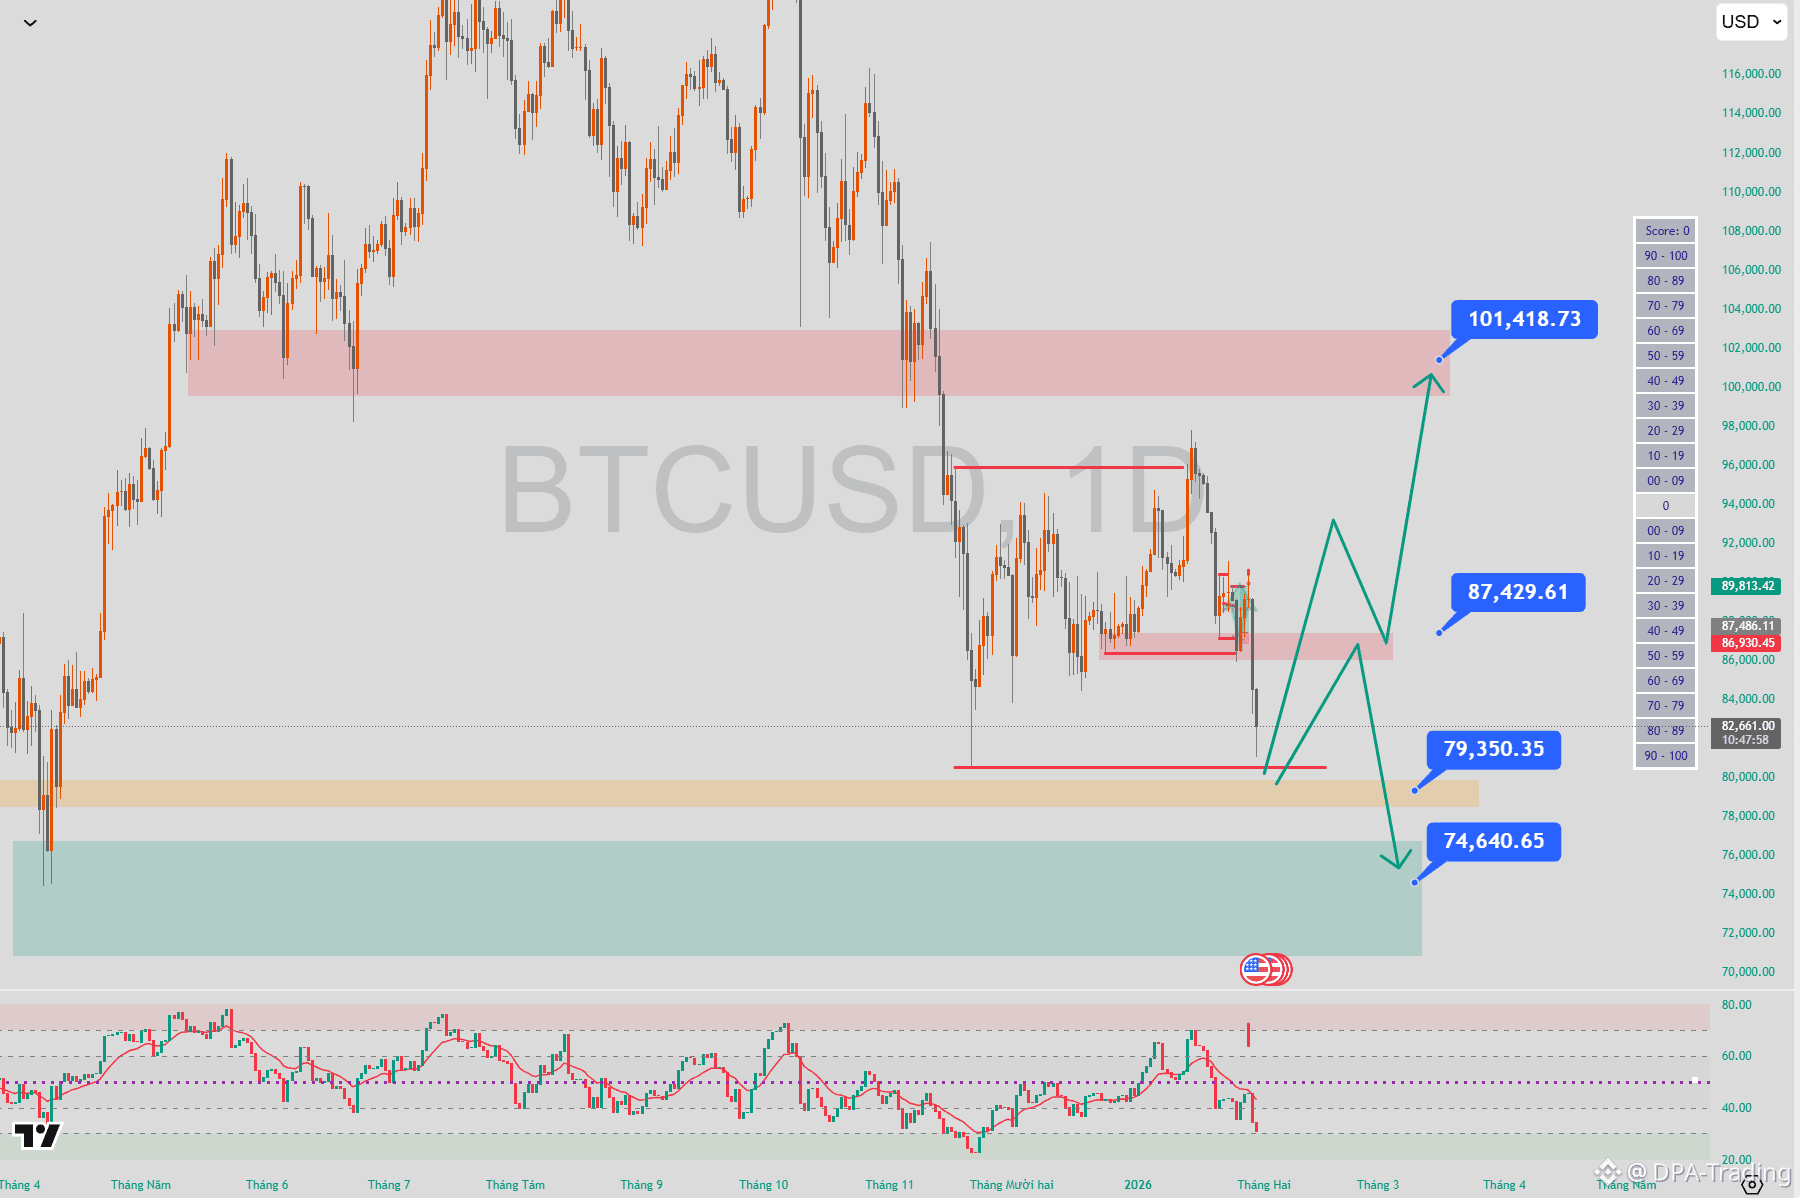
The cryptocurrency market has shifted to a risk-averse trend — and large leverage has paid the price 📉
Total market capitalization has dropped to around $2.78 trillion (-7%), due to the risk appetite and leveraged buying positions being quickly liquidated. This is not a slow distribution process but rather a rapid capital withdrawal.
#BTC led the decline, sliding down to $82,000, losing important support levels. #ETH followed down below $2,800, while large-cap altcoins (SOL, XRP, BNB) recorded weekly declines high from one to two digits. Sentiment reversed quickly — Fear and greed are deeply submerged in fear, the Altcoin Season Index is back near a low of 30
💥 Liquidations told the real story:
More than $1.69 billion has been wiped out in 24 hours.
– BTC Approximately $783 million
– ETH: ~ $416 million
Over 269,000 traders were forced to exit the system — a typical example of resetting leverage.
📊 Pay attention to the next important zone: $80K – $78K. Hold steady → a slight bounce may occur. Loss of price → risk of deeper correction to 72k-74k. The bullish zone up to 87K and 100k is still possible; however, further consideration is needed as currently, everything does not support - confirmation is required.
Oversold conditions do not equate to a bottom. Price volatility will remain high until confidence is restored.
#BTC #MarketCorrection #WhoIsNextFedChair
Total market capitalization has dropped to around $2.78 trillion (-7%), due to the risk appetite and leveraged buying positions being quickly liquidated. This is not a slow distribution process but rather a rapid capital withdrawal.
#BTC led the decline, sliding down to $82,000, losing important support levels. #ETH followed down below $2,800, while large-cap altcoins (SOL, XRP, BNB) recorded weekly declines high from one to two digits. Sentiment reversed quickly — Fear and greed are deeply submerged in fear, the Altcoin Season Index is back near a low of 30
💥 Liquidations told the real story:
More than $1.69 billion has been wiped out in 24 hours.
– BTC Approximately $783 million
– ETH: ~ $416 million
Over 269,000 traders were forced to exit the system — a typical example of resetting leverage.
📊 Pay attention to the next important zone: $80K – $78K. Hold steady → a slight bounce may occur. Loss of price → risk of deeper correction to 72k-74k. The bullish zone up to 87K and 100k is still possible; however, further consideration is needed as currently, everything does not support - confirmation is required.
Oversold conditions do not equate to a bottom. Price volatility will remain high until confidence is restored.
#BTC #MarketCorrection #WhoIsNextFedChair
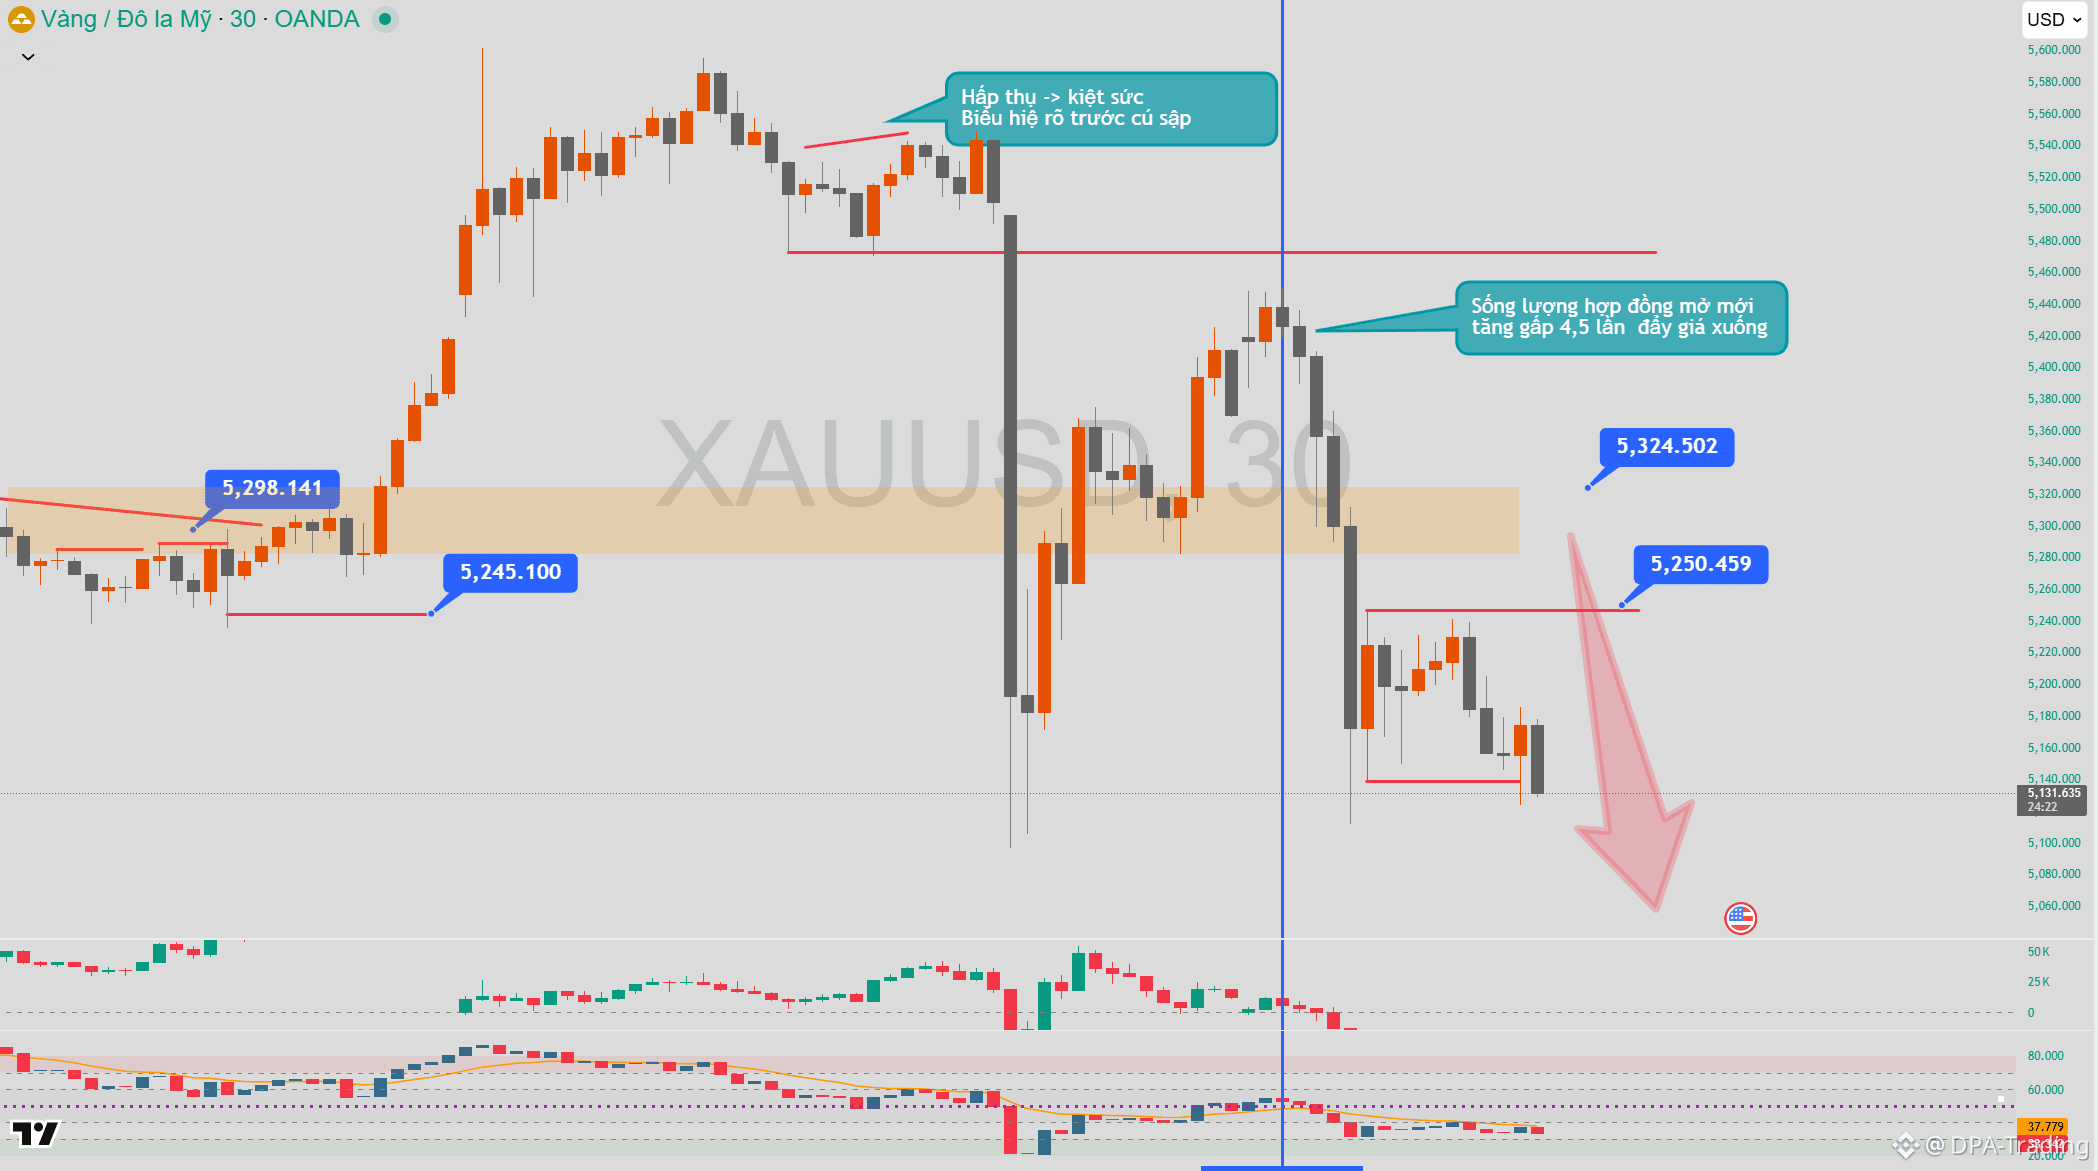
Recognizing the current global gold price, the price may go down to 5000
There is no denying that gold is experiencing a significant corrective decline after the crash last night, with clear signs that the Long side no longer has the strength to show at the peak of absorption and exhaustion.
CME data shows that the number of new open contracts and those being held is currently 4.5 times higher than before, indicating that Shorts have entered the market and pushed the price down for the second time after a recovery from 5100 to 5430 (liquidity recovery).
At present, the price is fluctuating within the range of 5100 - 5250, with a resistance area at 5300. Combined with the increasing number of open contracts for short positions, one might expect a liquidity sweep at 5250 - 5325 before dropping deeper to 5000.
#MarketCorrection #GoldOnTheRise #XAUUSD
There is no denying that gold is experiencing a significant corrective decline after the crash last night, with clear signs that the Long side no longer has the strength to show at the peak of absorption and exhaustion.
CME data shows that the number of new open contracts and those being held is currently 4.5 times higher than before, indicating that Shorts have entered the market and pushed the price down for the second time after a recovery from 5100 to 5430 (liquidity recovery).
At present, the price is fluctuating within the range of 5100 - 5250, with a resistance area at 5300. Combined with the increasing number of open contracts for short positions, one might expect a liquidity sweep at 5250 - 5325 before dropping deeper to 5000.
#MarketCorrection #GoldOnTheRise #XAUUSD
CRYPTO TRANSACTIONS - CASH FLOW IS NOT ENOUGH
If you only read based on cash flow data, you might not understand the reason why the price dropped in this case.
But if you apply additional knowledge about Technical Analysis - Liquidity and Shark's footprint, you will immediately understand the reason and know what to do.
Yesterday, after sweeping the liquidity zone of 90k, the price immediately reacted and created a divergence. If you check the CVD, you can clearly see a clear exhaustion showing that the Long side has exhausted its strength.
#USIranStandoff #ChinaDrama #BTC
If you only read based on cash flow data, you might not understand the reason why the price dropped in this case.
But if you apply additional knowledge about Technical Analysis - Liquidity and Shark's footprint, you will immediately understand the reason and know what to do.
Yesterday, after sweeping the liquidity zone of 90k, the price immediately reacted and created a divergence. If you check the CVD, you can clearly see a clear exhaustion showing that the Long side has exhausted its strength.
#USIranStandoff #ChinaDrama #BTC
Don - G
·
--
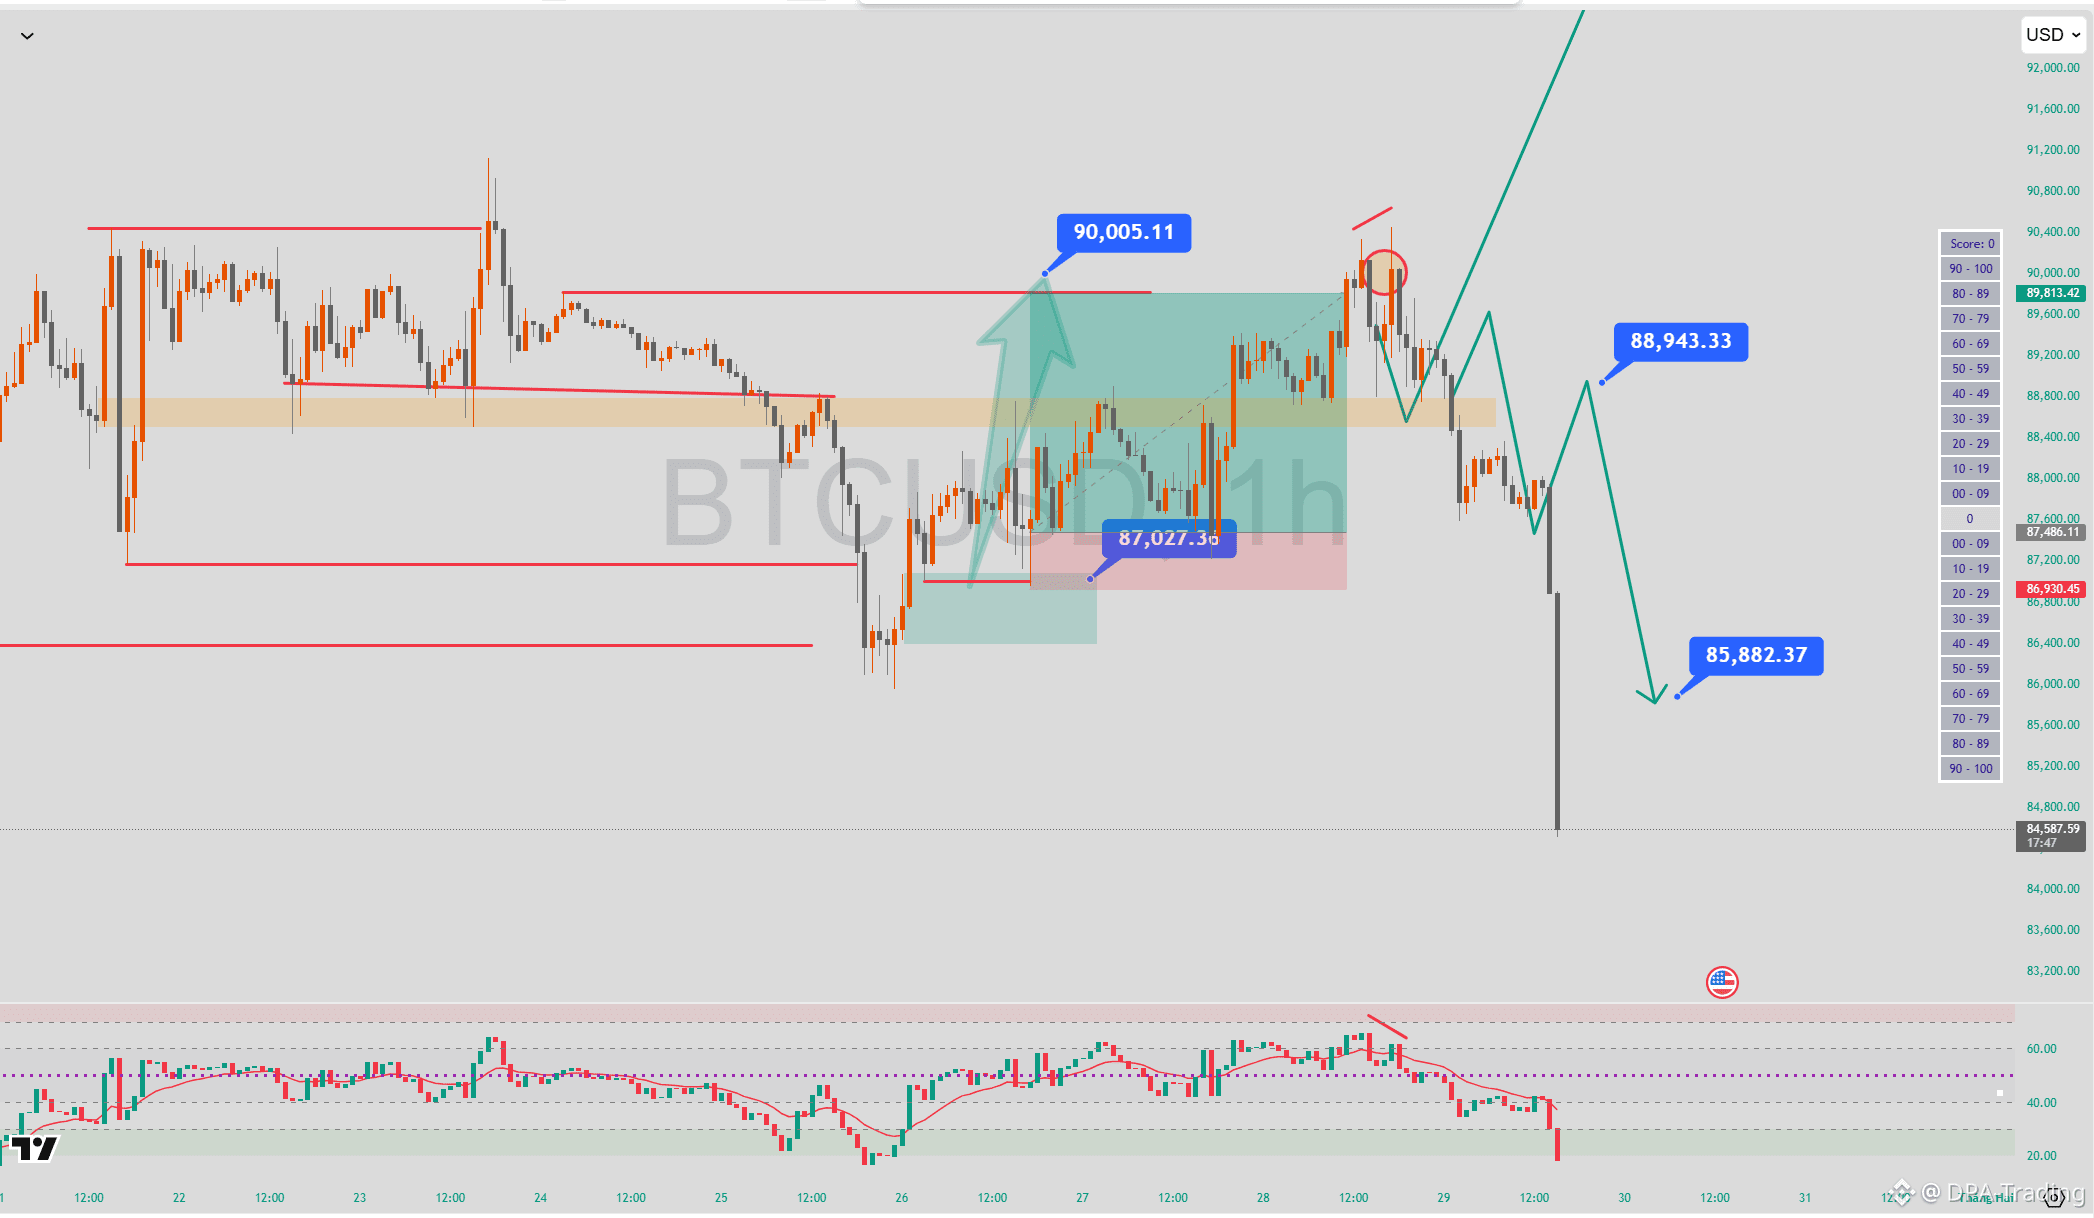
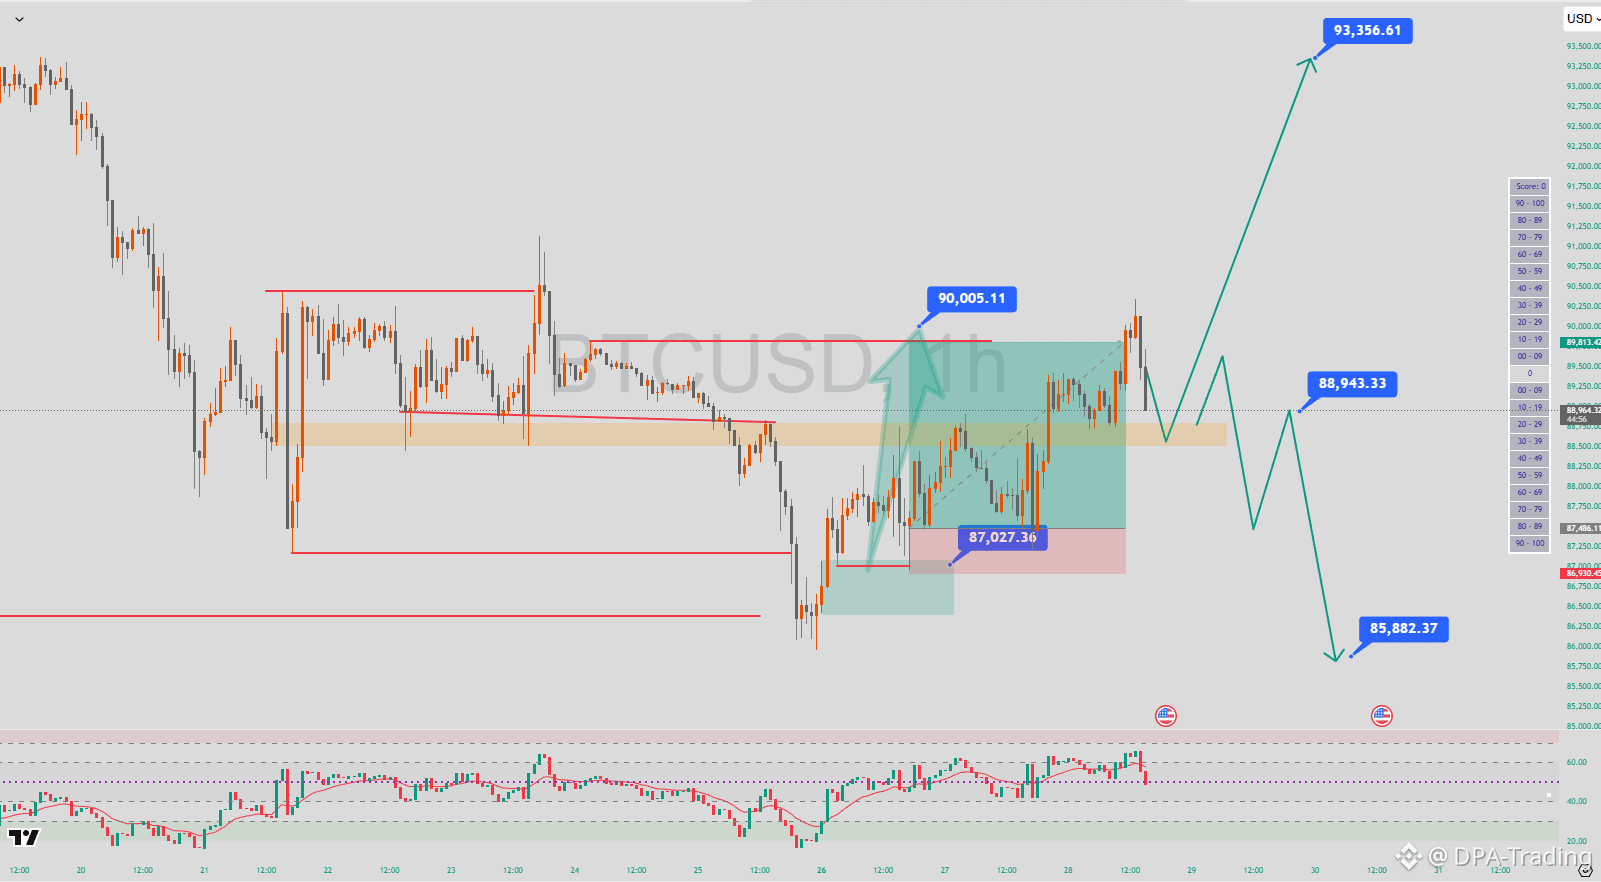
Thus, the price has been following the plan since the beginning of the week. Currently, the price is reacting quite strongly after hitting my take profit (TP).
The reason I chose that TP is because it is where many retail investors entered, so right after the price swept the liquidity, it turned around.
Right now, I am leaning towards the scenario that the price will decrease back to 85K, but we need to wait for further confirmation.
Regarding the structure, the price is still respecting the downtrend at the higher time frame (HTF) and has not yet shifted to an uptrend.
#FedWatch #BTC
The reason I chose that TP is because it is where many retail investors entered, so right after the price swept the liquidity, it turned around.
Right now, I am leaning towards the scenario that the price will decrease back to 85K, but we need to wait for further confirmation.
Regarding the structure, the price is still respecting the downtrend at the higher time frame (HTF) and has not yet shifted to an uptrend.
#FedWatch #BTC
Thus, the price has been following the plan since the beginning of the week. Currently, the price is reacting quite strongly after hitting my take profit (TP).
The reason I chose that TP is because it is where many retail investors entered, so right after the price swept the liquidity, it turned around.
Right now, I am leaning towards the scenario that the price will decrease back to 85K, but we need to wait for further confirmation.
Regarding the structure, the price is still respecting the downtrend at the higher time frame (HTF) and has not yet shifted to an uptrend.
#FedWatch #BTC
The reason I chose that TP is because it is where many retail investors entered, so right after the price swept the liquidity, it turned around.
Right now, I am leaning towards the scenario that the price will decrease back to 85K, but we need to wait for further confirmation.
Regarding the structure, the price is still respecting the downtrend at the higher time frame (HTF) and has not yet shifted to an uptrend.
#FedWatch #BTC
Quoted content has been removed
Log in to explore more content