
btc航天顶护
5 Posts

btc航天顶护
Report
Block User
专注链上数据挖掘 & 高频交易策略 | 用代码寻找 Alpha | 每日分享一个交易信号”。
67 Following
82 Followers
16 Liked
Posts
·
--
Bullish
1. Spot Premium Returns
This is the most direct signal for "smart money" to enter the market.
CVD (Cumulative Volume Delta) Divergence:
In the past 48 hours, despite futures prices (Perpetuals) continuously testing lower lows, the **Spot CVD** on Coinbase and Binance has been rising strongly. This means that the current selling pressure primarily comes from short-selling derivative traders, while institutions are quietly "catching the falling knife" through the spot market.
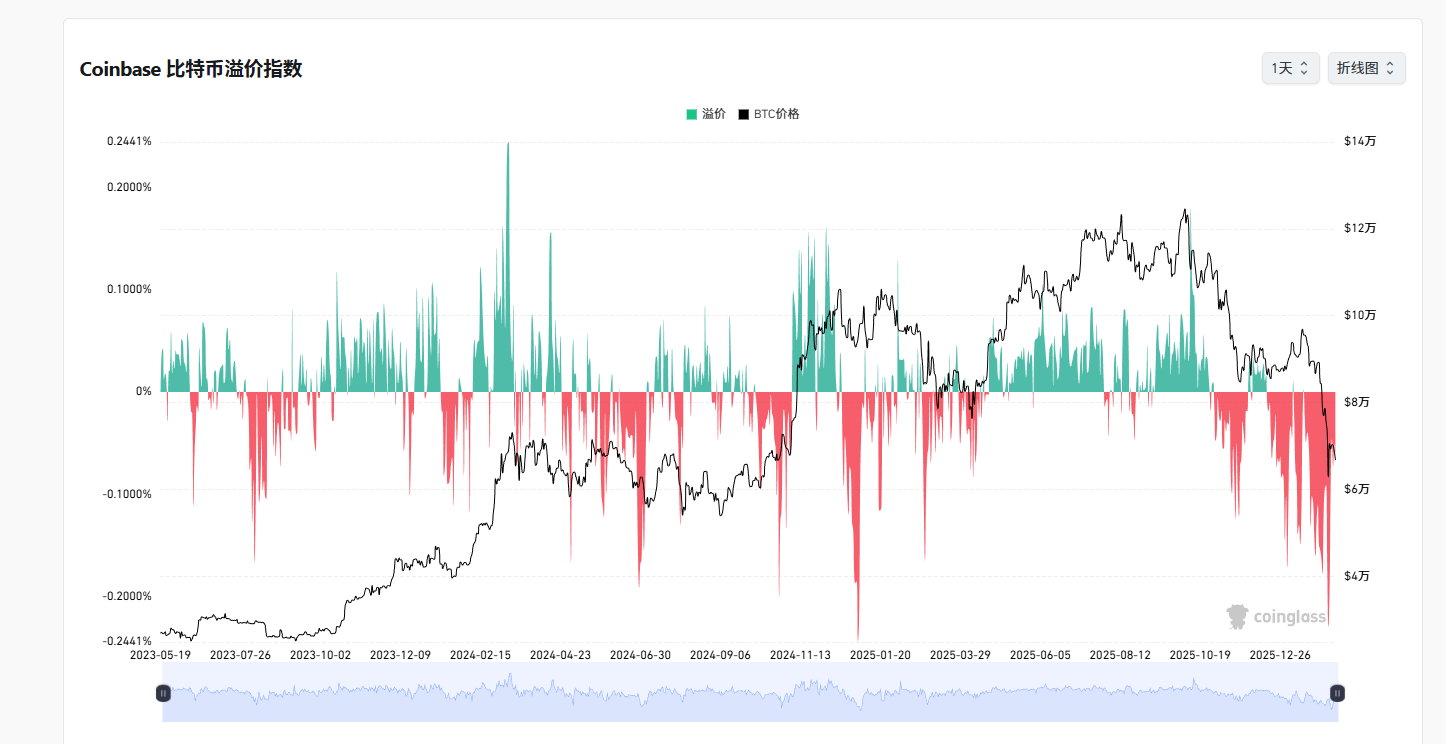
Coinbase Premium Index Turns Positive:
The BTC price on Coinbase Pro has once again shown a positive premium relative to Binance. This is a typical characteristic of U.S. institutional funds net buying during work hours (especially during U.S. stock market opening hours).
2. Miner Capitulation Ended
Miner Selling Pressure Exhausted:
On-chain data shows that the outflow from Miner Wallets has sharply dropped to a nearly six-month low after peaking at the end of January over the past three days.
Hash Ribbons Signal:
If this is a deep pullback, miners usually continue to sell to pay for electricity. However, despite the current high difficulty in hash power, miners have stopped selling, indicating that this price range (around $70k) is the "break-even life line" that miners are unwilling to fall below, and due to the cost effect after the halving, there is strong cost support here.
3. Technical Pattern: Bullish Falling Wedge
Daily Structure:
BTC is forming a standard **"descending wedge"** on the daily chart. This is usually a bullish continuation pattern. The current volatility has been compressed to the extreme, and the Bollinger Bands are extremely narrowed, which is usually a precursor to a major price change.
RSI Bottom Divergence:
Both the 4-hour and daily RSI indicators have shown "bottom divergence" (price makes new lows, but RSI lows are rising), indicating that the downward pressure from bears is rapidly diminishing.
4. Macro Liquidity
Stablecoin Issuance:
In the past 3 days, the market capitalization of USDT and USDC has increased by about $1.2 billion, with a large portion of this capital flowing into centralized exchanges. This is a typical "loading" behavior, indicating that off-market funds have been converted into ammunition, just waiting for a trigger point to enter the market and buy the dip.
It is recommended to place buy orders at 62500 and continuously increase positions on dips!!!
{future}(BTCUSDT)
{spot}(BTCUSDT)
1. Spot Premium Returns
This is the most direct signal for "smart money" to enter the market.
CVD (Cumulative Volume Delta) Divergence:
In the past 48 hours, despite futures prices (Perpetuals) continuously testing lower lows, the **Spot CVD** on Coinbase and Binance has been rising strongly. This means that the current selling pressure primarily comes from short-selling derivative traders, while institutions are quietly "catching the falling knife" through the spot market.
Coinbase Premium Index Turns Positive:
The BTC price on Coinbase Pro has once again shown a positive premium relative to Binance. This is a typical characteristic of U.S. institutional funds net buying during work hours (especially during U.S. stock market opening hours).
2. Miner Capitulation Ended
Miner Selling Pressure Exhausted:
On-chain data shows that the outflow from Miner Wallets has sharply dropped to a nearly six-month low after peaking at the end of January over the past three days.
Hash Ribbons Signal:
If this is a deep pullback, miners usually continue to sell to pay for electricity. However, despite the current high difficulty in hash power, miners have stopped selling, indicating that this price range (around $70k) is the "break-even life line" that miners are unwilling to fall below, and due to the cost effect after the halving, there is strong cost support here.
3. Technical Pattern: Bullish Falling Wedge
Daily Structure:
BTC is forming a standard **"descending wedge"** on the daily chart. This is usually a bullish continuation pattern. The current volatility has been compressed to the extreme, and the Bollinger Bands are extremely narrowed, which is usually a precursor to a major price change.
RSI Bottom Divergence:
Both the 4-hour and daily RSI indicators have shown "bottom divergence" (price makes new lows, but RSI lows are rising), indicating that the downward pressure from bears is rapidly diminishing.
4. Macro Liquidity
Stablecoin Issuance:
In the past 3 days, the market capitalization of USDT and USDC has increased by about $1.2 billion, with a large portion of this capital flowing into centralized exchanges. This is a typical "loading" behavior, indicating that off-market funds have been converted into ammunition, just waiting for a trigger point to enter the market and buy the dip.
It is recommended to place buy orders at 62500 and continuously increase positions on dips!!!
This is the most direct signal for "smart money" to enter the market.
CVD (Cumulative Volume Delta) Divergence:
In the past 48 hours, despite futures prices (Perpetuals) continuously testing lower lows, the **Spot CVD** on Coinbase and Binance has been rising strongly. This means that the current selling pressure primarily comes from short-selling derivative traders, while institutions are quietly "catching the falling knife" through the spot market.
Coinbase Premium Index Turns Positive:
The BTC price on Coinbase Pro has once again shown a positive premium relative to Binance. This is a typical characteristic of U.S. institutional funds net buying during work hours (especially during U.S. stock market opening hours).
2. Miner Capitulation Ended
Miner Selling Pressure Exhausted:
On-chain data shows that the outflow from Miner Wallets has sharply dropped to a nearly six-month low after peaking at the end of January over the past three days.
Hash Ribbons Signal:
If this is a deep pullback, miners usually continue to sell to pay for electricity. However, despite the current high difficulty in hash power, miners have stopped selling, indicating that this price range (around $70k) is the "break-even life line" that miners are unwilling to fall below, and due to the cost effect after the halving, there is strong cost support here.
3. Technical Pattern: Bullish Falling Wedge
Daily Structure:
BTC is forming a standard **"descending wedge"** on the daily chart. This is usually a bullish continuation pattern. The current volatility has been compressed to the extreme, and the Bollinger Bands are extremely narrowed, which is usually a precursor to a major price change.
RSI Bottom Divergence:
Both the 4-hour and daily RSI indicators have shown "bottom divergence" (price makes new lows, but RSI lows are rising), indicating that the downward pressure from bears is rapidly diminishing.
4. Macro Liquidity
Stablecoin Issuance:
In the past 3 days, the market capitalization of USDT and USDC has increased by about $1.2 billion, with a large portion of this capital flowing into centralized exchanges. This is a typical "loading" behavior, indicating that off-market funds have been converted into ammunition, just waiting for a trigger point to enter the market and buy the dip.
It is recommended to place buy orders at 62500 and continuously increase positions on dips!!!
174
·
--
Bullish
1. On-Chain Divergence
This is currently the strongest rebound logic: prices are falling, but large funds are buying.
Whales are accumulating on a large scale:
According to the latest on-chain tracking data, whale addresses holding 10,000 - 100,000 ETH increased their holdings by over 520,000 ETH during the decline from February 4 to February 8. This is the first time since the beginning of the year that institutional/whale buying has significantly outweighed retail panic selling.
Supply Shock:
In the past week, the net outflow of ETH from centralized exchanges (CEX) has exceeded 220,000, marking the largest outflow wave since October last year. Funds are being transferred from exchanges to cold wallets and staking contracts, which is often a precursor to the exhaustion of selling pressure and tightening supply.
2. Fundamental Disconnect
The price of ETH does not reflect the surge in its network activity, and such a mismatch typically does not last long.
Active addresses hit an all-time high:
The number of monthly active addresses on the Ethereum network has surpassed 15.19 million, reaching an all-time high (ATH). The sharp rise in network usage contrasts starkly with the sluggish price, indicating that the current price is severely undervalued and market sentiment is overly pessimistic.
Staking volume continues to rise:
Despite the price drop, the staking queue for ETH has not decreased, and the total staking amount continues to climb. This means a large number of tokens are locked up for the long term, and the actual circulating supply is much smaller than what is shown on the market.
3. Technical Setup
$1,7
{future}(ETHUSDT)
{spot}(ETHUSDT)
00 Iron Bottom Defense:
$1,700 is not only a psychological barrier but also a core support level for Fibonacci retracement and a historically dense transaction area. Currently, ETH is constructing a **"Higher Low"** structure (weekly level), and the daily RSI indicator has begun to rise from the oversold area, indicating that bearish momentum is weakening.
Funding rates neutralization:
The funding rates in the futures market have returned to neutral from previous negative values (shorting crowd). This means that excessive short leverage has been cleared, reducing market resistance, and once buying pressure enters, it can easily trigger short covering (Short Squeeze).
Key levels and strategy recommendations
Key support: $1,700 - $1,800
1. On-Chain Divergence
This is currently the strongest rebound logic: prices are falling, but large funds are buying.
Whales are accumulating on a large scale:
According to the latest on-chain tracking data, whale addresses holding 10,000 - 100,000 ETH increased their holdings by over 520,000 ETH during the decline from February 4 to February 8. This is the first time since the beginning of the year that institutional/whale buying has significantly outweighed retail panic selling.
Supply Shock:
In the past week, the net outflow of ETH from centralized exchanges (CEX) has exceeded 220,000, marking the largest outflow wave since October last year. Funds are being transferred from exchanges to cold wallets and staking contracts, which is often a precursor to the exhaustion of selling pressure and tightening supply.
2. Fundamental Disconnect
The price of ETH does not reflect the surge in its network activity, and such a mismatch typically does not last long.
Active addresses hit an all-time high:
The number of monthly active addresses on the Ethereum network has surpassed 15.19 million, reaching an all-time high (ATH). The sharp rise in network usage contrasts starkly with the sluggish price, indicating that the current price is severely undervalued and market sentiment is overly pessimistic.
Staking volume continues to rise:
Despite the price drop, the staking queue for ETH has not decreased, and the total staking amount continues to climb. This means a large number of tokens are locked up for the long term, and the actual circulating supply is much smaller than what is shown on the market.
3. Technical Setup
$1,7
00 Iron Bottom Defense:
$1,700 is not only a psychological barrier but also a core support level for Fibonacci retracement and a historically dense transaction area. Currently, ETH is constructing a **"Higher Low"** structure (weekly level), and the daily RSI indicator has begun to rise from the oversold area, indicating that bearish momentum is weakening.
Funding rates neutralization:
The funding rates in the futures market have returned to neutral from previous negative values (shorting crowd). This means that excessive short leverage has been cleared, reducing market resistance, and once buying pressure enters, it can easily trigger short covering (Short Squeeze).
Key levels and strategy recommendations
Key support: $1,700 - $1,800
This is currently the strongest rebound logic: prices are falling, but large funds are buying.
Whales are accumulating on a large scale:
According to the latest on-chain tracking data, whale addresses holding 10,000 - 100,000 ETH increased their holdings by over 520,000 ETH during the decline from February 4 to February 8. This is the first time since the beginning of the year that institutional/whale buying has significantly outweighed retail panic selling.
Supply Shock:
In the past week, the net outflow of ETH from centralized exchanges (CEX) has exceeded 220,000, marking the largest outflow wave since October last year. Funds are being transferred from exchanges to cold wallets and staking contracts, which is often a precursor to the exhaustion of selling pressure and tightening supply.
2. Fundamental Disconnect
The price of ETH does not reflect the surge in its network activity, and such a mismatch typically does not last long.
Active addresses hit an all-time high:
The number of monthly active addresses on the Ethereum network has surpassed 15.19 million, reaching an all-time high (ATH). The sharp rise in network usage contrasts starkly with the sluggish price, indicating that the current price is severely undervalued and market sentiment is overly pessimistic.
Staking volume continues to rise:
Despite the price drop, the staking queue for ETH has not decreased, and the total staking amount continues to climb. This means a large number of tokens are locked up for the long term, and the actual circulating supply is much smaller than what is shown on the market.
3. Technical Setup
$1,7
00 Iron Bottom Defense:
$1,700 is not only a psychological barrier but also a core support level for Fibonacci retracement and a historically dense transaction area. Currently, ETH is constructing a **"Higher Low"** structure (weekly level), and the daily RSI indicator has begun to rise from the oversold area, indicating that bearish momentum is weakening.
Funding rates neutralization:
The funding rates in the futures market have returned to neutral from previous negative values (shorting crowd). This means that excessive short leverage has been cleared, reducing market resistance, and once buying pressure enters, it can easily trigger short covering (Short Squeeze).
Key levels and strategy recommendations
Key support: $1,700 - $1,800
201
·
--
Spot Trading Techniques 22. Timing: Buy when no one cares, sell when there is a lot of noise.
1. Build positions on the left side, add positions on the right side.
Left side: Set psychological price levels and place orders in batches. Don't dream of buying at the lowest point; that's the realm of gods. Have the courage to take bloody chips in the deep pit created by panic selling.
Right side: Only enter the remaining bullets when the trend confirms a reversal (for example, breaking through the neckline or key moving averages). This is called 'confirmation cost.'
2. All indicators are auxiliary; only the trend is king.
Don't be superstitious about MACD golden crosses and death crosses; those are lagging indicators.
Look at the big picture and make small trades: First, check the weekly chart to determine the direction, then look at the daily chart to find positions, and finally check the 4-hour chart for entry points.
Spot Trading Techniques 2
2. Timing: Buy when no one cares, sell when there is a lot of noise.
1. Build positions on the left side, add positions on the right side.
Left side: Set psychological price levels and place orders in batches. Don't dream of buying at the lowest point; that's the realm of gods. Have the courage to take bloody chips in the deep pit created by panic selling.
Right side: Only enter the remaining bullets when the trend confirms a reversal (for example, breaking through the neckline or key moving averages). This is called 'confirmation cost.'
2. All indicators are auxiliary; only the trend is king.
Don't be superstitious about MACD golden crosses and death crosses; those are lagging indicators.
Look at the big picture and make small trades: First, check the weekly chart to determine the direction, then look at the daily chart to find positions, and finally check the 4-hour chart for entry points.
1. Build positions on the left side, add positions on the right side.
Left side: Set psychological price levels and place orders in batches. Don't dream of buying at the lowest point; that's the realm of gods. Have the courage to take bloody chips in the deep pit created by panic selling.
Right side: Only enter the remaining bullets when the trend confirms a reversal (for example, breaking through the neckline or key moving averages). This is called 'confirmation cost.'
2. All indicators are auxiliary; only the trend is king.
Don't be superstitious about MACD golden crosses and death crosses; those are lagging indicators.
Look at the big picture and make small trades: First, check the weekly chart to determine the direction, then look at the daily chart to find positions, and finally check the 4-hour chart for entry points.
98
·
--
Bullish
1. Selection: Finding Alpha with Asymmetric Returns
The essence of selection is to find targets with high risk-reward ratios. Don't try to catch every needle in the market; we only need to grab those few 'pigs on the wind'
1. Narrative is King
In a market flooded with liquidity, fundamentals often lag behind prices. The first question you should ask is not 'How much money does this project make?' but rather **'Is this story sexy enough? Can it create a consensus among hundreds of millions of people?'**
Track rules: Funds always flow towards the path of least resistance. AI, RWA, GameFi... focus on sectors attracting hot money.
Leading effect: Always buy the leader (Dragon One). When Dragon One rises, it rises the fastest; when it falls, it falls the least. Even if Dragon Two is cheap, don’t touch it, because that’s the 'mediocre trap'.
2. Only volume doesn’t lie
Candlestick patterns can be drawn, news can be fabricated, but the trading volume piled up with real money cannot be faked.
Volume and price rise together: A breakout after a bottom consolidation is a rallying call for the main forces to enter.
Turnover rate secrets: Focus on targets with high turnover rates that do not drop in price; this indicates someone is aggressively accumulating, a calm before the storm.
3. The Game of Market Cap and Space
Large funds seek stability: Choose the top 20 mainstream coins, benefiting from industry Beta (average returns), with the goal of outperforming inflation and traditional finance.
Small funds seek change: Select potential stocks with market caps between $50 million and $200 million. This range avoids the zero-risk of 'shitcoins' while providing the imagination of tenfold or hundredfold returns.
FDV trap: Don’t just look at circulating market cap; consider FDV (Fully Diluted Valuation). If a coin has a very low circulating market cap but an absurdly high FDV, and faces massive unlocks, blacklist it.
1. Selection: Finding Alpha with Asymmetric Returns
The essence of selection is to find targets with high risk-reward ratios. Don't try to catch every needle in the market; we only need to grab those few 'pigs on the wind'
1. Narrative is King
In a market flooded with liquidity, fundamentals often lag behind prices. The first question you should ask is not 'How much money does this project make?' but rather **'Is this story sexy enough? Can it create a consensus among hundreds of millions of people?'**
Track rules: Funds always flow towards the path of least resistance. AI, RWA, GameFi... focus on sectors attracting hot money.
Leading effect: Always buy the leader (Dragon One). When Dragon One rises, it rises the fastest; when it falls, it falls the least. Even if Dragon Two is cheap, don’t touch it, because that’s the 'mediocre trap'.
2. Only volume doesn’t lie
Candlestick patterns can be drawn, news can be fabricated, but the trading volume piled up with real money cannot be faked.
Volume and price rise together: A breakout after a bottom consolidation is a rallying call for the main forces to enter.
Turnover rate secrets: Focus on targets with high turnover rates that do not drop in price; this indicates someone is aggressively accumulating, a calm before the storm.
3. The Game of Market Cap and Space
Large funds seek stability: Choose the top 20 mainstream coins, benefiting from industry Beta (average returns), with the goal of outperforming inflation and traditional finance.
Small funds seek change: Select potential stocks with market caps between $50 million and $200 million. This range avoids the zero-risk of 'shitcoins' while providing the imagination of tenfold or hundredfold returns.
FDV trap: Don’t just look at circulating market cap; consider FDV (Fully Diluted Valuation). If a coin has a very low circulating market cap but an absurdly high FDV, and faces massive unlocks, blacklist it.
The essence of selection is to find targets with high risk-reward ratios. Don't try to catch every needle in the market; we only need to grab those few 'pigs on the wind'
1. Narrative is King
In a market flooded with liquidity, fundamentals often lag behind prices. The first question you should ask is not 'How much money does this project make?' but rather **'Is this story sexy enough? Can it create a consensus among hundreds of millions of people?'**
Track rules: Funds always flow towards the path of least resistance. AI, RWA, GameFi... focus on sectors attracting hot money.
Leading effect: Always buy the leader (Dragon One). When Dragon One rises, it rises the fastest; when it falls, it falls the least. Even if Dragon Two is cheap, don’t touch it, because that’s the 'mediocre trap'.
2. Only volume doesn’t lie
Candlestick patterns can be drawn, news can be fabricated, but the trading volume piled up with real money cannot be faked.
Volume and price rise together: A breakout after a bottom consolidation is a rallying call for the main forces to enter.
Turnover rate secrets: Focus on targets with high turnover rates that do not drop in price; this indicates someone is aggressively accumulating, a calm before the storm.
3. The Game of Market Cap and Space
Large funds seek stability: Choose the top 20 mainstream coins, benefiting from industry Beta (average returns), with the goal of outperforming inflation and traditional finance.
Small funds seek change: Select potential stocks with market caps between $50 million and $200 million. This range avoids the zero-risk of 'shitcoins' while providing the imagination of tenfold or hundredfold returns.
FDV trap: Don’t just look at circulating market cap; consider FDV (Fully Diluted Valuation). If a coin has a very low circulating market cap but an absurdly high FDV, and faces massive unlocks, blacklist it.
51
Log in to explore more content
Join global crypto users on Binance Square
⚡️ Get latest and useful information about crypto.
💬 Trusted by the world’s largest crypto exchange.
👍 Discover real insights from verified creators.
Email / Phone number
Trending Topics
NvidiaEarningsTonight:AIStocks’NextMove?
24,811 views
416 Discussing
Nvidia Earnings Day: Interim CEO's First Appearance — Can the AI Story Hold?
Binance News
·16 Likes
·7.4k views
A Packed Week of Earnings and Data Tests Markets
107,170 views
554 Discussing
AnthropicIPOTestsInvestorAppetiteForAI
223,673 views
2,225 Discussing