

bikho baryakh
259 Posts

bikho baryakh
Report
Block User
Open Trade
High-Frequency Trader
1.3 Years
98 Following
143 Followers
105 Liked
Posts
Portfolio
$BTC
{spot}(BTCUSDT)
Details of the trade levels shown on the chart:
Buy zone (BUY): at a price of $77,446.01.
Stop loss (SL): at a price of $77,341.04.
First profit target (TP1): at a price of $78,204.75.
Second profit target (TP2): at a price of $78,257.24.
Current market assessment: The market sentiment indicator (score) shows a "bullish" bias, with an estimated confidence level of 73%
$BTC
Details of the trade levels shown on the chart:
Buy zone (BUY): at a price of $77,446.01.
Stop loss (SL): at a price of $77,341.04.
First profit target (TP1): at a price of $78,204.75.
Second profit target (TP2): at a price of $78,257.24.
Current market assessment: The market sentiment indicator (score) shows a "bullish" bias, with an estimated confidence level of 73%
Details of the trade levels shown on the chart:
Buy zone (BUY): at a price of $77,446.01.
Stop loss (SL): at a price of $77,341.04.
First profit target (TP1): at a price of $78,204.75.
Second profit target (TP2): at a price of $78,257.24.
Current market assessment: The market sentiment indicator (score) shows a "bullish" bias, with an estimated confidence level of 73%
80
$SOL
{spot}(SOLUSDT)
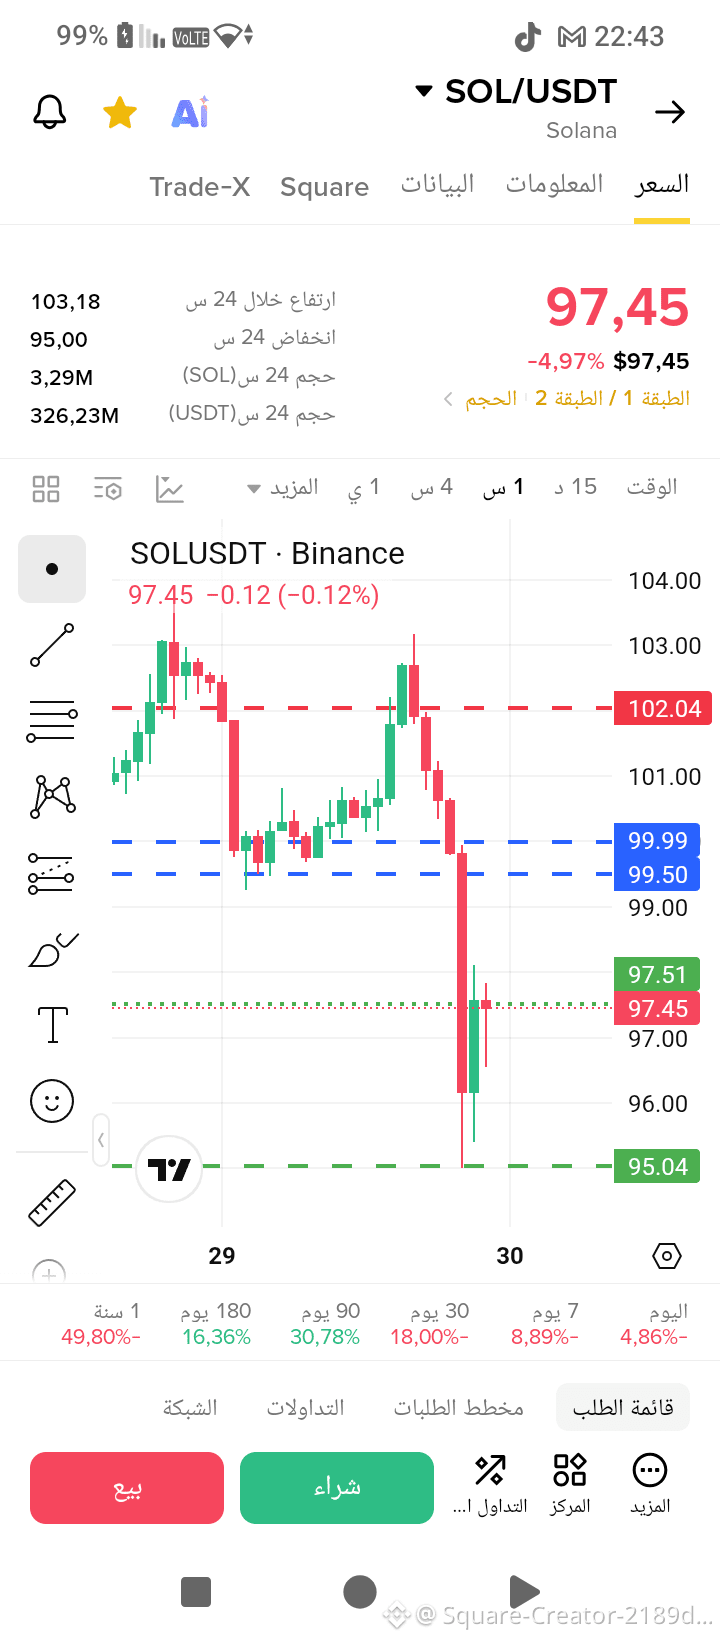
Trading Recommendation: Sell SOL/USDT (SHORT)
📊 Pair: SOL/USDT — Solana
📉 Trade Type: Sell (SELL)
⏱️ Timeframe: 1h
💰 Entry Zone:
99.99$ – 99.50$
🛑 Stop Loss:
102.04$
🎯 Take Profit Targets:
TP1: 97.51$
TP2: 95.04$
$SOL
Trading Recommendation: Sell SOL/USDT (SHORT)
📊 Pair: SOL/USDT — Solana
📉 Trade Type: Sell (SELL)
⏱️ Timeframe: 1h
💰 Entry Zone:
99.99$ – 99.50$
🛑 Stop Loss:
102.04$
🎯 Take Profit Targets:
TP1: 97.51$
TP2: 95.04$
Trading Recommendation: Sell SOL/USDT (SHORT)
📊 Pair: SOL/USDT — Solana
📉 Trade Type: Sell (SELL)
⏱️ Timeframe: 1h
💰 Entry Zone:
99.99$ – 99.50$
🛑 Stop Loss:
102.04$
🎯 Take Profit Targets:
TP1: 97.51$
TP2: 95.04$
118
$BTC
{spot}(BTCUSDT)
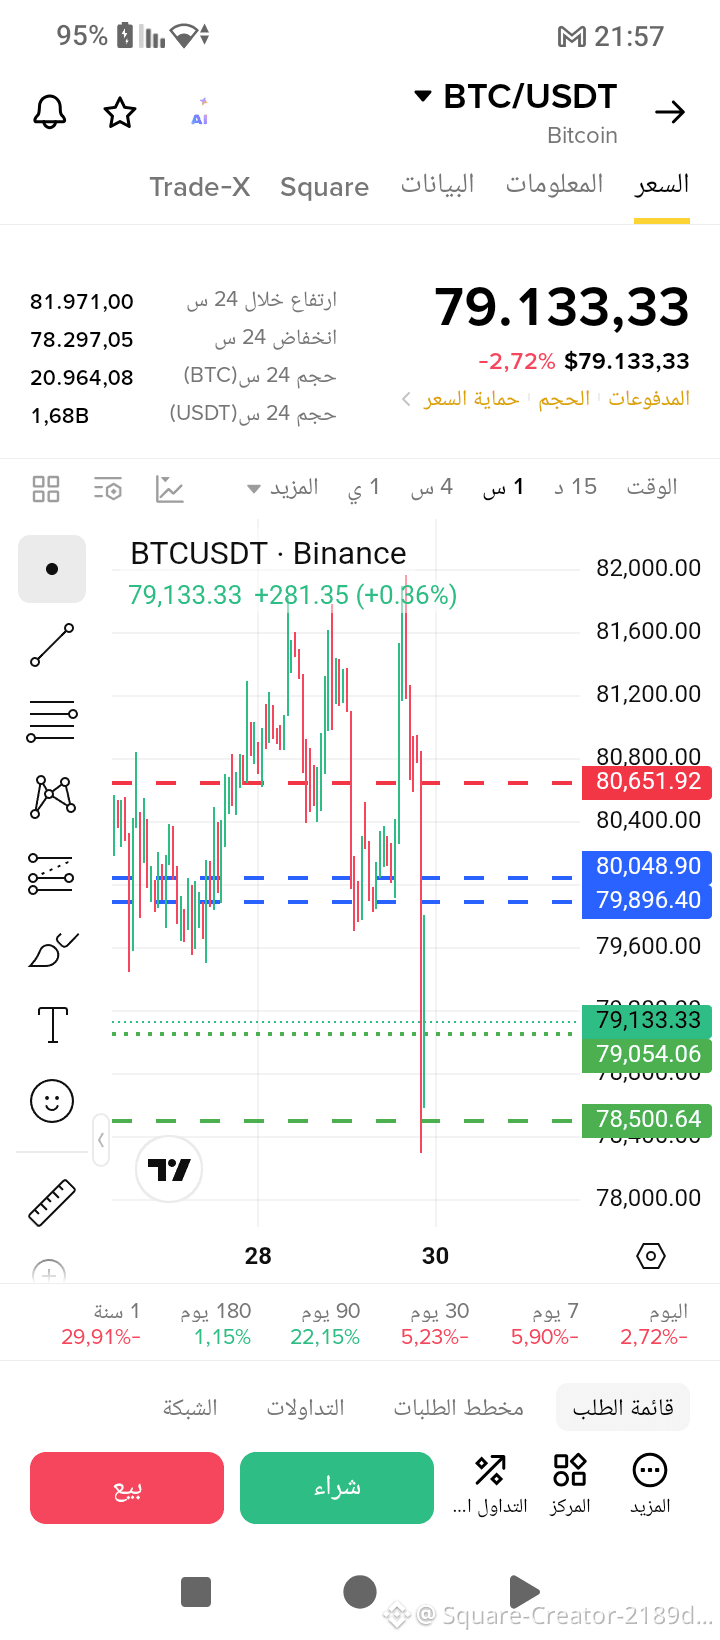
Trade type: Sell (Short).
Entry zone: between $79,896 and $80,048 (wait for the price to rebound upward into this zone before entering).
Profit targets
Target 1: $79,054.
Target 2: $78,500.
Stop loss (red line): A candle close above $80,651.
$BTC
Trade type: Sell (Short).
Entry zone: between $79,896 and $80,048 (wait for the price to rebound upward into this zone before entering).
Profit targets
Target 1: $79,054.
Target 2: $78,500.
Stop loss (red line): A candle close above $80,651.
Trade type: Sell (Short).
Entry zone: between $79,896 and $80,048 (wait for the price to rebound upward into this zone before entering).
Profit targets
Target 1: $79,054.
Target 2: $78,500.
Stop loss (red line): A candle close above $80,651.
125
$HYPE
{spot}(HYPEUSDT)
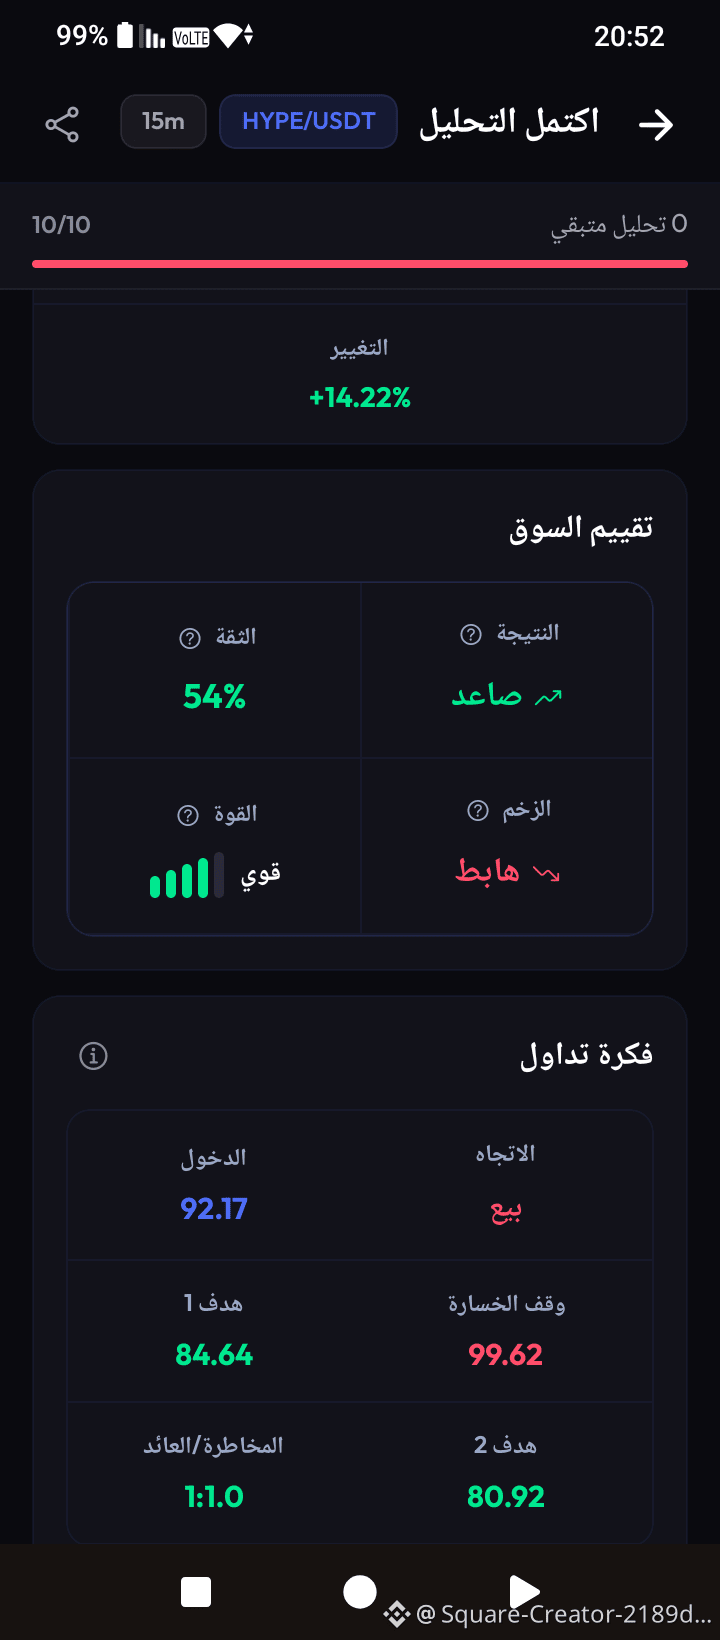
Trade details
Trade type (direction): Sell (Short / Sell)
Entry price: 92.17
Stop Loss: 99.62
Take Profit 1: 84.64
Take Profit 2: 80.92
Risk-to-reward ratio: 1:1.0
$HYPE
Trade details
Trade type (direction): Sell (Short / Sell)
Entry price: 92.17
Stop Loss: 99.62
Take Profit 1: 84.64
Take Profit 2: 80.92
Risk-to-reward ratio: 1:1.0
Trade details
Trade type (direction): Sell (Short / Sell)
Entry price: 92.17
Stop Loss: 99.62
Take Profit 1: 84.64
Take Profit 2: 80.92
Risk-to-reward ratio: 1:1.0
224
$BMT
{spot}(BMTUSDT)
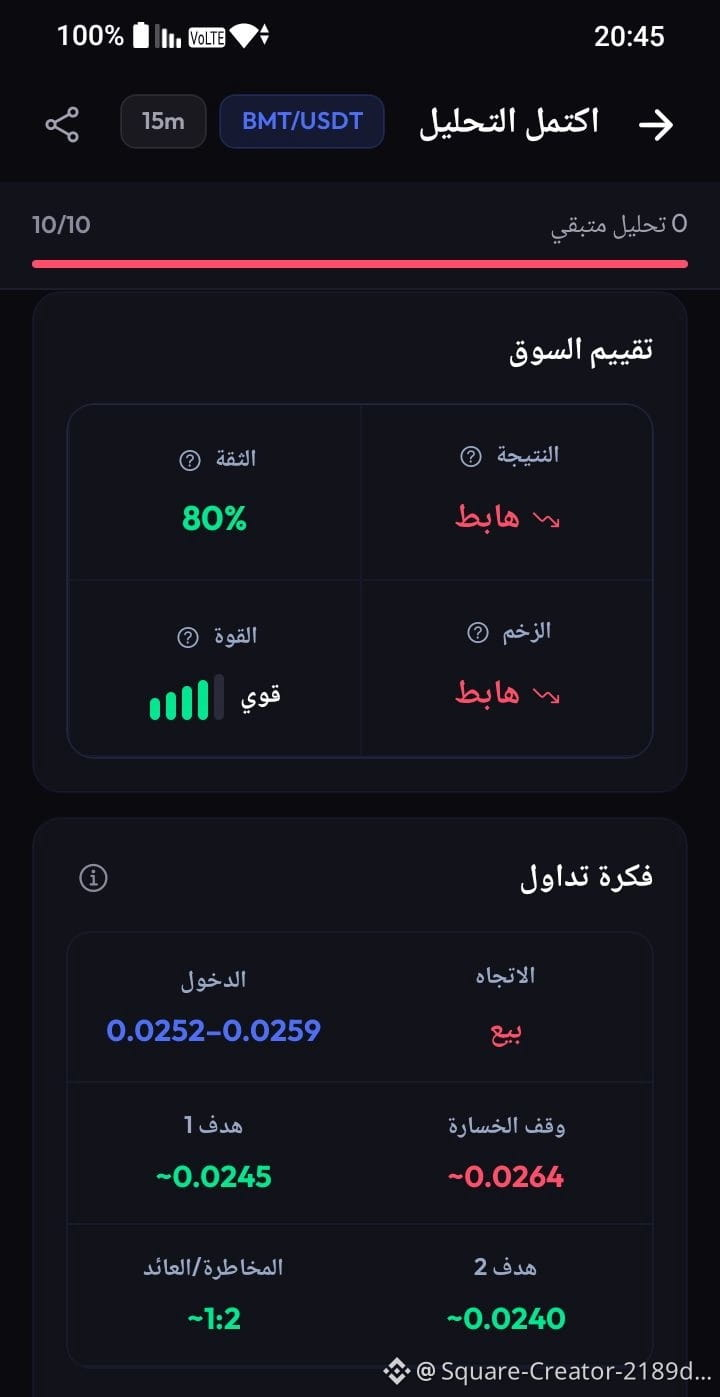
Trade type: Sell (Sell / Short)
Entry zone: 0.0252 - 0.0259
First target (TP1): 0.0245
Second target (TP2): 0.0240
Stop loss (SL): 0.0264
Risk-to-reward ratio: 1:2
$BMT
Trade type: Sell (Sell / Short)
Entry zone: 0.0252 - 0.0259
First target (TP1): 0.0245
Second target (TP2): 0.0240
Stop loss (SL): 0.0264
Risk-to-reward ratio: 1:2
Trade type: Sell (Sell / Short)
Entry zone: 0.0252 - 0.0259
First target (TP1): 0.0245
Second target (TP2): 0.0240
Stop loss (SL): 0.0264
Risk-to-reward ratio: 1:2
477
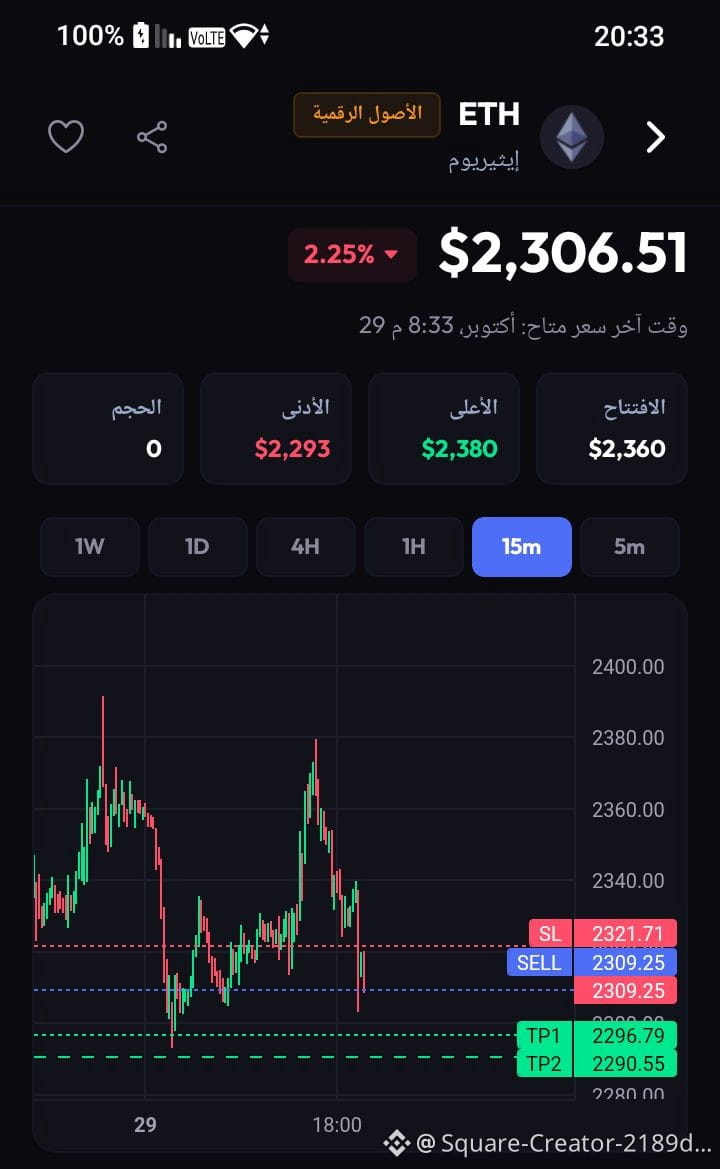
$ETH
{spot}(ETHUSDT)
Trade type: Sell / Short (SELL)
Entry Price: 2,309.25
Stop Loss (SL): 2,321.71
Take Profit:
Target 1 (TP1): 2,296.79
Target 2 (TP2): 2,290.55
$ETH
Trade type: Sell / Short (SELL)
Entry Price: 2,309.25
Stop Loss (SL): 2,321.71
Take Profit:
Target 1 (TP1): 2,296.79
Target 2 (TP2): 2,290.55
Trade type: Sell / Short (SELL)
Entry Price: 2,309.25
Stop Loss (SL): 2,321.71
Take Profit:
Target 1 (TP1): 2,296.79
Target 2 (TP2): 2,290.55
114
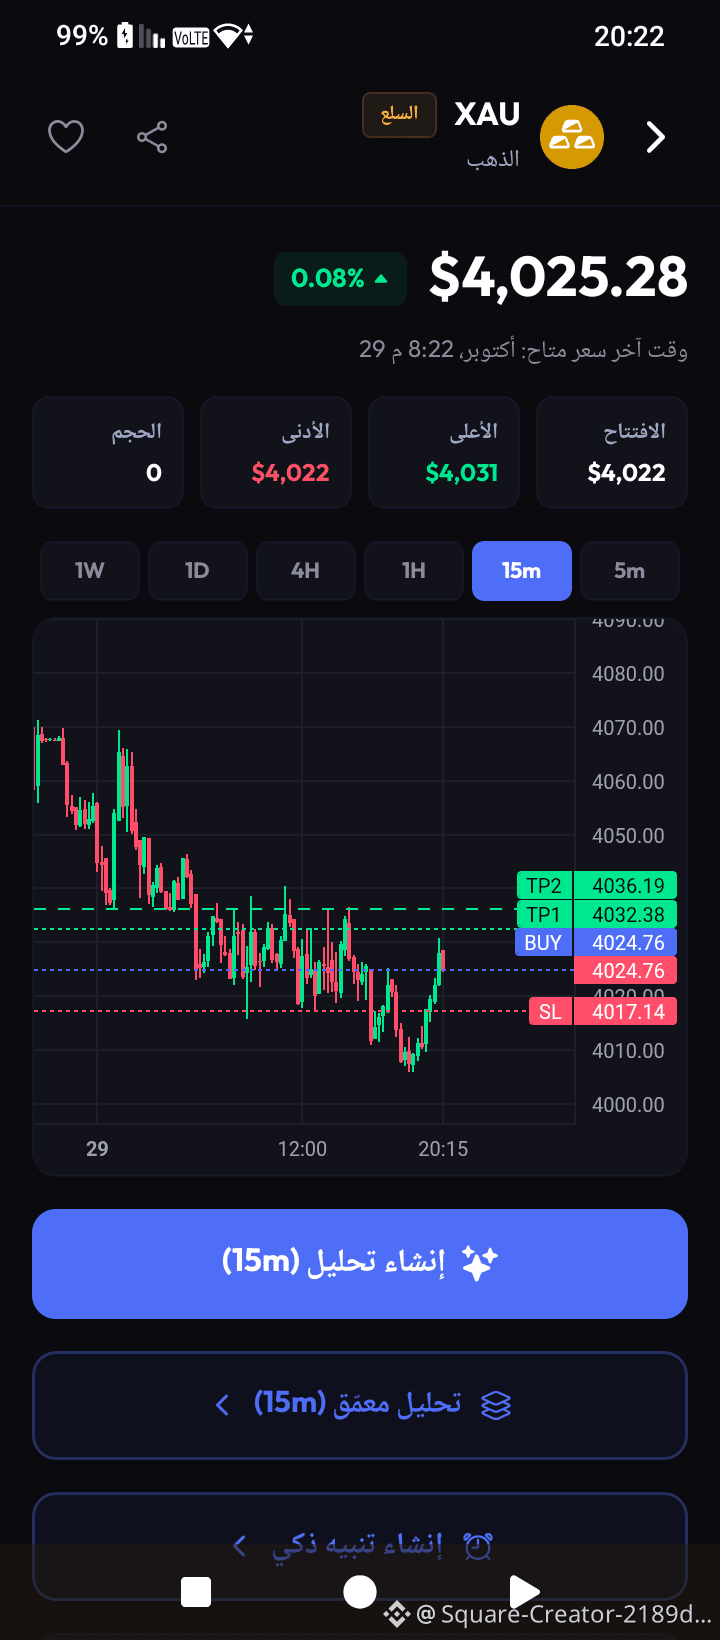
$XAU
{future}(XAUUSDT)
Trade type: Buy (BUY)
Entry point (BUY): 4024.76
First target (TP1): 4032.38
Second target (TP2): 4036.19
Stop loss (SL): 4017.14
$XAU
Trade type: Buy (BUY)
Entry point (BUY): 4024.76
First target (TP1): 4032.38
Second target (TP2): 4036.19
Stop loss (SL): 4017.14
Trade type: Buy (BUY)
Entry point (BUY): 4024.76
First target (TP1): 4032.38
Second target (TP2): 4036.19
Stop loss (SL): 4017.14
178
·
--
Bullish
$CL
{future}(CLUSDT)
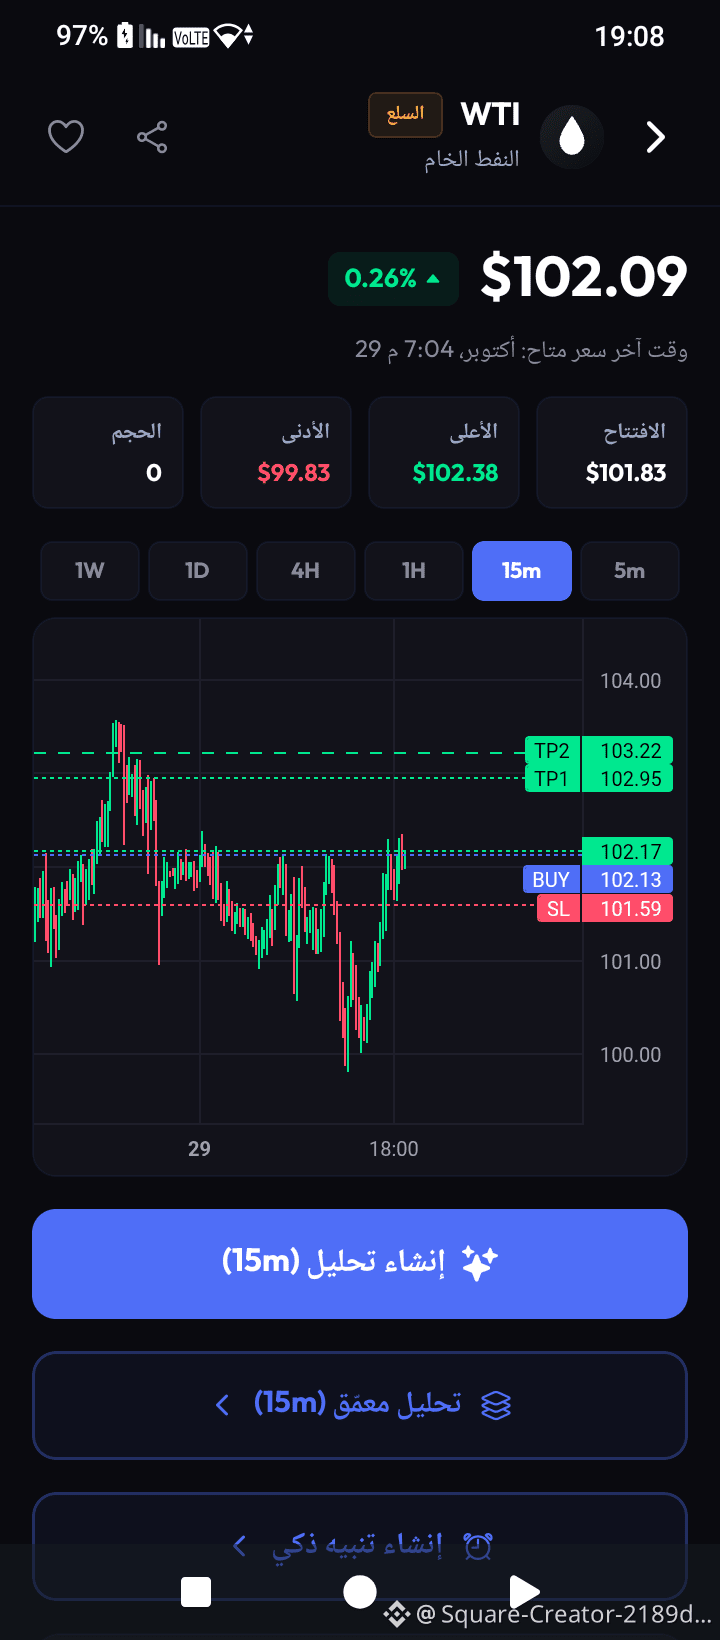
Trade type: Buy (BUY)
Trading instrument: Crude oil (WTI)
Recommended entry price: $102.13 (or the nearby current price of $102.09)
First target (TP1): $102.95
Second target (TP2): $103.22
Stop loss (SL): $101.59
$CL
Trade type: Buy (BUY)
Trading instrument: Crude oil (WTI)
Recommended entry price: $102.13 (or the nearby current price of $102.09)
First target (TP1): $102.95
Second target (TP2): $103.22
Stop loss (SL): $101.59
Trade type: Buy (BUY)
Trading instrument: Crude oil (WTI)
Recommended entry price: $102.13 (or the nearby current price of $102.09)
First target (TP1): $102.95
Second target (TP2): $103.22
Stop loss (SL): $101.59
125
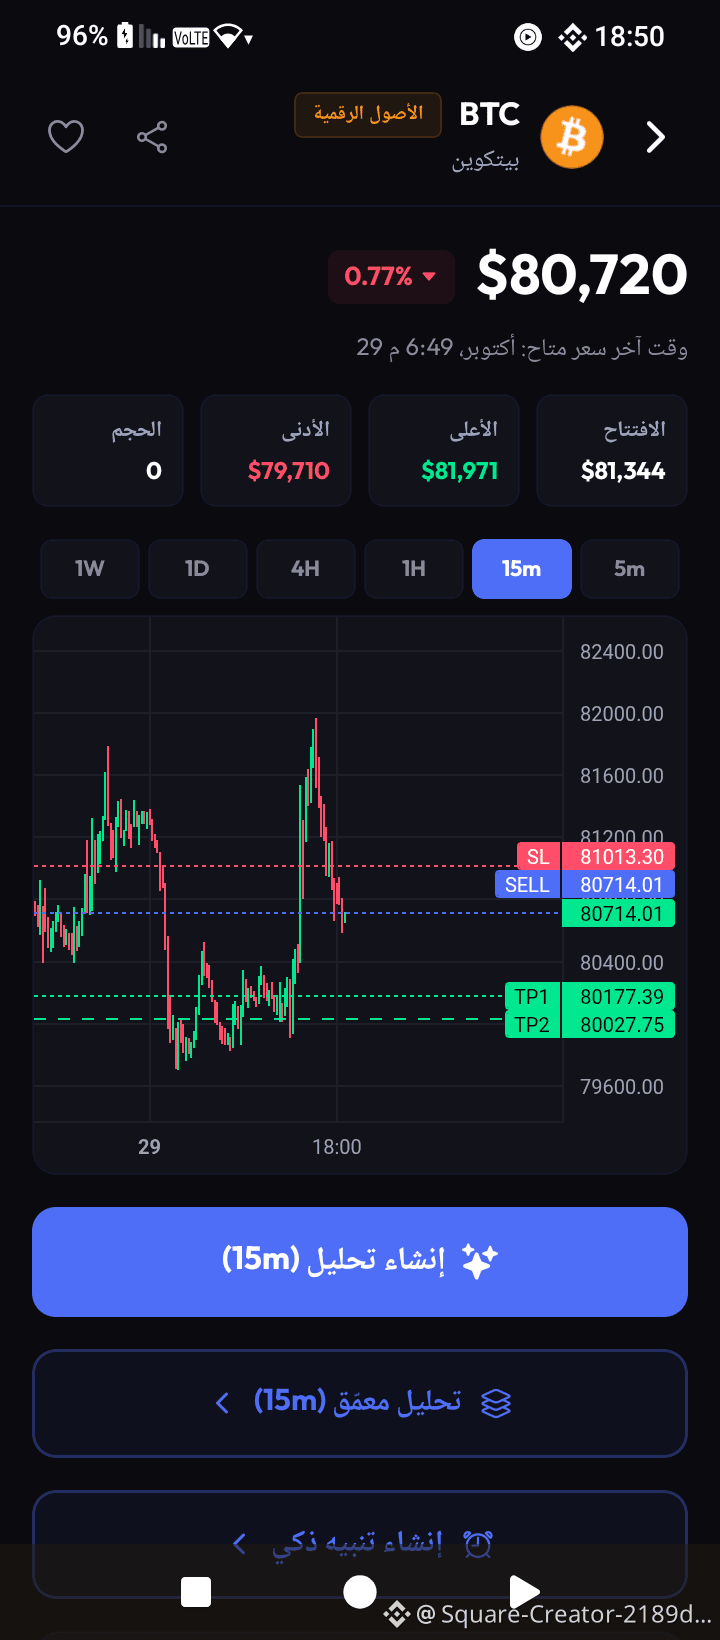
$BTC
{spot}(BTCUSDT)
Trade type: Sell (SELL)
Current entry price: 80,714.01
Stop-loss order (Stop Loss - SL): 81,013.30
First target (Take Profit 1 - TP1): 80,177.39
Second target (Take Profit 2 - TP2): 80,027.75
$BTC
Trade type: Sell (SELL)
Current entry price: 80,714.01
Stop-loss order (Stop Loss - SL): 81,013.30
First target (Take Profit 1 - TP1): 80,177.39
Second target (Take Profit 2 - TP2): 80,027.75
Trade type: Sell (SELL)
Current entry price: 80,714.01
Stop-loss order (Stop Loss - SL): 81,013.30
First target (Take Profit 1 - TP1): 80,177.39
Second target (Take Profit 2 - TP2): 80,027.75
97
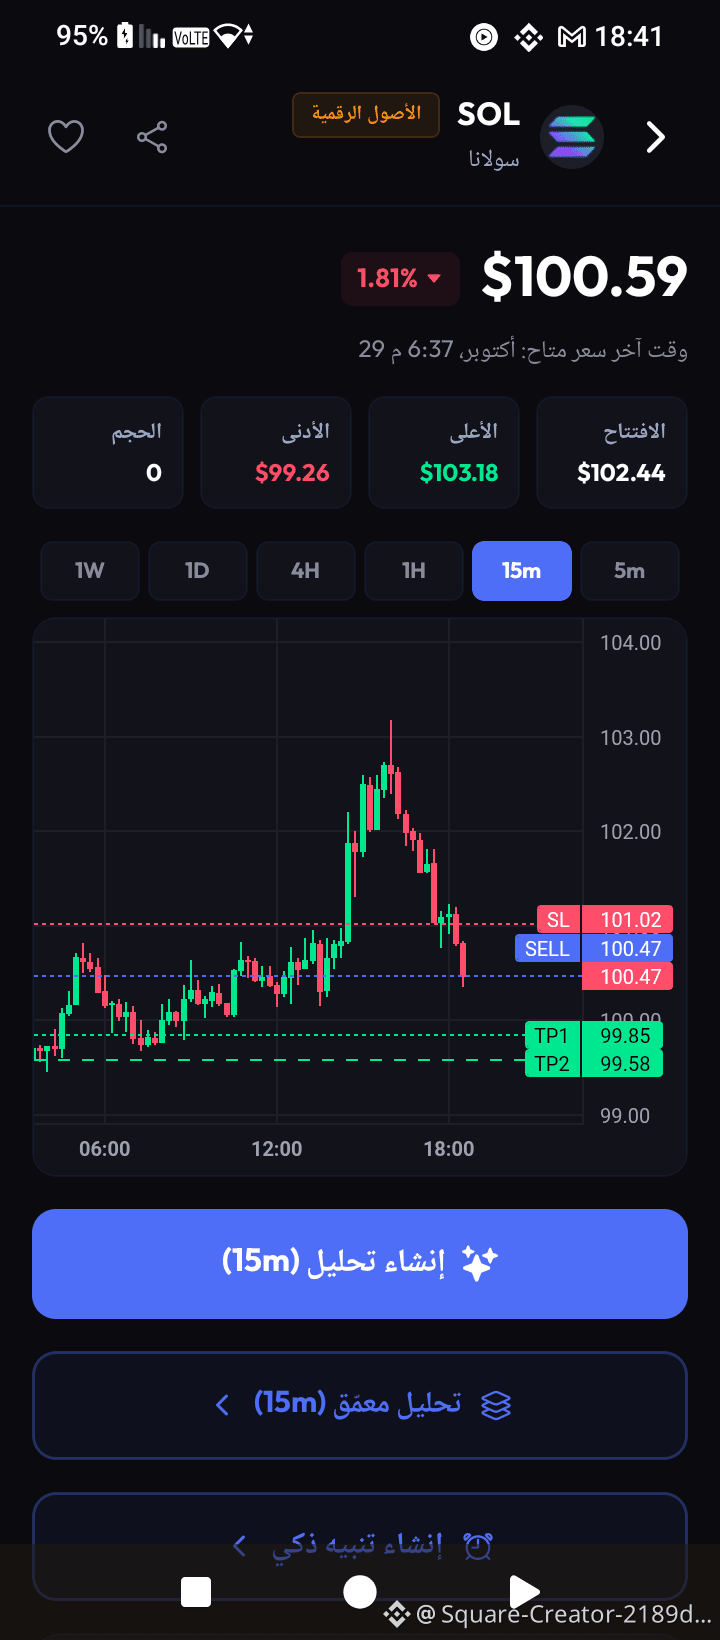
$SOL
{spot}(SOLUSDT)
Trade type: Sell (SELL)
Suggested entry price: $100.47
Stop loss (SL): $101.02
First target (TP1): $99.85
Second target (TP2): $99.58
$SOL
Trade type: Sell (SELL)
Suggested entry price: $100.47
Stop loss (SL): $101.02
First target (TP1): $99.85
Second target (TP2): $99.58
Trade type: Sell (SELL)
Suggested entry price: $100.47
Stop loss (SL): $101.02
First target (TP1): $99.85
Second target (TP2): $99.58
273
$1000PEPE
{future}(1000PEPEUSDT)
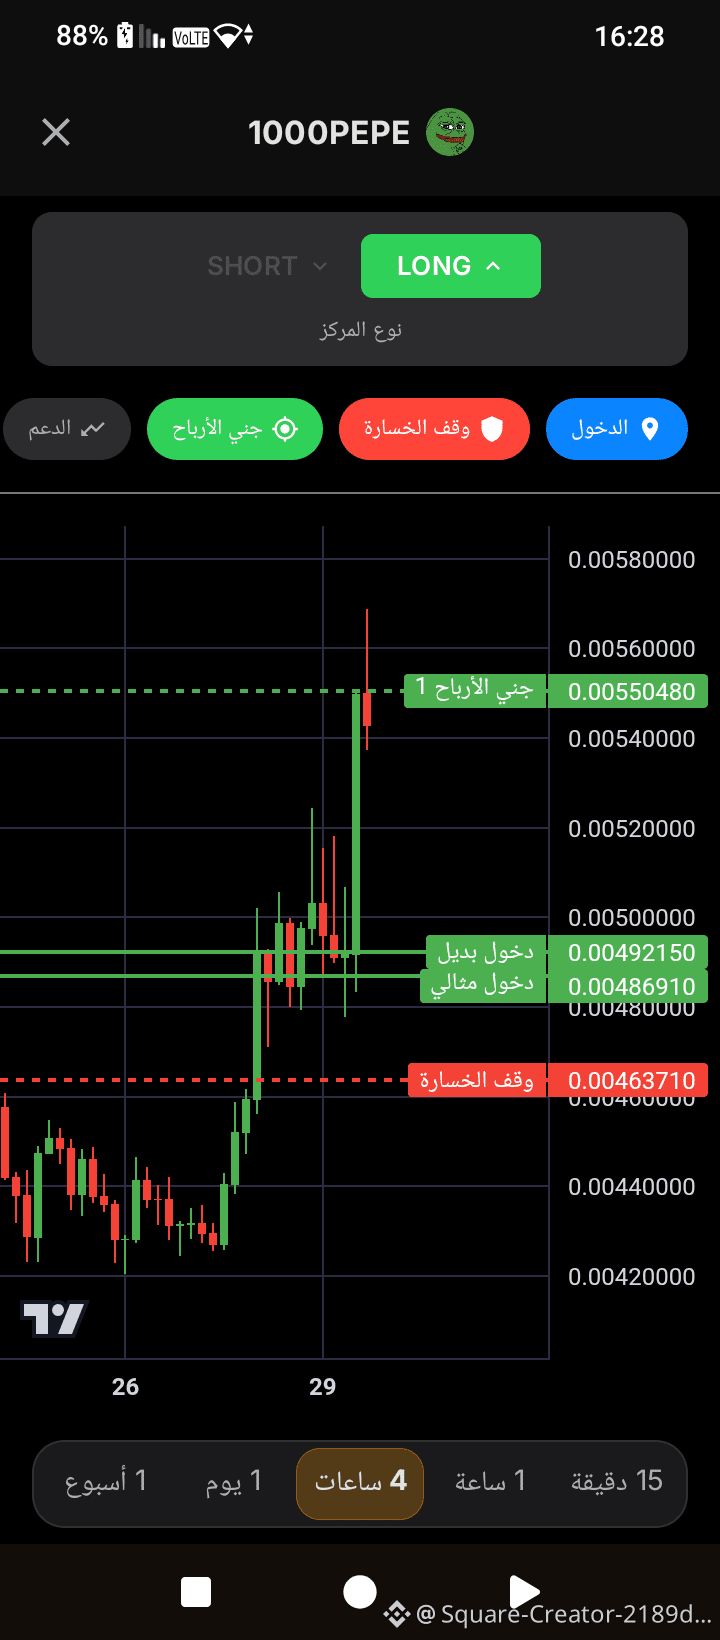
Trade details (LONG)
Position type: Buy / bullish (LONG) [0.00486910]
Ideal entry zone: 0.00486910
Alternative entry zone: 0.00492150
Take profit (TP 1): 0.00550480
Stop loss (SL): 0.00463710
$1000PEPE
Trade details (LONG)
Position type: Buy / bullish (LONG) [0.00486910]
Ideal entry zone: 0.00486910
Alternative entry zone: 0.00492150
Take profit (TP 1): 0.00550480
Stop loss (SL): 0.00463710
Trade details (LONG)
Position type: Buy / bullish (LONG) [0.00486910]
Ideal entry zone: 0.00486910
Alternative entry zone: 0.00492150
Take profit (TP 1): 0.00550480
Stop loss (SL): 0.00463710
206
$NEAR
{spot}(NEARUSDT)
Direction: Sell (SHORT) — conditional on confirmation of a downward move
⏱️ Timeframe: 15 minutes (15m)
💰 Reference price: 4.471 USDT
📍 Entry zone: 4.430–4.450 USDT, after downward confirmation appears on the chart.
🎯 Take-profit targets:
TP1: 4.400
TP2: 4.372
TP3: 4.320
🛑 Stop loss: 4.490 USDT
⚠️ Scenario invalidation: A 15-minute candle closes above 4.490 before the targets are reached.
📉 Technical analysis:
The price is down 3.18% over 24 hours, reflecting daily downward pressure.
The Supertrend indicator is at 4.372, and the current price is above it; therefore, there is not enough confirmation that sellers are in control on the 15-minute timeframe.
The MACD indicator is positive according to the stated values, which may indicate short-term upward momentum.
✅ Trade management: Do not enter before a clear bearish candle appears and weakening buyer strength is confirmed. You can take partial profits at TP1 and move the stop to the entry price
$NEAR
Direction: Sell (SHORT) — conditional on confirmation of a downward move
⏱️ Timeframe: 15 minutes (15m)
💰 Reference price: 4.471 USDT
📍 Entry zone: 4.430–4.450 USDT, after downward confirmation appears on the chart.
🎯 Take-profit targets:
TP1: 4.400
TP2: 4.372
TP3: 4.320
🛑 Stop loss: 4.490 USDT
⚠️ Scenario invalidation: A 15-minute candle closes above 4.490 before the targets are reached.
📉 Technical analysis:
The price is down 3.18% over 24 hours, reflecting daily downward pressure.
The Supertrend indicator is at 4.372, and the current price is above it; therefore, there is not enough confirmation that sellers are in control on the 15-minute timeframe.
The MACD indicator is positive according to the stated values, which may indicate short-term upward momentum.
✅ Trade management: Do not enter before a clear bearish candle appears and weakening buyer strength is confirmed. You can take partial profits at TP1 and move the stop to the entry price
Direction: Sell (SHORT) — conditional on confirmation of a downward move
⏱️ Timeframe: 15 minutes (15m)
💰 Reference price: 4.471 USDT
📍 Entry zone: 4.430–4.450 USDT, after downward confirmation appears on the chart.
🎯 Take-profit targets:
TP1: 4.400
TP2: 4.372
TP3: 4.320
🛑 Stop loss: 4.490 USDT
⚠️ Scenario invalidation: A 15-minute candle closes above 4.490 before the targets are reached.
📉 Technical analysis:
The price is down 3.18% over 24 hours, reflecting daily downward pressure.
The Supertrend indicator is at 4.372, and the current price is above it; therefore, there is not enough confirmation that sellers are in control on the 15-minute timeframe.
The MACD indicator is positive according to the stated values, which may indicate short-term upward momentum.
✅ Trade management: Do not enter before a clear bearish candle appears and weakening buyer strength is confirmed. You can take partial profits at TP1 and move the stop to the entry price
1
249
$EVAA
{future}(EVAAUSDT)
Professional Trading Recommendation — EVAA/USDT
🔴 Direction: Sell (SHORT)
⏱️ Timeframe: 15 minutes
💰 Reference price: 1.0733 USDT
📍 Entry zone: 1.0800 – 1.1000 USDT, after a price rejection and confirmation of a downward move.
🎯 Take-profit targets:
TP1: 1.0550
TP2: 1.0365
TP3: 1.0100
🛑 Stop-loss (SL): 1.1250
⚠️ Invalidation of the short scenario: A breakout above 1.1250 and holding above it.
📉 Technical analysis:
The price is below EMA(7), EMA(25), and EMA(99), indicating clear selling pressure.
The MACD indicator is in negative territory, supporting continued downward momentum.
The 1.0363 level is an important zone associated with the SuperTrend indicator.
The 1.0054 level is the low recorded over the past 24 hours and may act as important support.
💡 Trade management: Consider taking 50% profit at TP1, 25% at TP2, and 25% at TP3. Move the stop-loss to the entry point after the first target is reached.
$EVAA
Professional Trading Recommendation — EVAA/USDT
🔴 Direction: Sell (SHORT)
⏱️ Timeframe: 15 minutes
💰 Reference price: 1.0733 USDT
📍 Entry zone: 1.0800 – 1.1000 USDT, after a price rejection and confirmation of a downward move.
🎯 Take-profit targets:
TP1: 1.0550
TP2: 1.0365
TP3: 1.0100
🛑 Stop-loss (SL): 1.1250
⚠️ Invalidation of the short scenario: A breakout above 1.1250 and holding above it.
📉 Technical analysis:
The price is below EMA(7), EMA(25), and EMA(99), indicating clear selling pressure.
The MACD indicator is in negative territory, supporting continued downward momentum.
The 1.0363 level is an important zone associated with the SuperTrend indicator.
The 1.0054 level is the low recorded over the past 24 hours and may act as important support.
💡 Trade management: Consider taking 50% profit at TP1, 25% at TP2, and 25% at TP3. Move the stop-loss to the entry point after the first target is reached.
Professional Trading Recommendation — EVAA/USDT
🔴 Direction: Sell (SHORT)
⏱️ Timeframe: 15 minutes
💰 Reference price: 1.0733 USDT
📍 Entry zone: 1.0800 – 1.1000 USDT, after a price rejection and confirmation of a downward move.
🎯 Take-profit targets:
TP1: 1.0550
TP2: 1.0365
TP3: 1.0100
🛑 Stop-loss (SL): 1.1250
⚠️ Invalidation of the short scenario: A breakout above 1.1250 and holding above it.
📉 Technical analysis:
The price is below EMA(7), EMA(25), and EMA(99), indicating clear selling pressure.
The MACD indicator is in negative territory, supporting continued downward momentum.
The 1.0363 level is an important zone associated with the SuperTrend indicator.
The 1.0054 level is the low recorded over the past 24 hours and may act as important support.
💡 Trade management: Consider taking 50% profit at TP1, 25% at TP2, and 25% at TP3. Move the stop-loss to the entry point after the first target is reached.
48
$QNT
{spot}(QNTUSDT)
Professional Trading Recommendation — QNT/USDT
🔴 Direction: Sell (SHORT)
⏱️ Timeframe: One hour (1H)
💰 Reference price: 192.97 USDT
📍 Entry zone: 192.80 – 193.30 USDT
🎯 Take-profit targets:
TP1: 191.80 USDT
TP2: 190.10 USDT
TP3: 188.80 USDT
🛑 Stop loss (SL): 195.00 USDT
⚠️ Sell scenario invalidation: A breakout above 195.00 and holding above it.
📉 Technical analysis:
The price is below EMA(25) and EMA(99), reflecting bearish pressure.
The SuperTrend indicator at 195.87 suggests potential resistance.
The MACD indicator is in negative territory, supporting caution about continued downward movement.
The 190.07 level represents important support; breaking below it could open the way to lower levels.
💡 Trade management: You can close 50% at TP1, 25% at TP2, and 25% at TP3. After reaching the first target, you can move the stop loss to the entry point.
$QNT
Professional Trading Recommendation — QNT/USDT
🔴 Direction: Sell (SHORT)
⏱️ Timeframe: One hour (1H)
💰 Reference price: 192.97 USDT
📍 Entry zone: 192.80 – 193.30 USDT
🎯 Take-profit targets:
TP1: 191.80 USDT
TP2: 190.10 USDT
TP3: 188.80 USDT
🛑 Stop loss (SL): 195.00 USDT
⚠️ Sell scenario invalidation: A breakout above 195.00 and holding above it.
📉 Technical analysis:
The price is below EMA(25) and EMA(99), reflecting bearish pressure.
The SuperTrend indicator at 195.87 suggests potential resistance.
The MACD indicator is in negative territory, supporting caution about continued downward movement.
The 190.07 level represents important support; breaking below it could open the way to lower levels.
💡 Trade management: You can close 50% at TP1, 25% at TP2, and 25% at TP3. After reaching the first target, you can move the stop loss to the entry point.
Professional Trading Recommendation — QNT/USDT
🔴 Direction: Sell (SHORT)
⏱️ Timeframe: One hour (1H)
💰 Reference price: 192.97 USDT
📍 Entry zone: 192.80 – 193.30 USDT
🎯 Take-profit targets:
TP1: 191.80 USDT
TP2: 190.10 USDT
TP3: 188.80 USDT
🛑 Stop loss (SL): 195.00 USDT
⚠️ Sell scenario invalidation: A breakout above 195.00 and holding above it.
📉 Technical analysis:
The price is below EMA(25) and EMA(99), reflecting bearish pressure.
The SuperTrend indicator at 195.87 suggests potential resistance.
The MACD indicator is in negative territory, supporting caution about continued downward movement.
The 190.07 level represents important support; breaking below it could open the way to lower levels.
💡 Trade management: You can close 50% at TP1, 25% at TP2, and 25% at TP3. After reaching the first target, you can move the stop loss to the entry point.
355
$SUI
{spot}(SUIUSDT)
Professional Trading Recommendation — SUI/USDT
🔴 Direction: Sell (SHORT)
⏱️ Timeframe: 15 minutes
📌 Order type: Enter after downside confirmation
💰 Entry zone: 0.9090 – 0.9120 USDT
🎯 Take-profit targets:
TP1: 0.9050
TP2: 0.9000
TP3: 0.8950
🛑 Stop loss (SL): 0.9195
⚠️ Invalidation of the short scenario: Reclaiming the 0.9195 level and holding above it.
📉 Technical analysis: Price is trading below EMA99, with potential resistance at the SuperTrend level, suggesting continued short-term selling pressure, provided the move is confirmed by a break of support.
💡 Trade management: Consider taking 50% profit at the first target and moving the stop loss to the entry point after reaching it is confirmed.
$SUI
Professional Trading Recommendation — SUI/USDT
🔴 Direction: Sell (SHORT)
⏱️ Timeframe: 15 minutes
📌 Order type: Enter after downside confirmation
💰 Entry zone: 0.9090 – 0.9120 USDT
🎯 Take-profit targets:
TP1: 0.9050
TP2: 0.9000
TP3: 0.8950
🛑 Stop loss (SL): 0.9195
⚠️ Invalidation of the short scenario: Reclaiming the 0.9195 level and holding above it.
📉 Technical analysis: Price is trading below EMA99, with potential resistance at the SuperTrend level, suggesting continued short-term selling pressure, provided the move is confirmed by a break of support.
💡 Trade management: Consider taking 50% profit at the first target and moving the stop loss to the entry point after reaching it is confirmed.
Professional Trading Recommendation — SUI/USDT
🔴 Direction: Sell (SHORT)
⏱️ Timeframe: 15 minutes
📌 Order type: Enter after downside confirmation
💰 Entry zone: 0.9090 – 0.9120 USDT
🎯 Take-profit targets:
TP1: 0.9050
TP2: 0.9000
TP3: 0.8950
🛑 Stop loss (SL): 0.9195
⚠️ Invalidation of the short scenario: Reclaiming the 0.9195 level and holding above it.
📉 Technical analysis: Price is trading below EMA99, with potential resistance at the SuperTrend level, suggesting continued short-term selling pressure, provided the move is confirmed by a break of support.
💡 Trade management: Consider taking 50% profit at the first target and moving the stop loss to the entry point after reaching it is confirmed.
116
$ZEC
{spot}(ZECUSDT)
Trading recommendation: SELL — ZEC/USDT
📊 Timeframe: 15 minutes
💰 Reference price: 1,251.25 USDT
📉 Trade type: Sell, conditional on confirmation of a downward move
📍 Entry zone: 1,255 – 1,260 USDT
🛑 Stop loss (SL): 1,268 USDT
🎯 First target (TP1): 1,248 USDT
🎯 Second target (TP2): 1,240 USDT
🎯 Third target (TP3): 1,232 USDT
⚠️ Cancel the sell scenario if price breaks above 1,268 and holds above it.
📌 Trade management:
Wait for a bearish candle to appear in the entry zone before executing.
You can close part of the position at TP1.
After TP1 is reached, consider moving the stop loss to the entry point.
If the price drops below the entry zone before the order is executed, do not chase the trade.
$ZEC
Trading recommendation: SELL — ZEC/USDT
📊 Timeframe: 15 minutes
💰 Reference price: 1,251.25 USDT
📉 Trade type: Sell, conditional on confirmation of a downward move
📍 Entry zone: 1,255 – 1,260 USDT
🛑 Stop loss (SL): 1,268 USDT
🎯 First target (TP1): 1,248 USDT
🎯 Second target (TP2): 1,240 USDT
🎯 Third target (TP3): 1,232 USDT
⚠️ Cancel the sell scenario if price breaks above 1,268 and holds above it.
📌 Trade management:
Wait for a bearish candle to appear in the entry zone before executing.
You can close part of the position at TP1.
After TP1 is reached, consider moving the stop loss to the entry point.
If the price drops below the entry zone before the order is executed, do not chase the trade.
Trading recommendation: SELL — ZEC/USDT
📊 Timeframe: 15 minutes
💰 Reference price: 1,251.25 USDT
📉 Trade type: Sell, conditional on confirmation of a downward move
📍 Entry zone: 1,255 – 1,260 USDT
🛑 Stop loss (SL): 1,268 USDT
🎯 First target (TP1): 1,248 USDT
🎯 Second target (TP2): 1,240 USDT
🎯 Third target (TP3): 1,232 USDT
⚠️ Cancel the sell scenario if price breaks above 1,268 and holds above it.
📌 Trade management:
Wait for a bearish candle to appear in the entry zone before executing.
You can close part of the position at TP1.
After TP1 is reached, consider moving the stop loss to the entry point.
If the price drops below the entry zone before the order is executed, do not chase the trade.
121
$NIGHT
{spot}(NIGHTUSDT)
Trade recommendation: SELL — NIGHT/USDT
📊 Timeframe: 15 minutes (if the data is from this timeframe)
💰 Reference price: 0.03953 USDT
📍 Entry zone: 0.03965 – 0.03990
🛑 Stop loss (SL): 0.04015
🎯 First target TP1: 0.03930
🎯 Second target TP2: 0.03905
🎯 Third target TP3: 0.03885
⚠️ Invalidation of the sell scenario: A breakout above 0.04015 and holding above it.
📌 Trade management:
Wait for a bearish candle to appear before entering.
You can take partial profits at TP1.
Do not enter if the price rises directly above the entry zone.
If the price has already reached the first target before you enter, reassess the trade and do not chase the move.
$NIGHT
Trade recommendation: SELL — NIGHT/USDT
📊 Timeframe: 15 minutes (if the data is from this timeframe)
💰 Reference price: 0.03953 USDT
📍 Entry zone: 0.03965 – 0.03990
🛑 Stop loss (SL): 0.04015
🎯 First target TP1: 0.03930
🎯 Second target TP2: 0.03905
🎯 Third target TP3: 0.03885
⚠️ Invalidation of the sell scenario: A breakout above 0.04015 and holding above it.
📌 Trade management:
Wait for a bearish candle to appear before entering.
You can take partial profits at TP1.
Do not enter if the price rises directly above the entry zone.
If the price has already reached the first target before you enter, reassess the trade and do not chase the move.
Trade recommendation: SELL — NIGHT/USDT
📊 Timeframe: 15 minutes (if the data is from this timeframe)
💰 Reference price: 0.03953 USDT
📍 Entry zone: 0.03965 – 0.03990
🛑 Stop loss (SL): 0.04015
🎯 First target TP1: 0.03930
🎯 Second target TP2: 0.03905
🎯 Third target TP3: 0.03885
⚠️ Invalidation of the sell scenario: A breakout above 0.04015 and holding above it.
📌 Trade management:
Wait for a bearish candle to appear before entering.
You can take partial profits at TP1.
Do not enter if the price rises directly above the entry zone.
If the price has already reached the first target before you enter, reassess the trade and do not chase the move.
168
$MOVR
{spot}(MOVRUSDT)
Trading recommendation: SELL — MOVR/USDT
📊 Timeframe: 15 minutes
💰 Price shown in the image: 1.103 USDT
🔻 Trade type: Sell after a rebound toward resistance
📍 Entry zone: 1.108 – 1.113
🛑 Stop loss (SL): 1.122
🎯 First target (TP1): 1.098
🎯 Second target (TP2): 1.090
🎯 Third target (TP3): 1.078
⚠️ Invalidation of the sell scenario: Break above 1.122 and hold above it.
$MOVR
Trading recommendation: SELL — MOVR/USDT
📊 Timeframe: 15 minutes
💰 Price shown in the image: 1.103 USDT
🔻 Trade type: Sell after a rebound toward resistance
📍 Entry zone: 1.108 – 1.113
🛑 Stop loss (SL): 1.122
🎯 First target (TP1): 1.098
🎯 Second target (TP2): 1.090
🎯 Third target (TP3): 1.078
⚠️ Invalidation of the sell scenario: Break above 1.122 and hold above it.
Trading recommendation: SELL — MOVR/USDT
📊 Timeframe: 15 minutes
💰 Price shown in the image: 1.103 USDT
🔻 Trade type: Sell after a rebound toward resistance
📍 Entry zone: 1.108 – 1.113
🛑 Stop loss (SL): 1.122
🎯 First target (TP1): 1.098
🎯 Second target (TP2): 1.090
🎯 Third target (TP3): 1.078
⚠️ Invalidation of the sell scenario: Break above 1.122 and hold above it.
226
$SAND
{spot}(SANDUSDT)
Trading recommendation: Sell SAND/USDT
📊 Timeframe: 15 minutes
💰 Price shown in the image: 0.04638 USDT
📉 Trend: Bearish
🔻 Trade type: SELL — Sell after rejection from resistance is confirmed
🎯 Entry zone: 0.04645 – 0.04660
🛑 Stop loss: 0.04690
✅ First target TP1: 0.04610
✅ Second target TP2: 0.04580
✅ Third target TP3: 0.04565
⚠️ Invalidate the sell scenario: Break above 0.04690 and hold above it.
$SAND
Trading recommendation: Sell SAND/USDT
📊 Timeframe: 15 minutes
💰 Price shown in the image: 0.04638 USDT
📉 Trend: Bearish
🔻 Trade type: SELL — Sell after rejection from resistance is confirmed
🎯 Entry zone: 0.04645 – 0.04660
🛑 Stop loss: 0.04690
✅ First target TP1: 0.04610
✅ Second target TP2: 0.04580
✅ Third target TP3: 0.04565
⚠️ Invalidate the sell scenario: Break above 0.04690 and hold above it.
Trading recommendation: Sell SAND/USDT
📊 Timeframe: 15 minutes
💰 Price shown in the image: 0.04638 USDT
📉 Trend: Bearish
🔻 Trade type: SELL — Sell after rejection from resistance is confirmed
🎯 Entry zone: 0.04645 – 0.04660
🛑 Stop loss: 0.04690
✅ First target TP1: 0.04610
✅ Second target TP2: 0.04580
✅ Third target TP3: 0.04565
⚠️ Invalidate the sell scenario: Break above 0.04690 and hold above it.
367
$BMT
{spot}(BMTUSDT)
Trading recommendation: Sell (SELL) — BMTUSDT
Strategy type: Short-Term Scalping.
Technical trend: Temporarily bearish (below the short-term moving averages).
🔑 Entry levels and risk management
Item | Value / Target | Order type
Entry Zone | 0.0274 – 0.0277 | Market Sell (sell at the current market price within the zone)
Stop Loss | 0.0281 | Conditional order to protect capital
🎯 Take-Profit Targets
Target 1: 0.0270
Target 2: 0.0268
Target 3: 0.0266
$BMT
Trading recommendation: Sell (SELL) — BMTUSDT
Strategy type: Short-Term Scalping.
Technical trend: Temporarily bearish (below the short-term moving averages).
🔑 Entry levels and risk management
Item | Value / Target | Order type
Entry Zone | 0.0274 – 0.0277 | Market Sell (sell at the current market price within the zone)
Stop Loss | 0.0281 | Conditional order to protect capital
🎯 Take-Profit Targets
Target 1: 0.0270
Target 2: 0.0268
Target 3: 0.0266
Trading recommendation: Sell (SELL) — BMTUSDT
Strategy type: Short-Term Scalping.
Technical trend: Temporarily bearish (below the short-term moving averages).
🔑 Entry levels and risk management
Item | Value / Target | Order type
Entry Zone | 0.0274 – 0.0277 | Market Sell (sell at the current market price within the zone)
Stop Loss | 0.0281 | Conditional order to protect capital
🎯 Take-Profit Targets
Target 1: 0.0270
Target 2: 0.0268
Target 3: 0.0266
229
Log in to explore more content
Join global crypto users on Binance Square
⚡️ Get latest and useful information about crypto.
💬 Trusted by the world’s largest crypto exchange.
👍 Discover real insights from verified creators.
Email / Phone number
Trending Topics
BinanceProcesses$4.65BWithdrawals
1,506 views
41 Discussing
Binance Processes $4.65 Billion in Withdrawals After Reopening, Net Outflow of $3.64 Billion Equals 2.1% of Its $171 Billion in Assets
Binance News
·20 Likes
·5.7k views
WithdrawalsBack: 15 networks live
3,747 views
96 Discussing
BinanceUpdatesProofofReservesAddresses
76,915 views
1,224 Discussing