

TimingByParis
4.9k Posts

TimingByParis
Report
Block User
Narrativas sobre mercados, psicología y convicción. El precio se mueve. Las emociones revelan. Escribo lo que los gráficos no muestran.
Open Trade
Frequent Trader
3.9 Years
287 Following
22.8K+ Followers
43.5K+ Liked
Posts
Portfolio
All
Quotes
PINNED
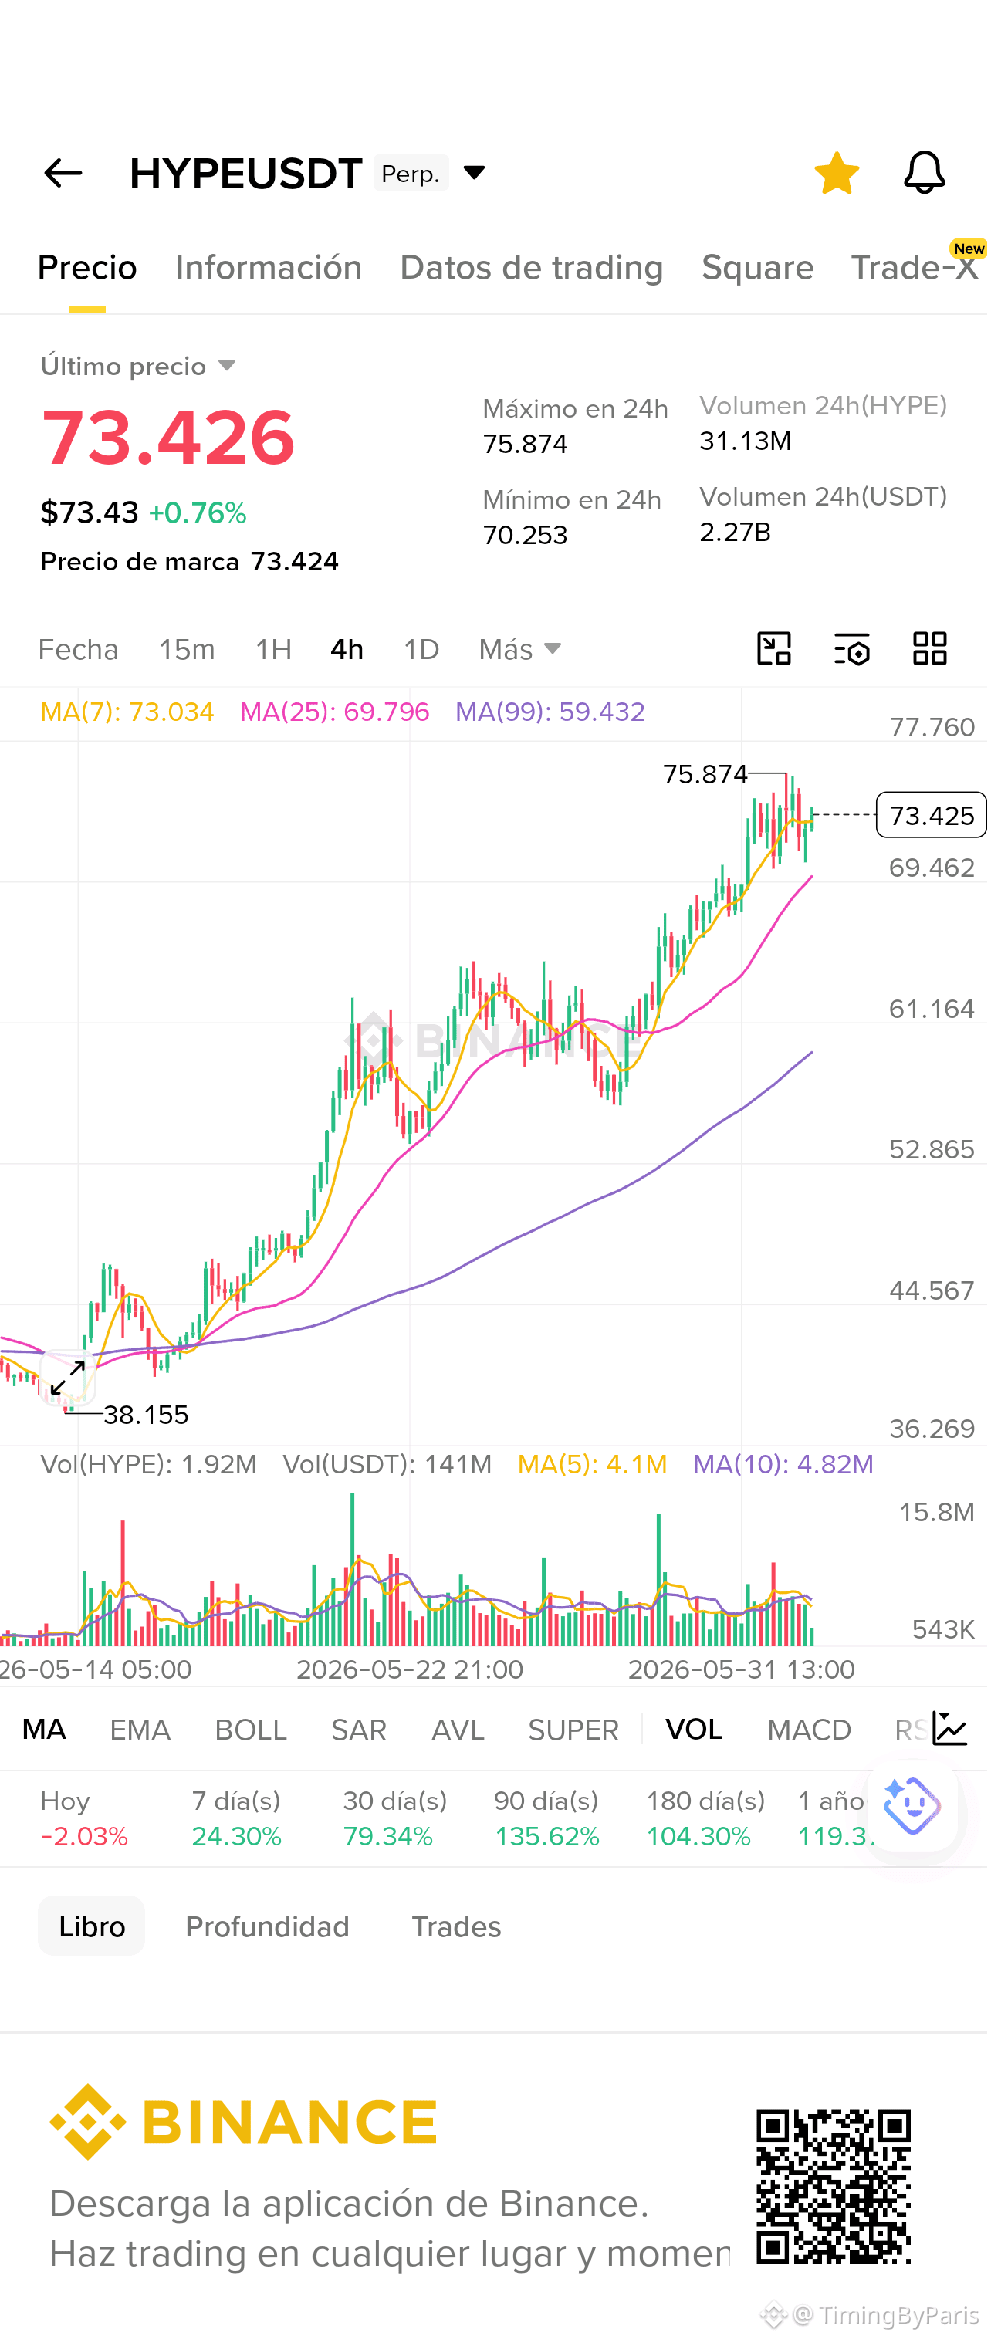
$HYPE update. Everything went according to plan.
I jumped in looking at RSI at 21 when no one wanted to touch this token. Since then, the market has been hitting target after target while many continued trying to find the top.
✅ 41.86
✅ 44.82
✅ 50.15
✅ 51.86
✅ 56.55
✅ 60.62
✅ 63.37
✅ 67.81
✅ 69.37
I'm still holding.
The most interesting part is that the market has already passed through several zones where significant supply should have appeared. So far, none have managed to break the structure.
Now we're approaching a different zone. 80 isn't just any number. It shows up as resistance across multiple timeframes, coincides with a major psychological barrier, and is likely where those who've been trying to guess the reversal for weeks will resurface.
🎯 80.00
⚠️ 80 is the level I'm going to keep a close eye on. If it breaks with a close and real volume, the path to much more ambitious targets starts to look a lot cleaner.
🎯 91.71
🔴 Stop adjusted below 62.00. If it loses that level with a strong close, I'll reevaluate the entire structure.
Patience did all the heavy lifting.
The trade is still alive.
😈👀
$HYPE
$HYPE update. Everything went according to plan.
I jumped in looking at RSI at 21 when no one wanted to touch this token. Since then, the market has been hitting target after target while many continued trying to find the top.
✅ 41.86
✅ 44.82
✅ 50.15
✅ 51.86
✅ 56.55
✅ 60.62
✅ 63.37
✅ 67.81
✅ 69.37
I'm still holding.
The most interesting part is that the market has already passed through several zones where significant supply should have appeared. So far, none have managed to break the structure.
Now we're approaching a different zone. 80 isn't just any number. It shows up as resistance across multiple timeframes, coincides with a major psychological barrier, and is likely where those who've been trying to guess the reversal for weeks will resurface.
🎯 80.00
⚠️ 80 is the level I'm going to keep a close eye on. If it breaks with a close and real volume, the path to much more ambitious targets starts to look a lot cleaner.
🎯 91.71
🔴 Stop adjusted below 62.00. If it loses that level with a strong close, I'll reevaluate the entire structure.
Patience did all the heavy lifting.
The trade is still alive.
😈👀
$HYPE
I jumped in looking at RSI at 21 when no one wanted to touch this token. Since then, the market has been hitting target after target while many continued trying to find the top.
✅ 41.86
✅ 44.82
✅ 50.15
✅ 51.86
✅ 56.55
✅ 60.62
✅ 63.37
✅ 67.81
✅ 69.37
I'm still holding.
The most interesting part is that the market has already passed through several zones where significant supply should have appeared. So far, none have managed to break the structure.
Now we're approaching a different zone. 80 isn't just any number. It shows up as resistance across multiple timeframes, coincides with a major psychological barrier, and is likely where those who've been trying to guess the reversal for weeks will resurface.
🎯 80.00
⚠️ 80 is the level I'm going to keep a close eye on. If it breaks with a close and real volume, the path to much more ambitious targets starts to look a lot cleaner.
🎯 91.71
🔴 Stop adjusted below 62.00. If it loses that level with a strong close, I'll reevaluate the entire structure.
Patience did all the heavy lifting.
The trade is still alive.
😈👀
$HYPE
2
6
257
PINNED
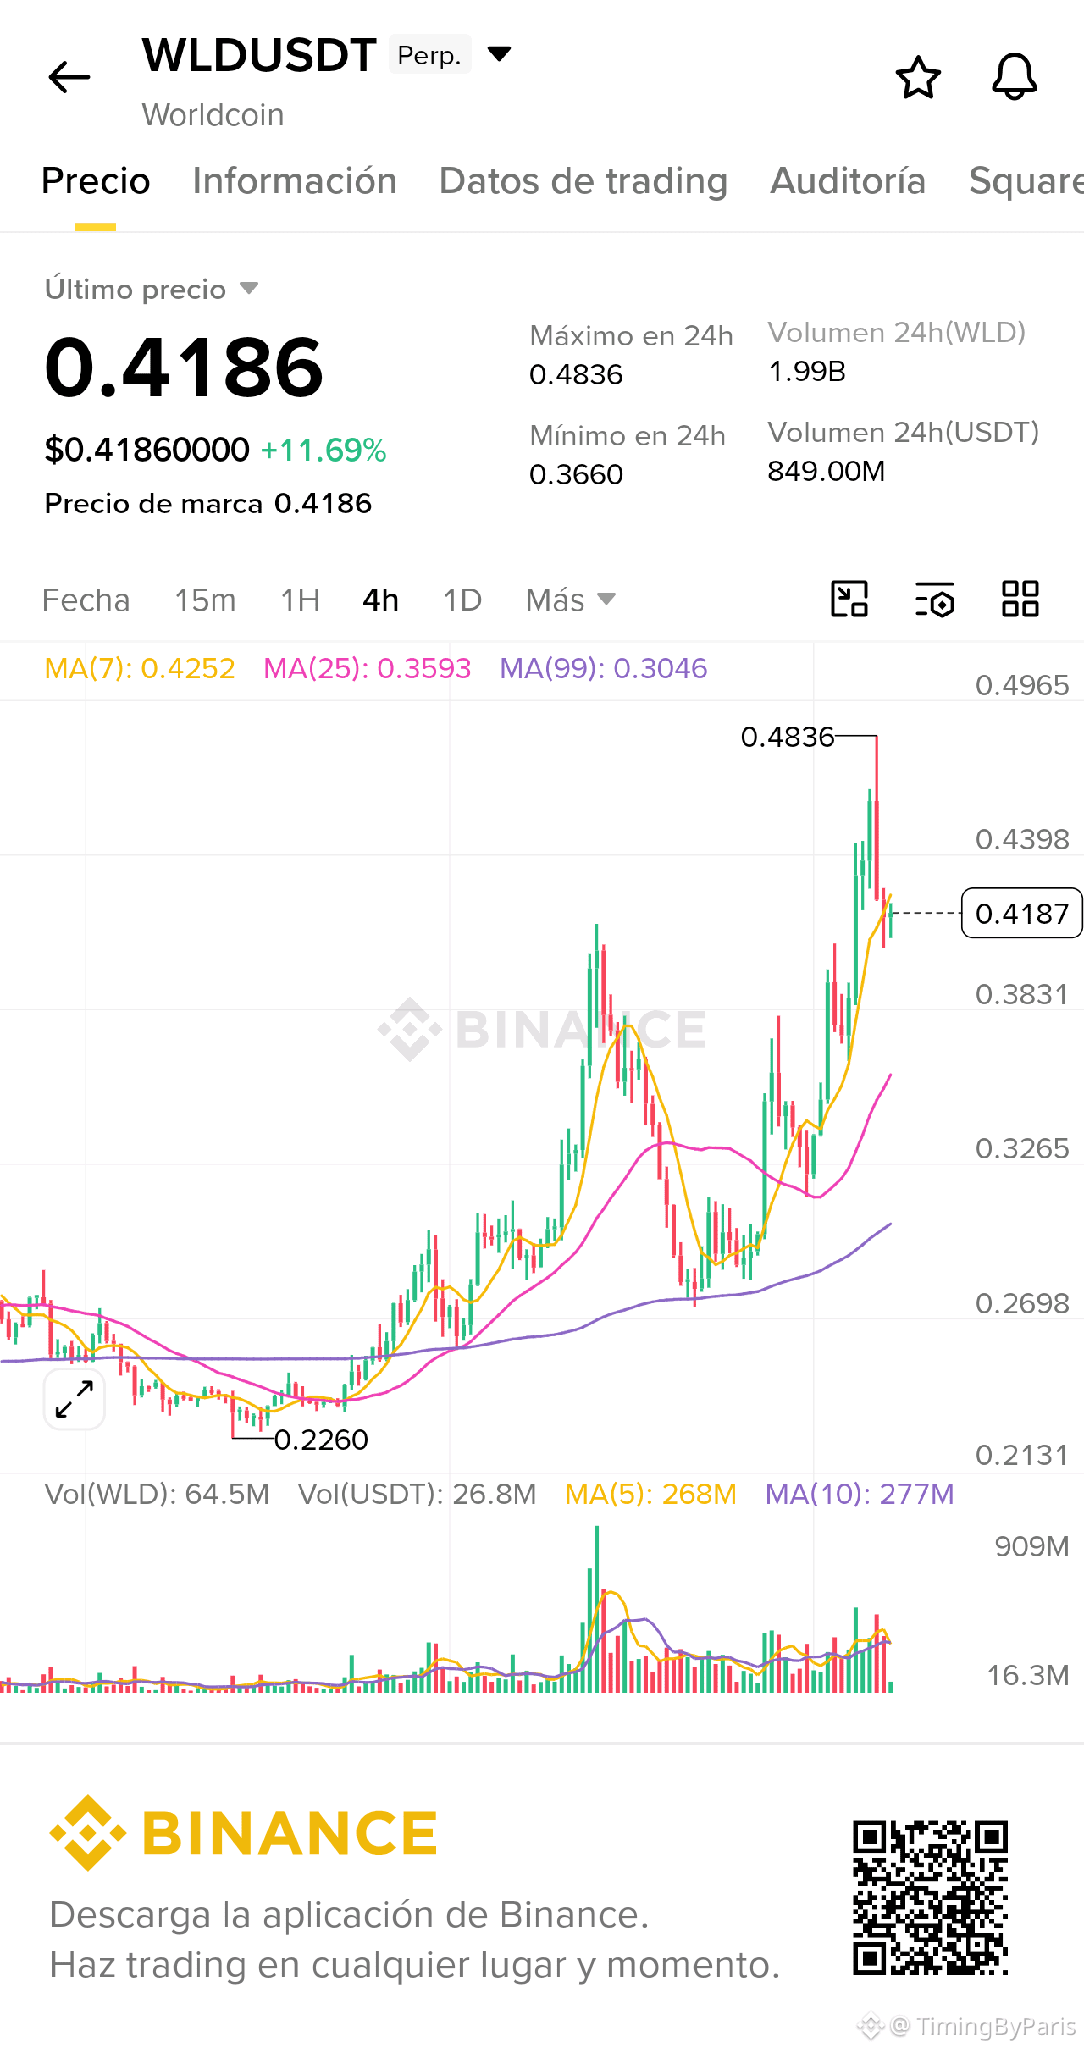
$WLD update. All targets hit.
✅ 0.3712
✅ 0.4144
✅ 0.4300
I'm still holding.
The 4H structure remains bullish and the daily chart indicates that if we see a pullback to 0.4144-0.3666, that's the zone where I expect buyers to defend the trend.
🎯 0.4833 if the momentum supports
🎯 0.5088 if it breaks highs with strength
Stop tightened. If it closes below 0.3666, I’ll change my stance.
Are you following it too? 🤝
$WLD
$WLD update. All targets hit.
✅ 0.3712
✅ 0.4144
✅ 0.4300
I'm still holding.
The 4H structure remains bullish and the daily chart indicates that if we see a pullback to 0.4144-0.3666, that's the zone where I expect buyers to defend the trend.
🎯 0.4833 if the momentum supports
🎯 0.5088 if it breaks highs with strength
Stop tightened. If it closes below 0.3666, I’ll change my stance.
Are you following it too? 🤝
$WLD
✅ 0.3712
✅ 0.4144
✅ 0.4300
I'm still holding.
The 4H structure remains bullish and the daily chart indicates that if we see a pullback to 0.4144-0.3666, that's the zone where I expect buyers to defend the trend.
🎯 0.4833 if the momentum supports
🎯 0.5088 if it breaks highs with strength
Stop tightened. If it closes below 0.3666, I’ll change my stance.
Are you following it too? 🤝
$WLD
2
6
1.1k
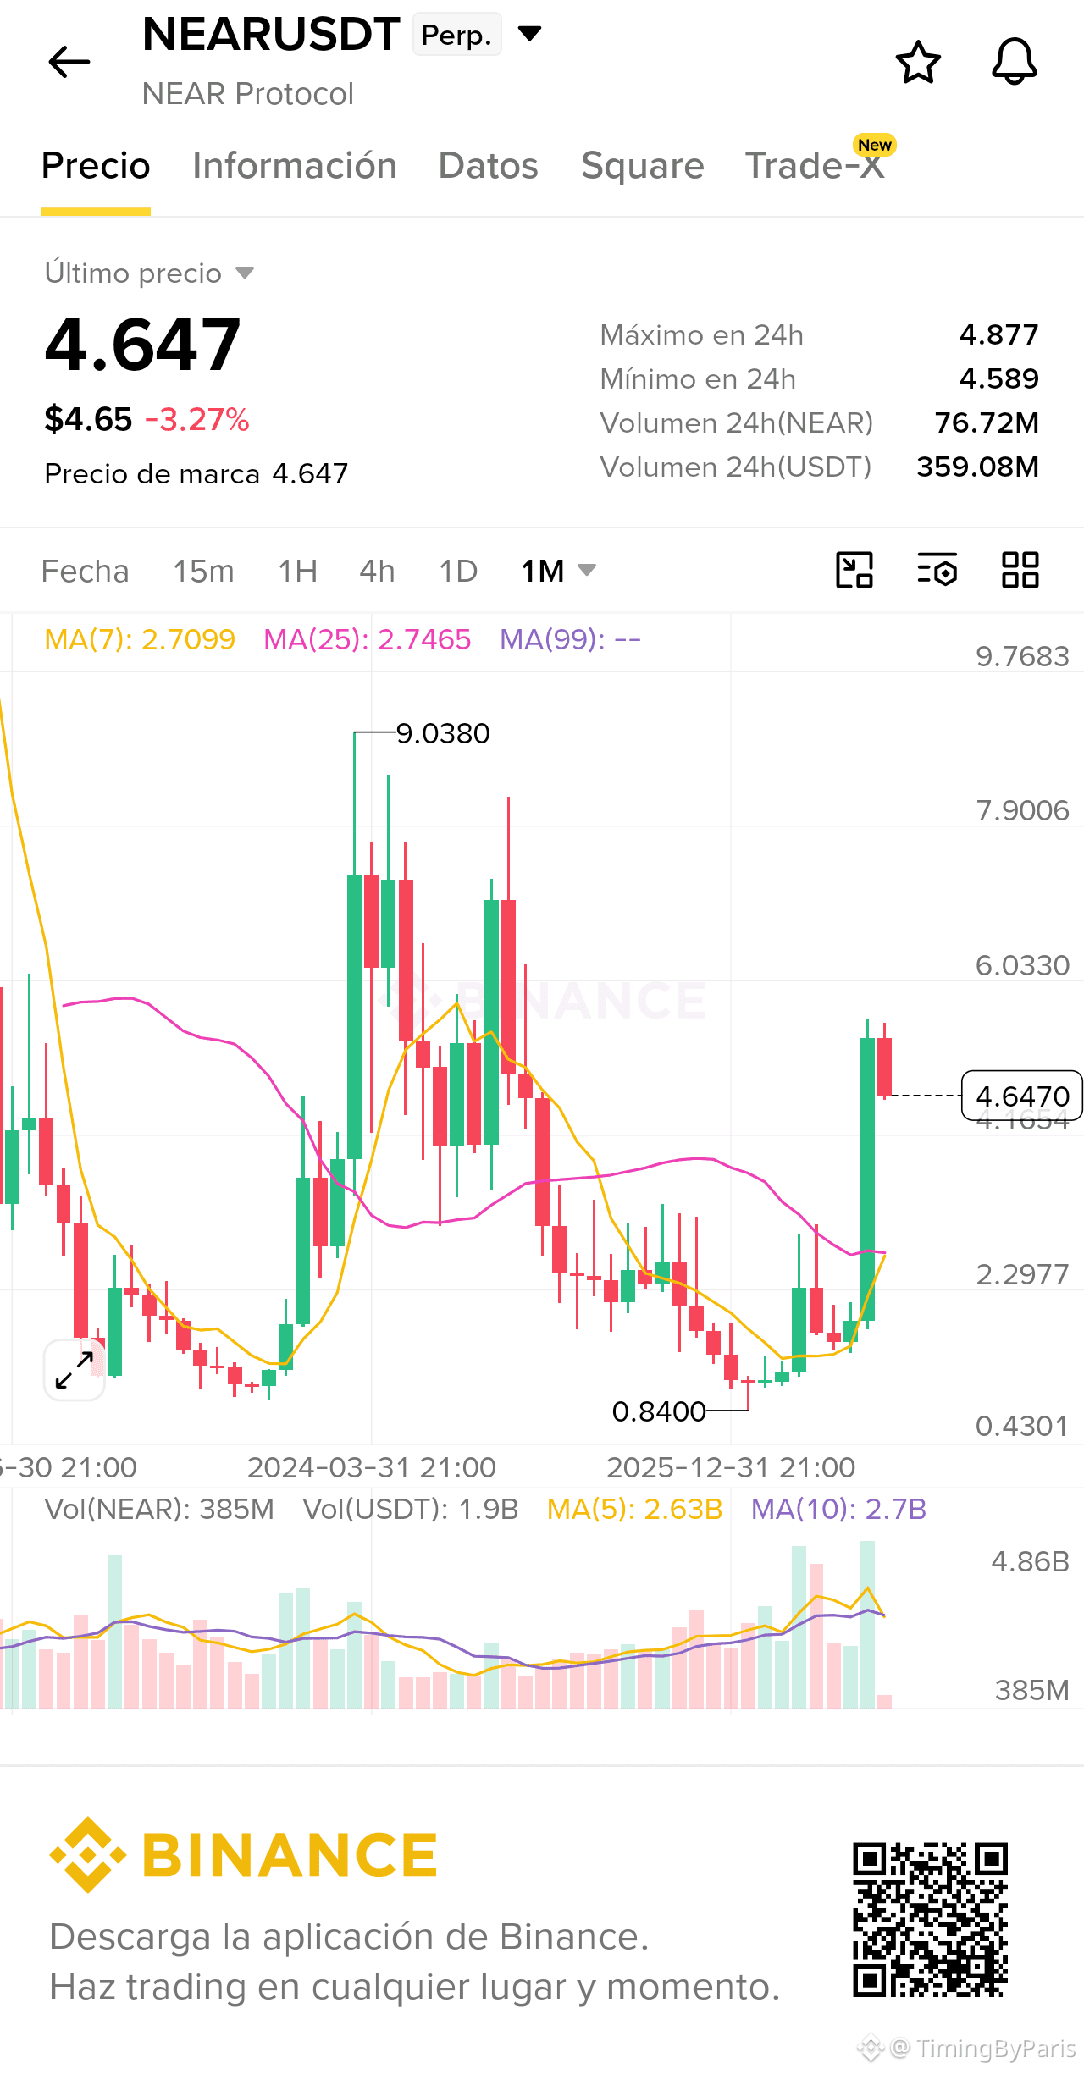
$NEAR has officially closed its monthly candle! 💥
{future}(NEARUSDT)
Multi-year trendline breakout completely confirmed.
6-year resistance turning into a macro support.
- +100% from the first setup, next bullish stage charging 🚀
Higher
$NEAR has officially closed its monthly candle! 💥
Multi-year trendline breakout completely confirmed.
6-year resistance turning into a macro support.
- +100% from the first setup, next bullish stage charging 🚀
Higher
Multi-year trendline breakout completely confirmed.
6-year resistance turning into a macro support.
- +100% from the first setup, next bullish stage charging 🚀
Higher
1.2k
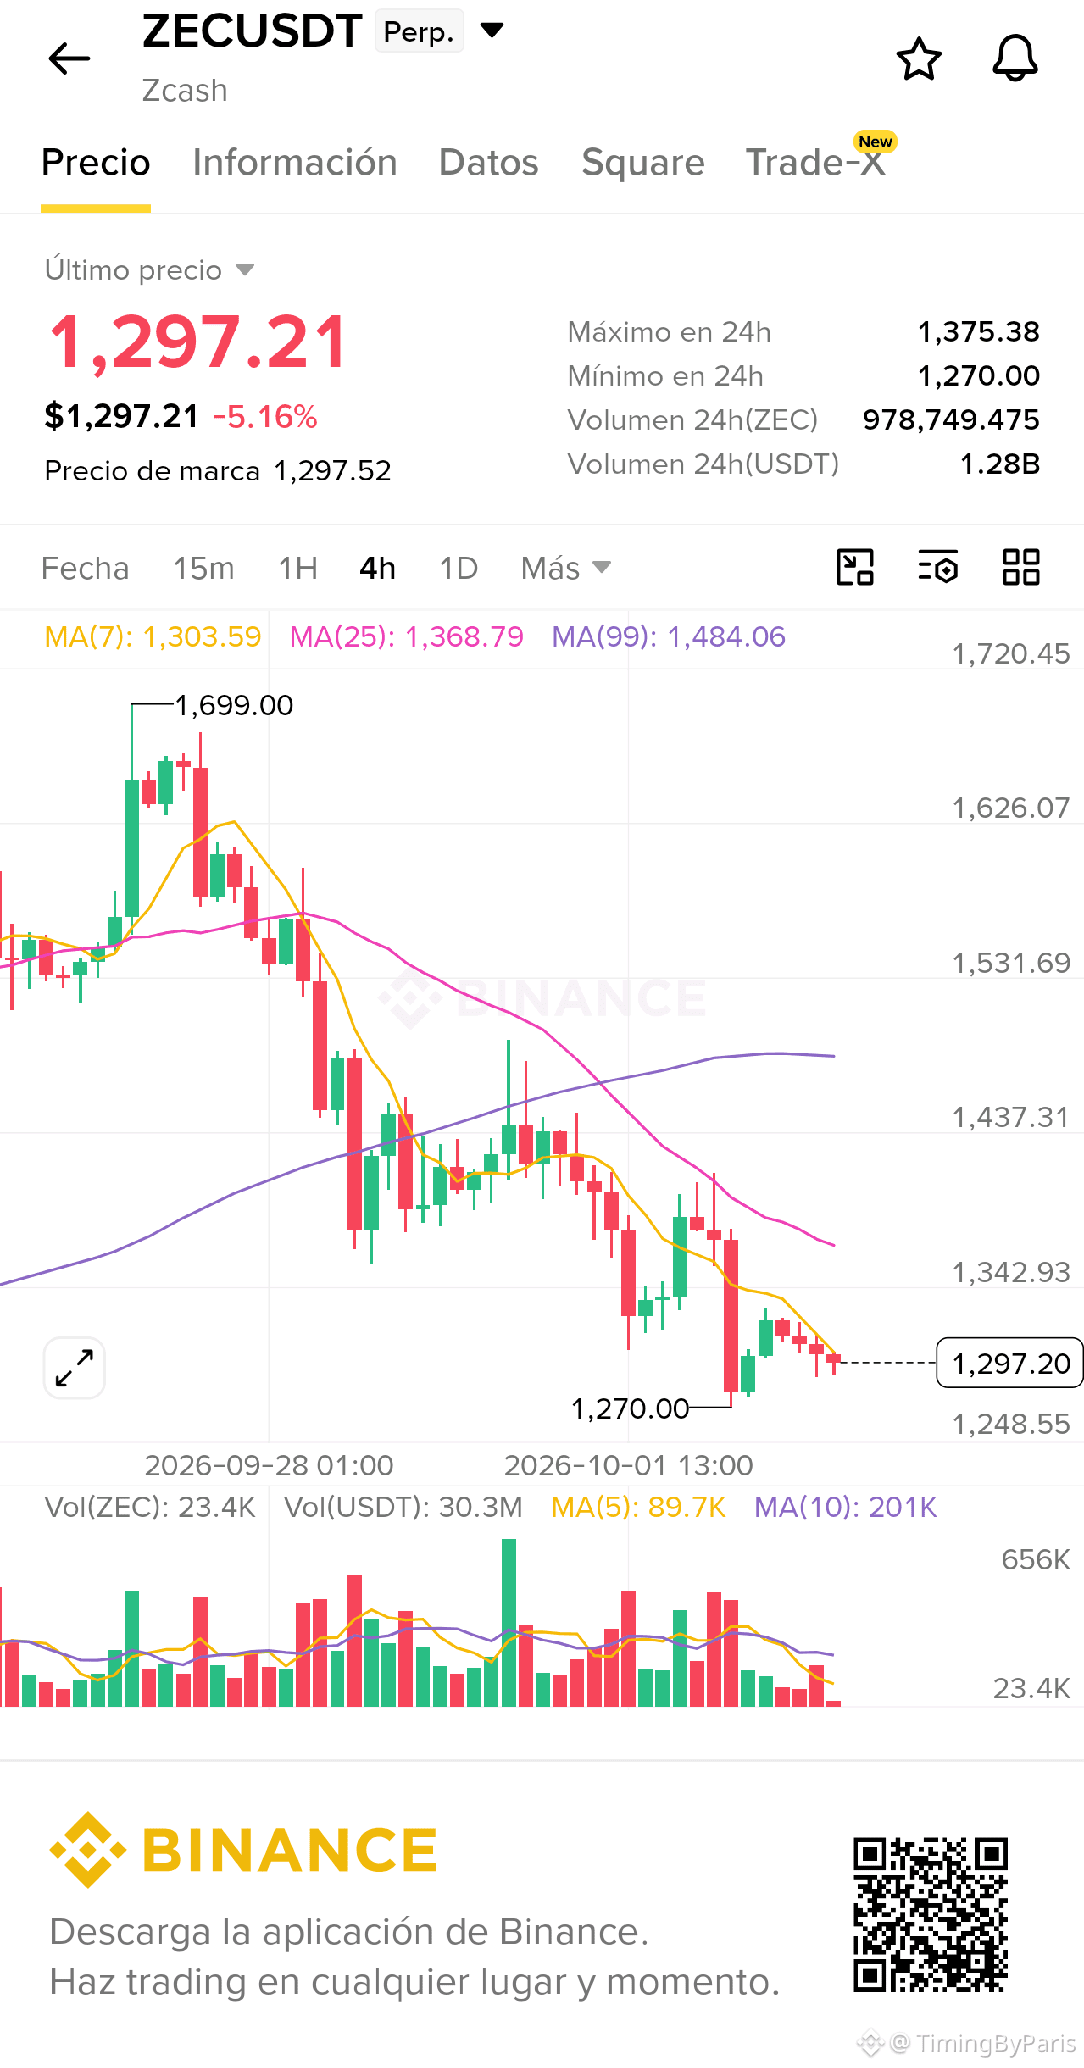
Look at everyone losing their mind if $ZEC dips below $1,000.
It went from $400 to $1,700 in a matter of weeks.
Apparently that part is perfectly reasonable. But take it back a little and suddenly everyone needs to rethink their entire thesis about it.
At $1,000, it would still be up 150% from $400.
But nobody will say a word about that.
They'll measure everything from $1,700 and talk about how much it's down.
We've seen it rally for weeks with very little reversal. A correction shouldn’t suddenly be an unimaginable event.
Look at everyone losing their mind if $ZEC dips below $1,000.
It went from $400 to $1,700 in a matter of weeks.
Apparently that part is perfectly reasonable. But take it back a little and suddenly everyone needs to rethink their entire thesis about it.
At $1,000, it would still be up 150% from $400.
But nobody will say a word about that.
They'll measure everything from $1,700 and talk about how much it's down.
We've seen it rally for weeks with very little reversal. A correction shouldn’t suddenly be an unimaginable event.
It went from $400 to $1,700 in a matter of weeks.
Apparently that part is perfectly reasonable. But take it back a little and suddenly everyone needs to rethink their entire thesis about it.
At $1,000, it would still be up 150% from $400.
But nobody will say a word about that.
They'll measure everything from $1,700 and talk about how much it's down.
We've seen it rally for weeks with very little reversal. A correction shouldn’t suddenly be an unimaginable event.
8
2.6k
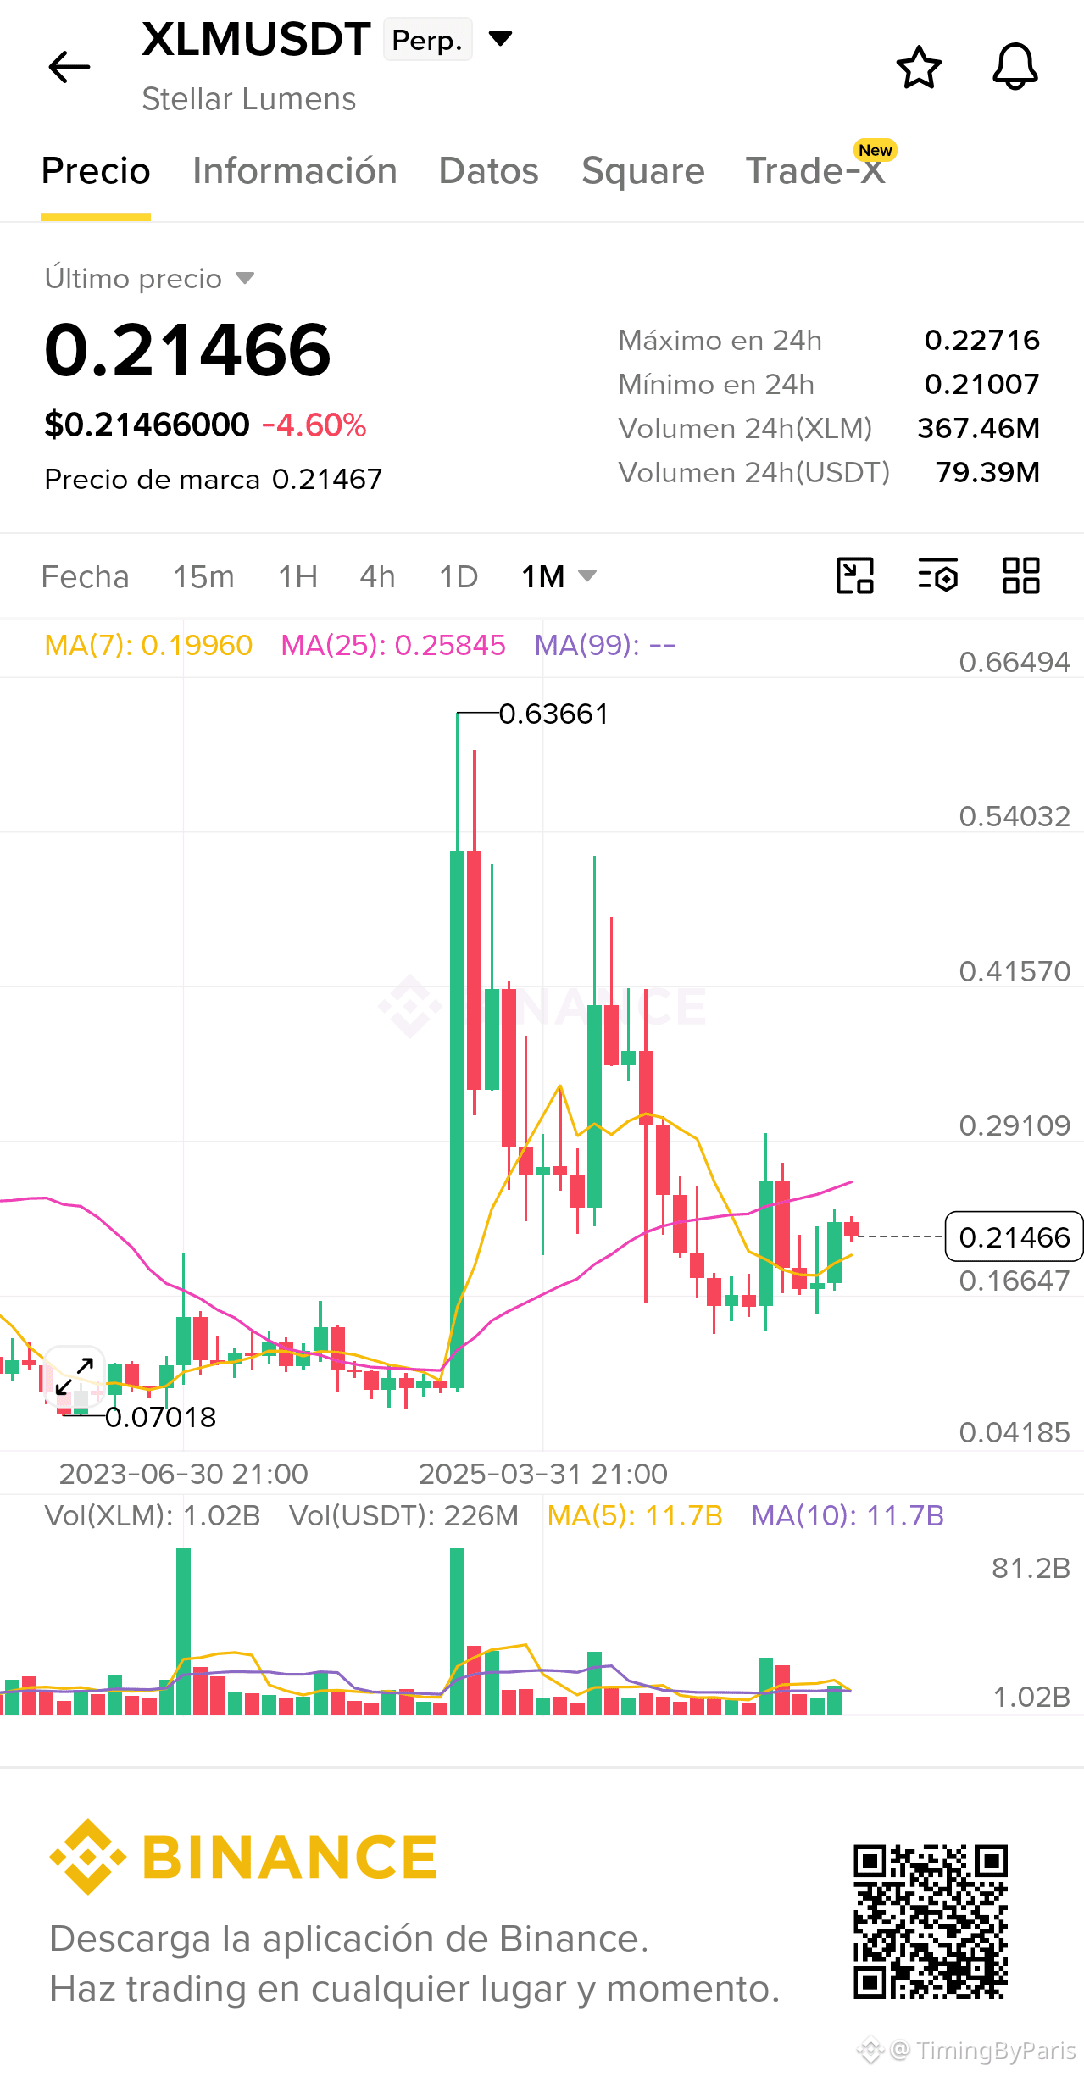
$XLM 1M
{future}(XLMUSDT)
Probably one of the coins we gave the most bullish signals there is.
Stellar Native has been trading within this enormous Ascending Triangle for exactly 9 YEARS.
Price target: Much, much higher 🚀
$XLM 1M
Probably one of the coins we gave the most bullish signals there is.
Stellar Native has been trading within this enormous Ascending Triangle for exactly 9 YEARS.
Price target: Much, much higher 🚀
Probably one of the coins we gave the most bullish signals there is.
Stellar Native has been trading within this enormous Ascending Triangle for exactly 9 YEARS.
Price target: Much, much higher 🚀
1
531
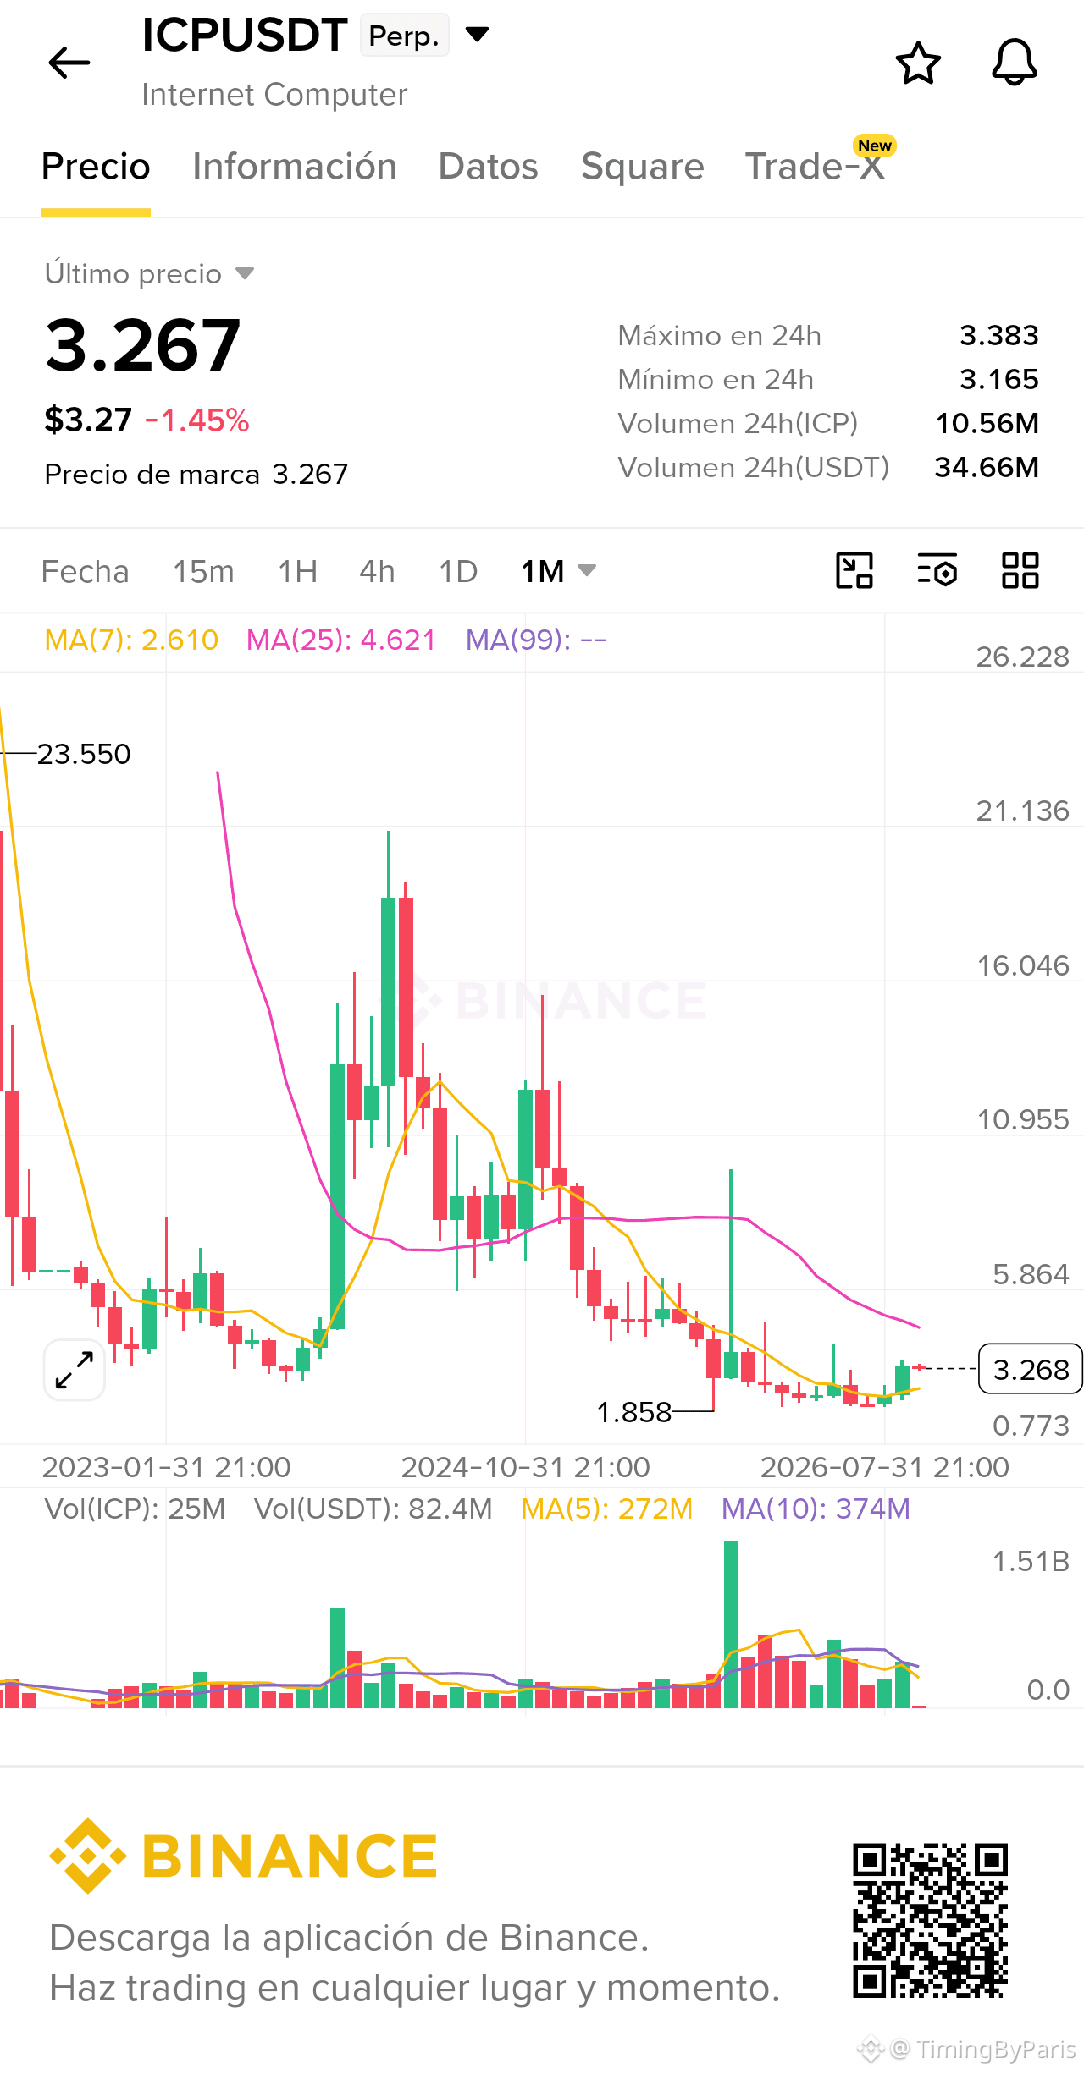
$ICP 1M
{future}(ICPUSDT)
ICP has never experienced a true bullish altcoin rally, but this cycle could finally be its moment to shine.
A massive descending wedge in formation since 2021 is approaching a macro breakout
The monthly STOCH RSI is crossing back above 20 for the first time since 2023
$ICP 1M
ICP has never experienced a true bullish altcoin rally, but this cycle could finally be its moment to shine.
A massive descending wedge in formation since 2021 is approaching a macro breakout
The monthly STOCH RSI is crossing back above 20 for the first time since 2023
ICP has never experienced a true bullish altcoin rally, but this cycle could finally be its moment to shine.
A massive descending wedge in formation since 2021 is approaching a macro breakout
The monthly STOCH RSI is crossing back above 20 for the first time since 2023
1
1
299
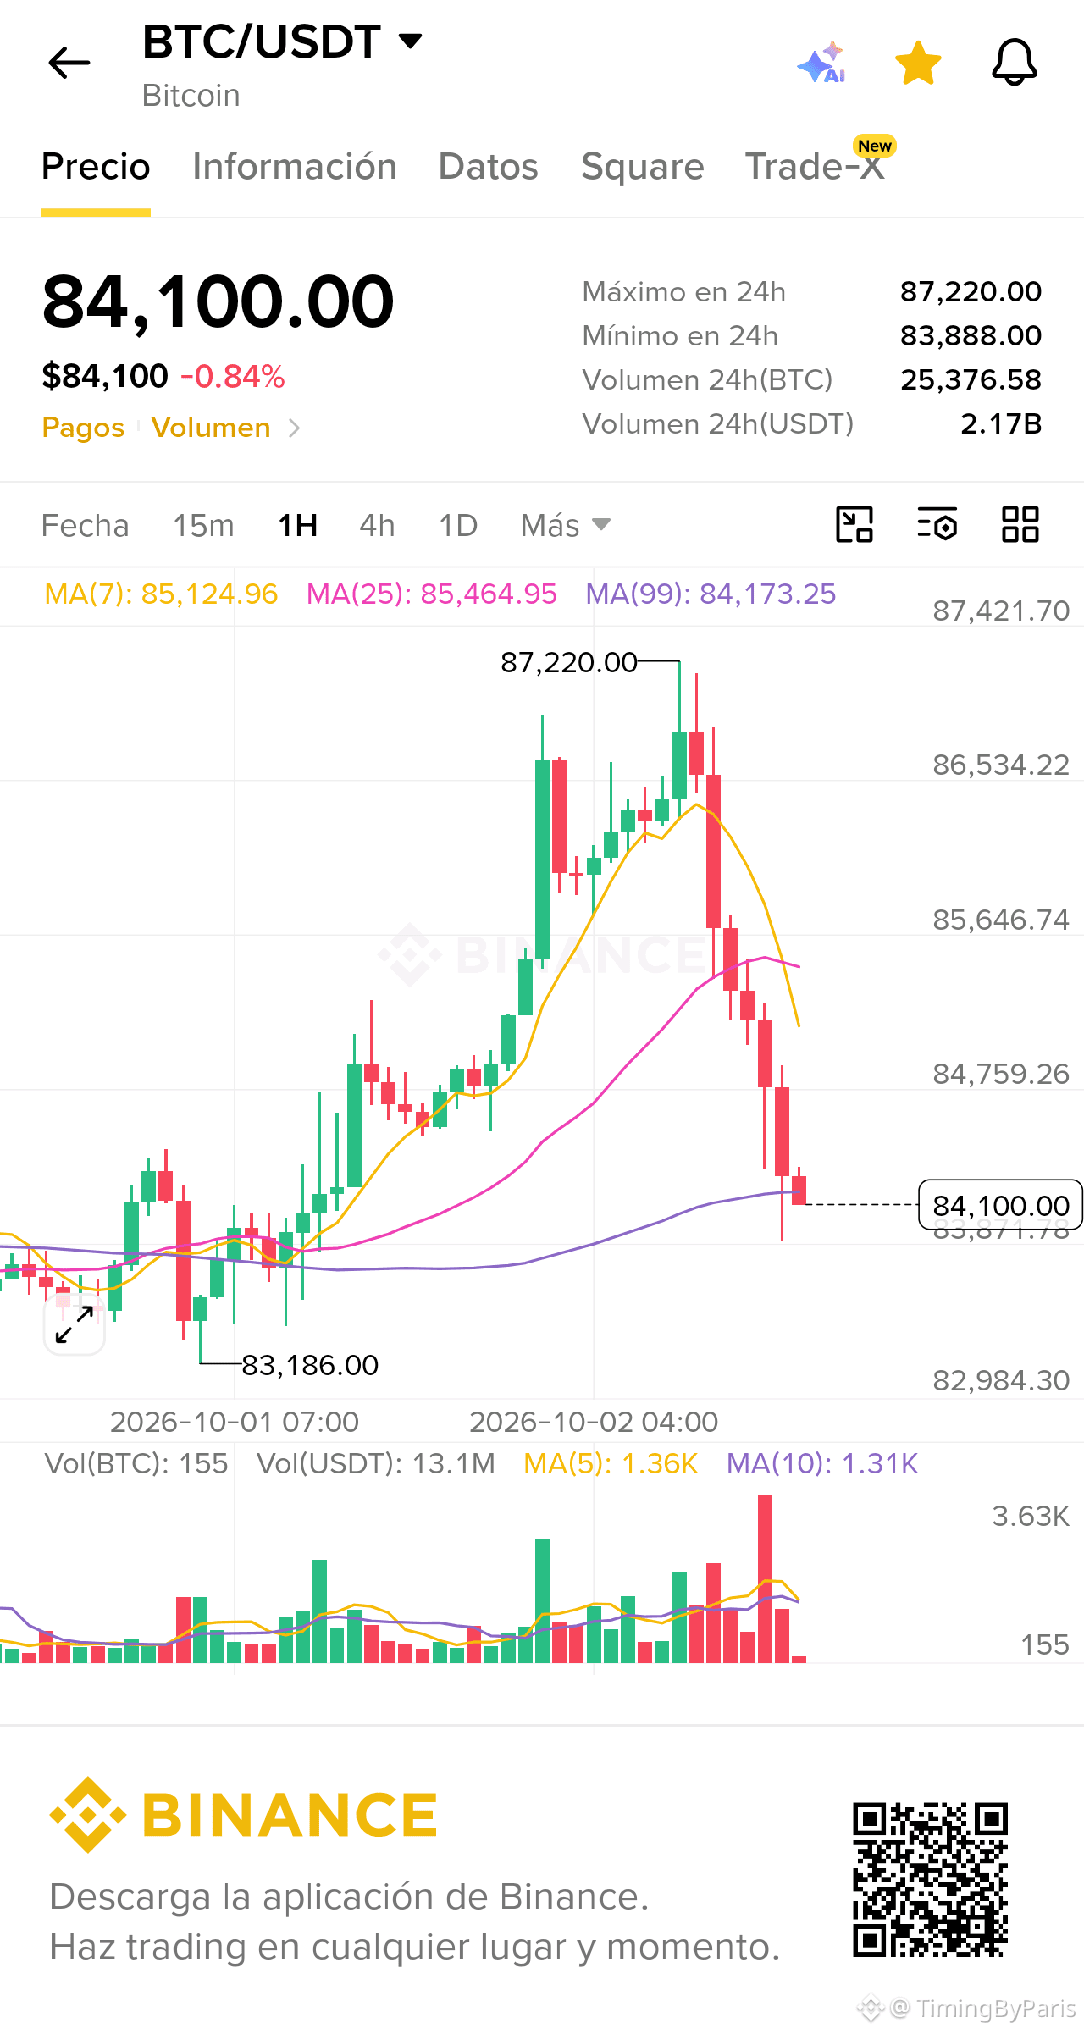
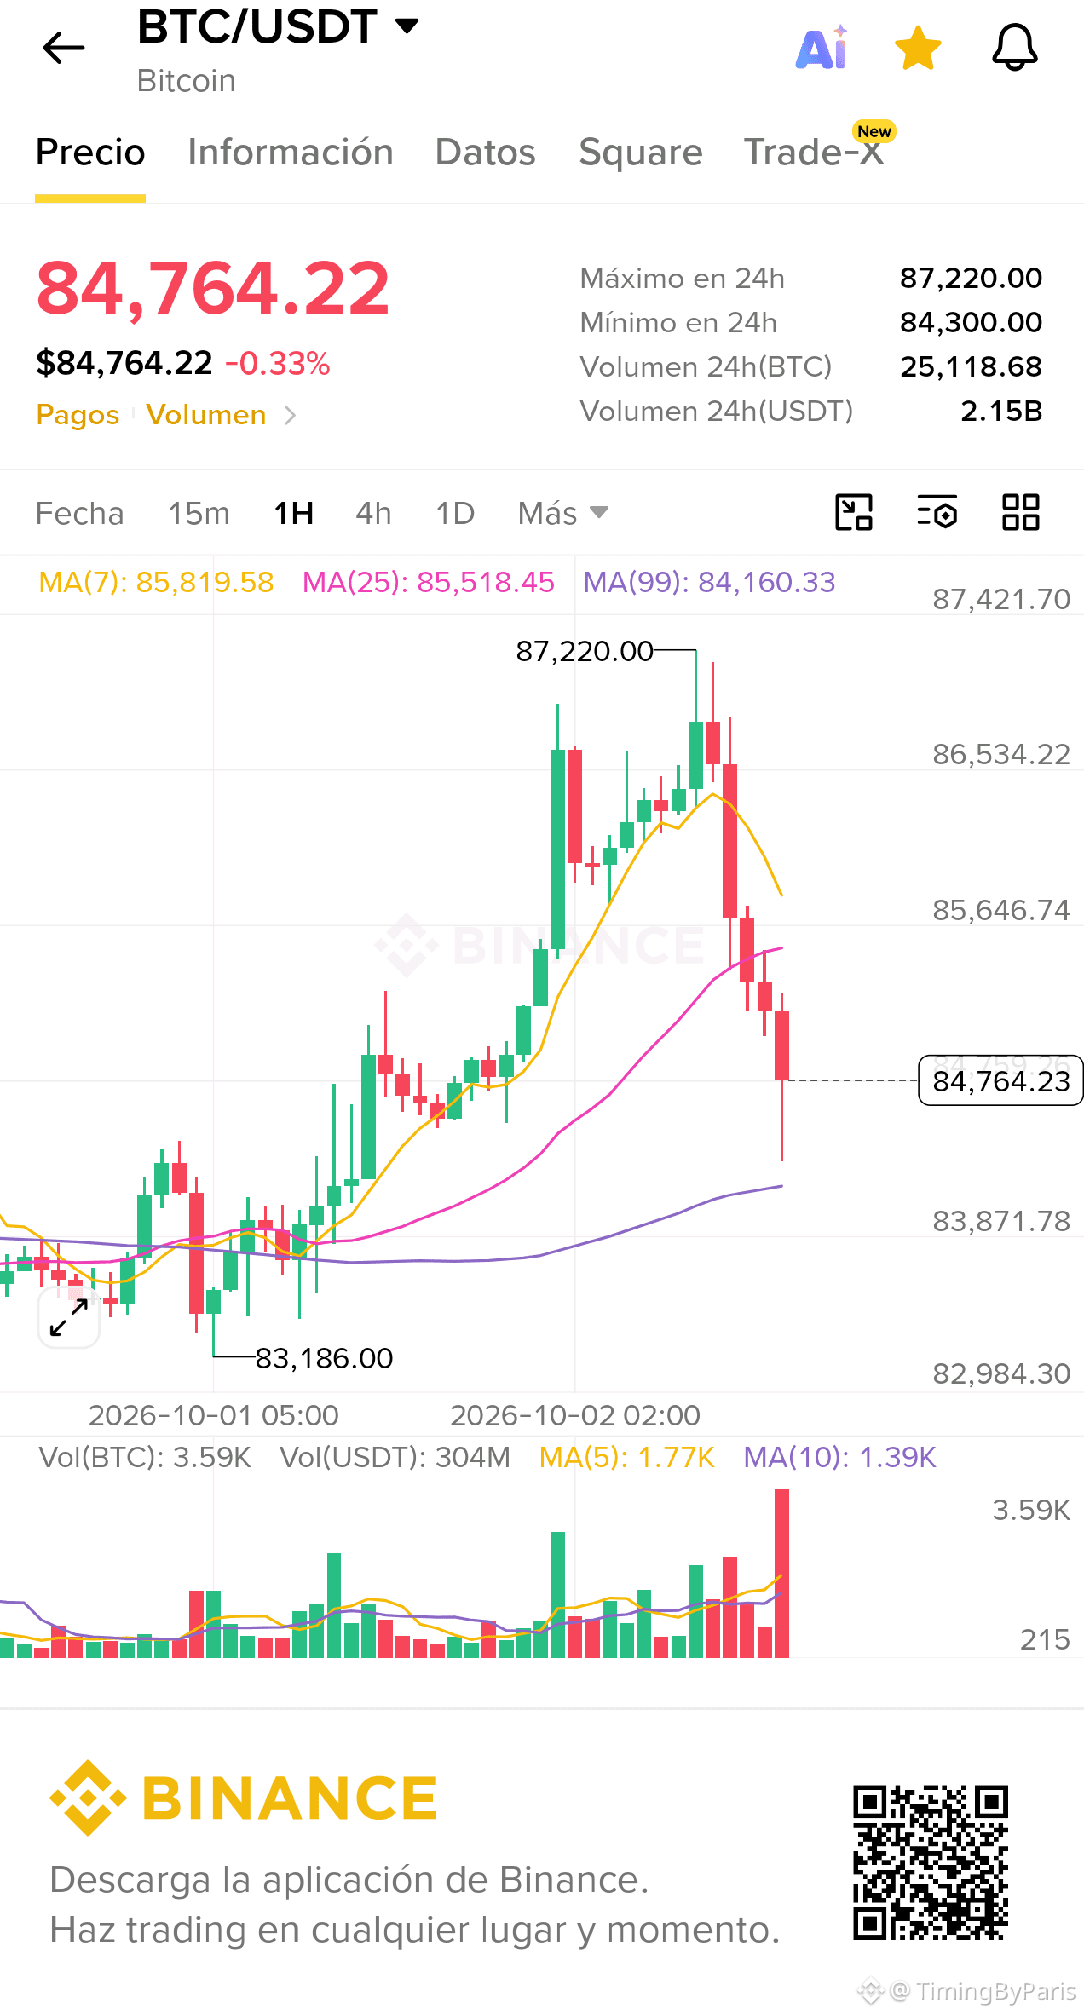
Taking the highs at $BTC means very little if we lose $85K immediately afterward.
Why?
Think about the trapped position we’ve just created with this move.
Fresh longs chased the pump up to the top of the range.
If we now lose the breakout pivot of the mid-zone as support, those buyers get trapped and have a reason to exit, adding selling pressure as we move back down toward the lows.
Therefore, $85K needs to hold so we can see a continuation above $87K.
We simply have more negative positioning above us than before.
Below $85K, I’d expect us to hunt liquidity around $83.5K toward the lower trendline.
We can still work with that, as long as we hold support and spend some time in range to allow liquidity to build on the buy-side for another attempt to the upside.
But if we lose the lower support too, then all this move will have done is trap another round of longs.
At that point, we’ll be looking for a move back below $80K.
Taking the highs at $BTC means very little if we lose $85K immediately afterward.
Why?
Think about the trapped position we’ve just created with this move.
Fresh longs chased the pump up to the top of the range.
If we now lose the breakout pivot of the mid-zone as support, those buyers get trapped and have a reason to exit, adding selling pressure as we move back down toward the lows.
Therefore, $85K needs to hold so we can see a continuation above $87K.
We simply have more negative positioning above us than before.
Below $85K, I’d expect us to hunt liquidity around $83.5K toward the lower trendline.
We can still work with that, as long as we hold support and spend some time in range to allow liquidity to build on the buy-side for another attempt to the upside.
But if we lose the lower support too, then all this move will have done is trap another round of longs.
At that point, we’ll be looking for a move back below $80K.
Why?
Think about the trapped position we’ve just created with this move.
Fresh longs chased the pump up to the top of the range.
If we now lose the breakout pivot of the mid-zone as support, those buyers get trapped and have a reason to exit, adding selling pressure as we move back down toward the lows.
Therefore, $85K needs to hold so we can see a continuation above $87K.
We simply have more negative positioning above us than before.
Below $85K, I’d expect us to hunt liquidity around $83.5K toward the lower trendline.
We can still work with that, as long as we hold support and spend some time in range to allow liquidity to build on the buy-side for another attempt to the upside.
But if we lose the lower support too, then all this move will have done is trap another round of longs.
At that point, we’ll be looking for a move back below $80K.
1
4.4k
$BTC
{future}(BTCUSDT)
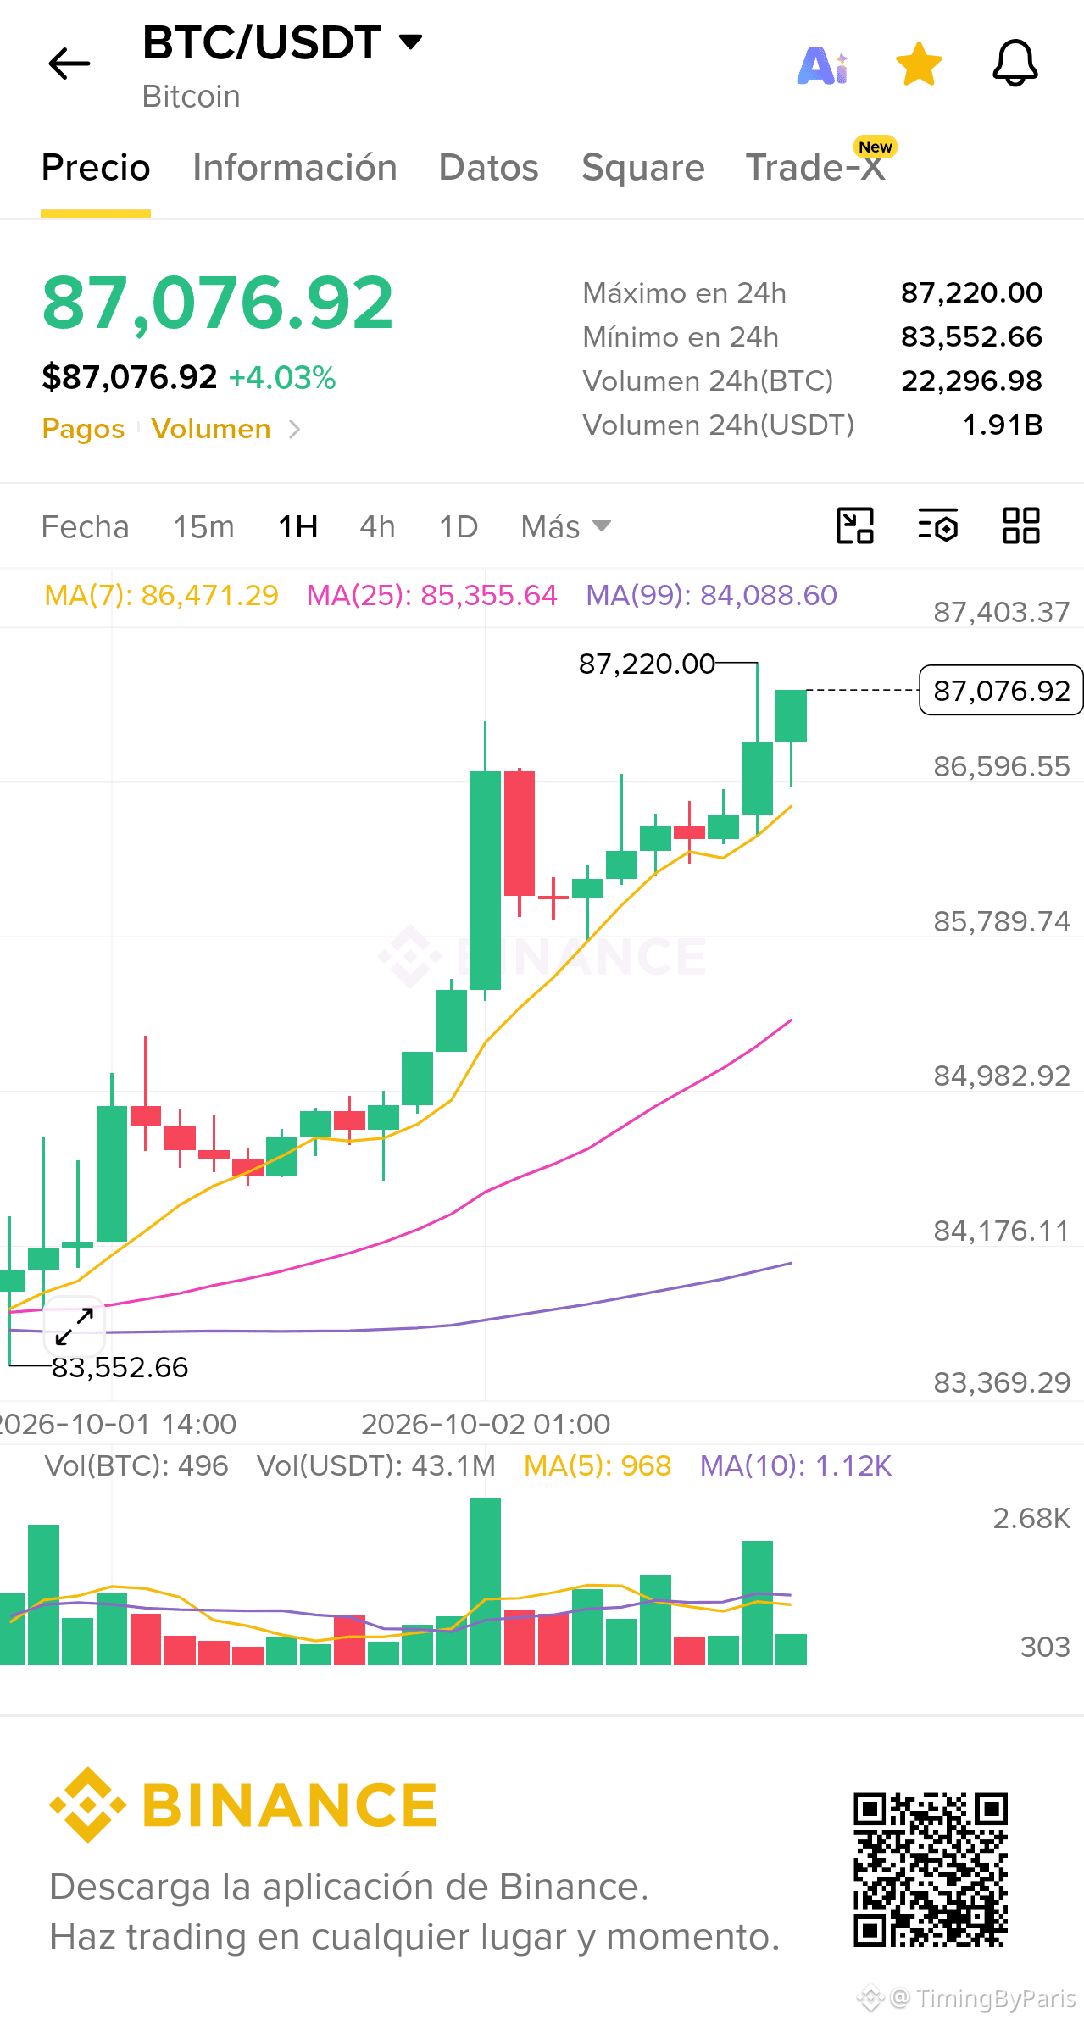
Long trigger of $85.2K. ✅
First target of $87K reached. ✅
Exactly as explained.
Absolutely fucking by the book.
$BTC
Long trigger of $85.2K. ✅
First target of $87K reached. ✅
Exactly as explained.
Absolutely fucking by the book.
Long trigger of $85.2K. ✅
First target of $87K reached. ✅
Exactly as explained.
Absolutely fucking by the book.
4
1.2k
4
687
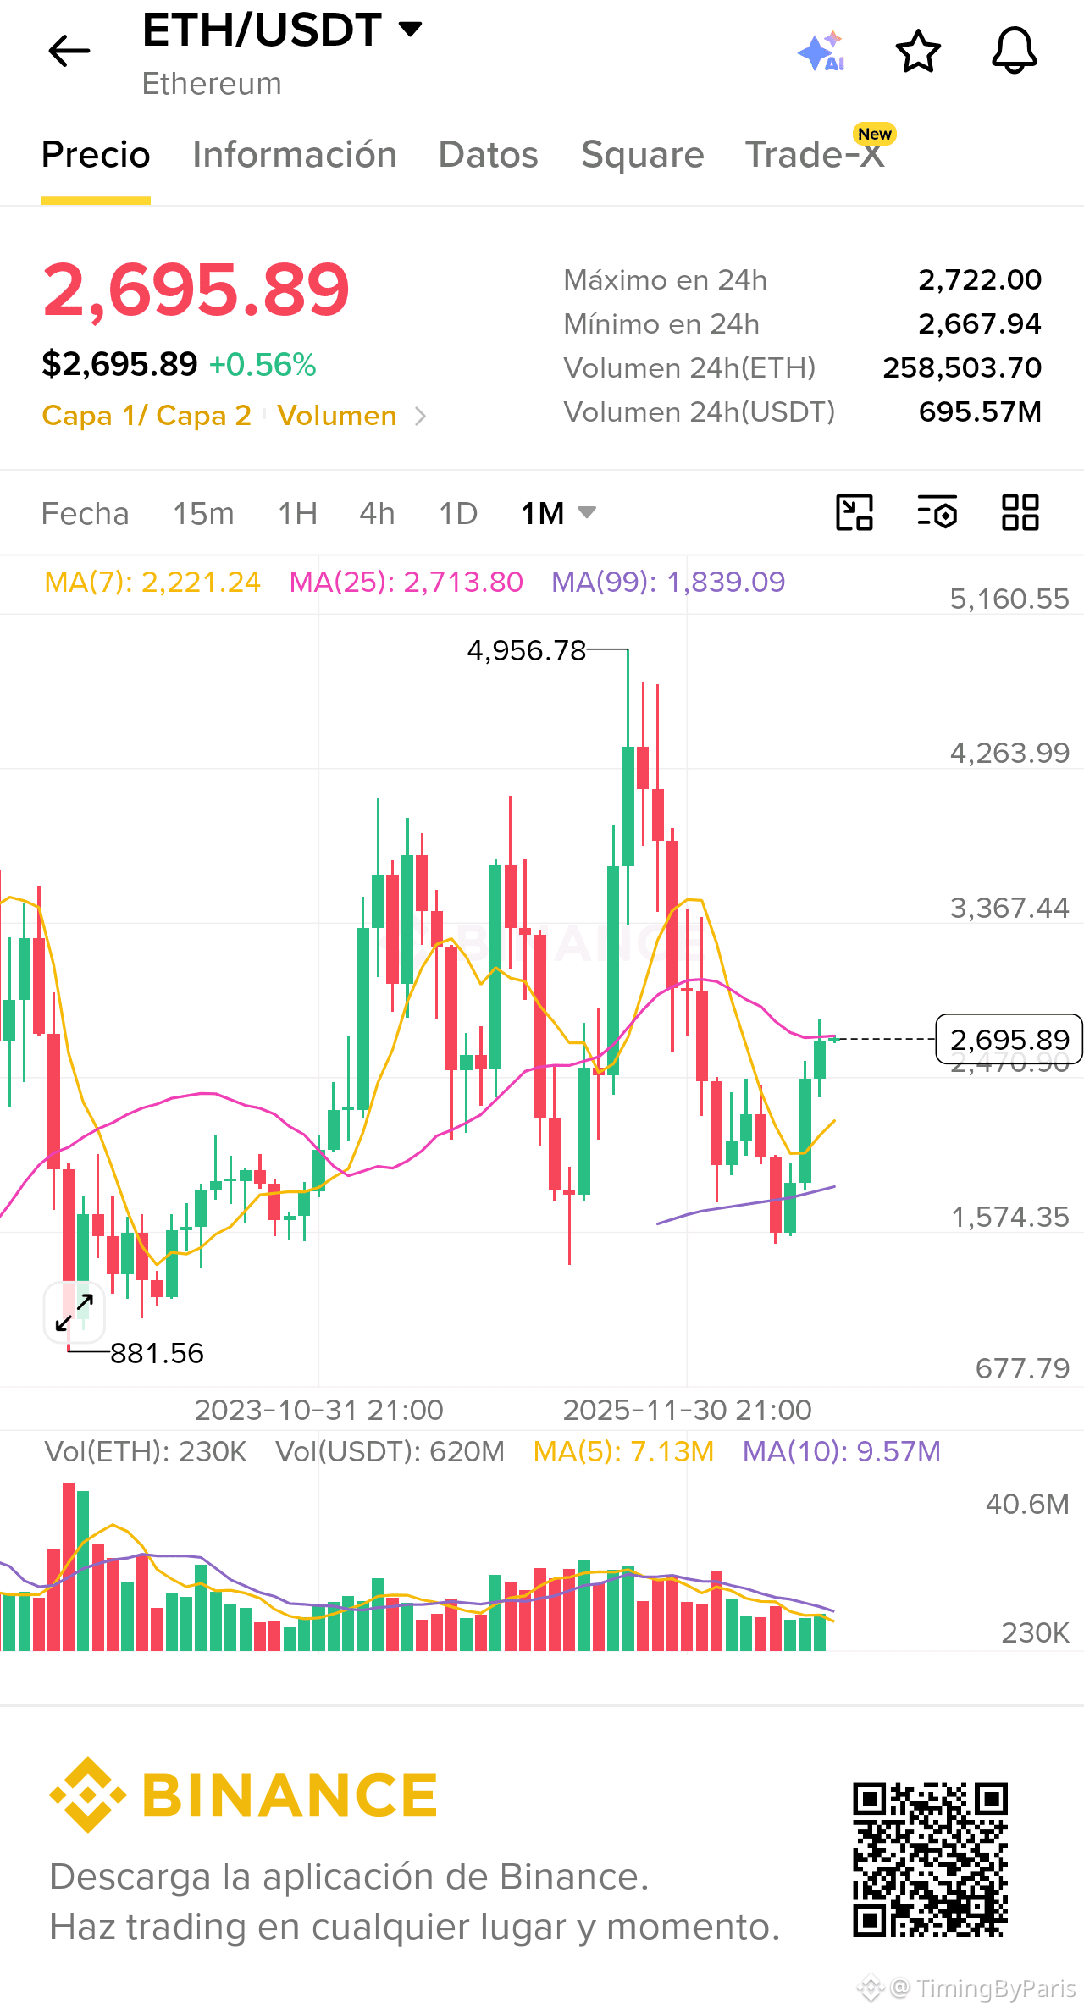
Learn how the average trader thinks about $ETH.
Most people don’t want to touch it because it failed to break upward in the previous cycle.
That’s exactly why I wanted to accumulate it throughout the bear market.
All you need to do is look at what happened after the failed breakout.
Another higher low within the same ascending triangle it has been forming for five years.
As long as that higher low held, it was simply time to accumulate.
$ETH
{future}(ETHUSDT)
Learn how the average trader thinks about $ETH .
Most people don’t want to touch it because it failed to break upward in the previous cycle.
That’s exactly why I wanted to accumulate it throughout the bear market.
All you need to do is look at what happened after the failed breakout.
Another higher low within the same ascending triangle it has been forming for five years.
As long as that higher low held, it was simply time to accumulate.
$ETH
Most people don’t want to touch it because it failed to break upward in the previous cycle.
That’s exactly why I wanted to accumulate it throughout the bear market.
All you need to do is look at what happened after the failed breakout.
Another higher low within the same ascending triangle it has been forming for five years.
As long as that higher low held, it was simply time to accumulate.
$ETH
482
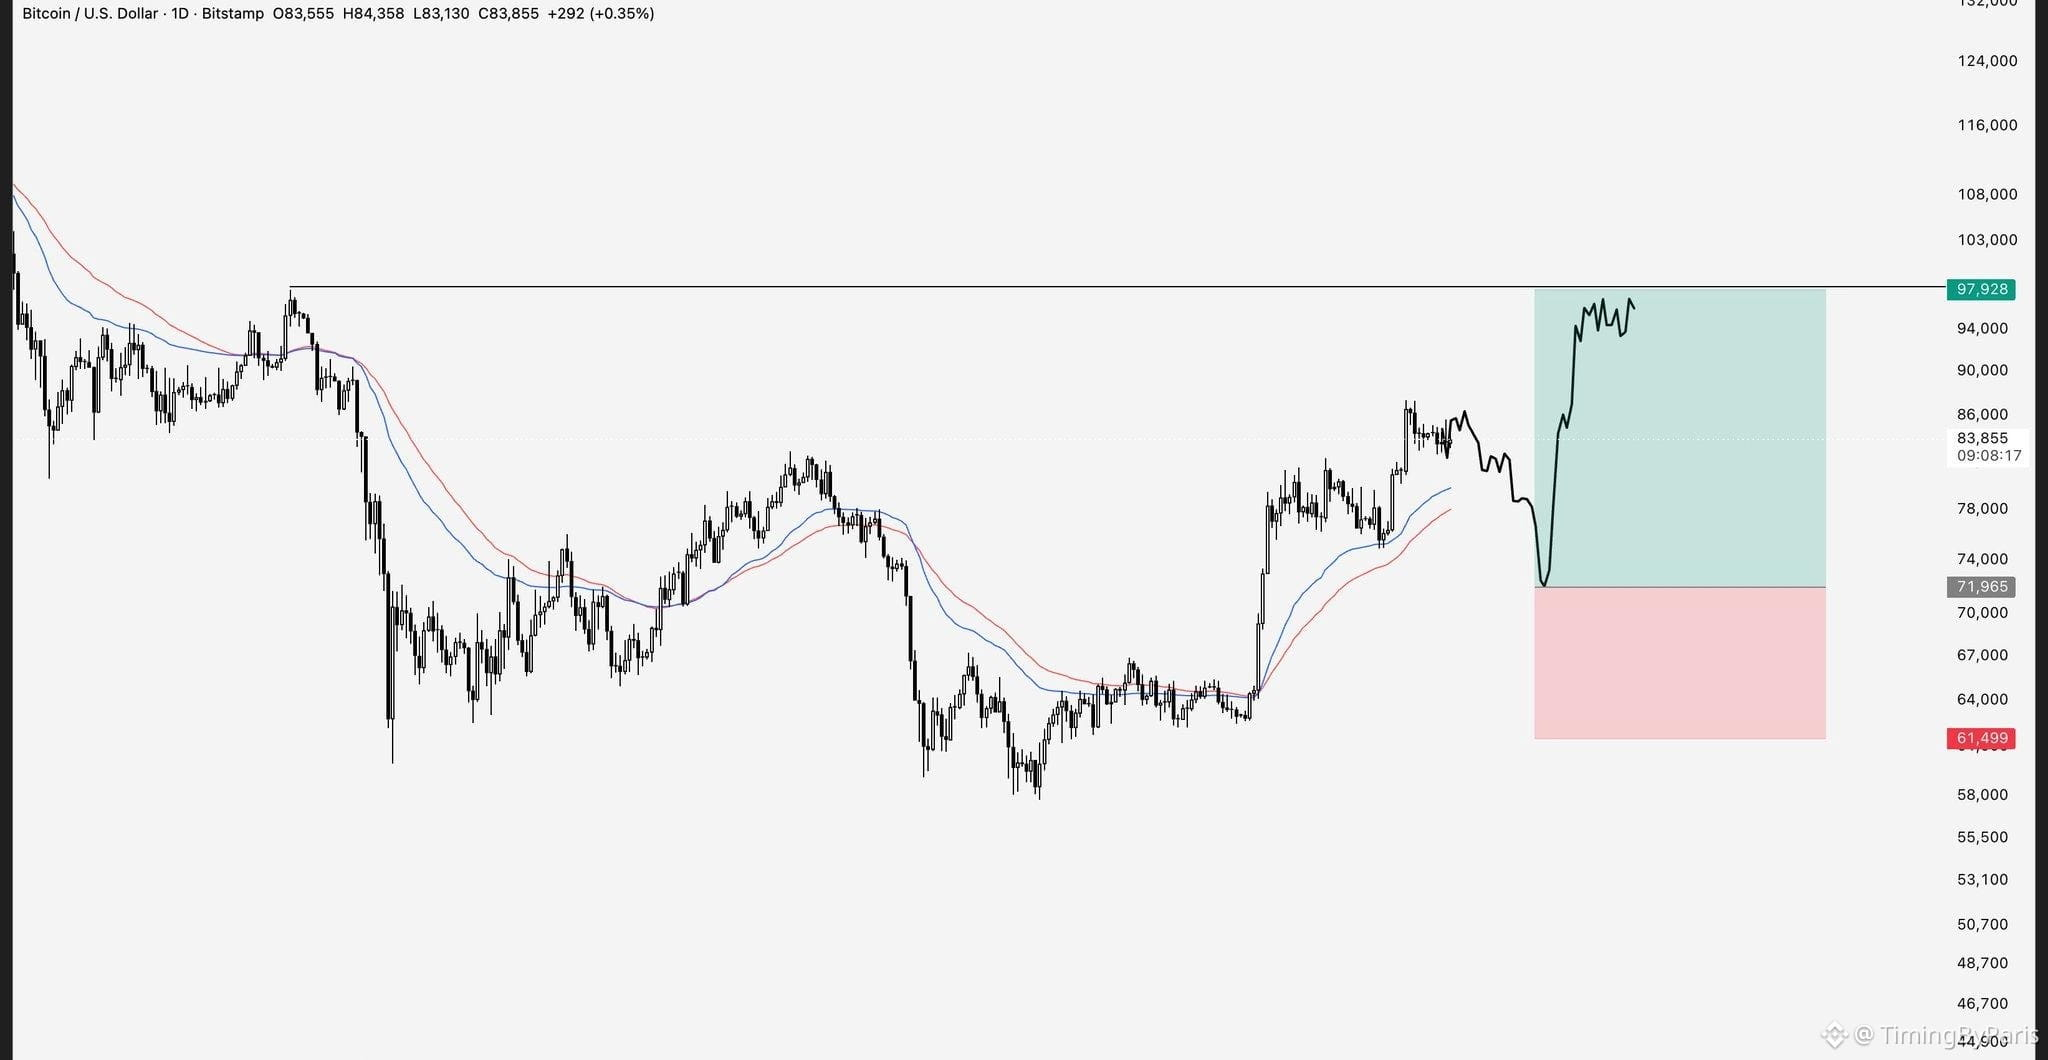
This should be obvious.
But if $BTC gives us a deeper wash below the $76K oscillation pivot, you simply bid at the maximum.
This should be obvious.
But if $BTC gives us a deeper wash below the $76K oscillation pivot, you simply bid at the maximum.
But if $BTC gives us a deeper wash below the $76K oscillation pivot, you simply bid at the maximum.
4
2.9k
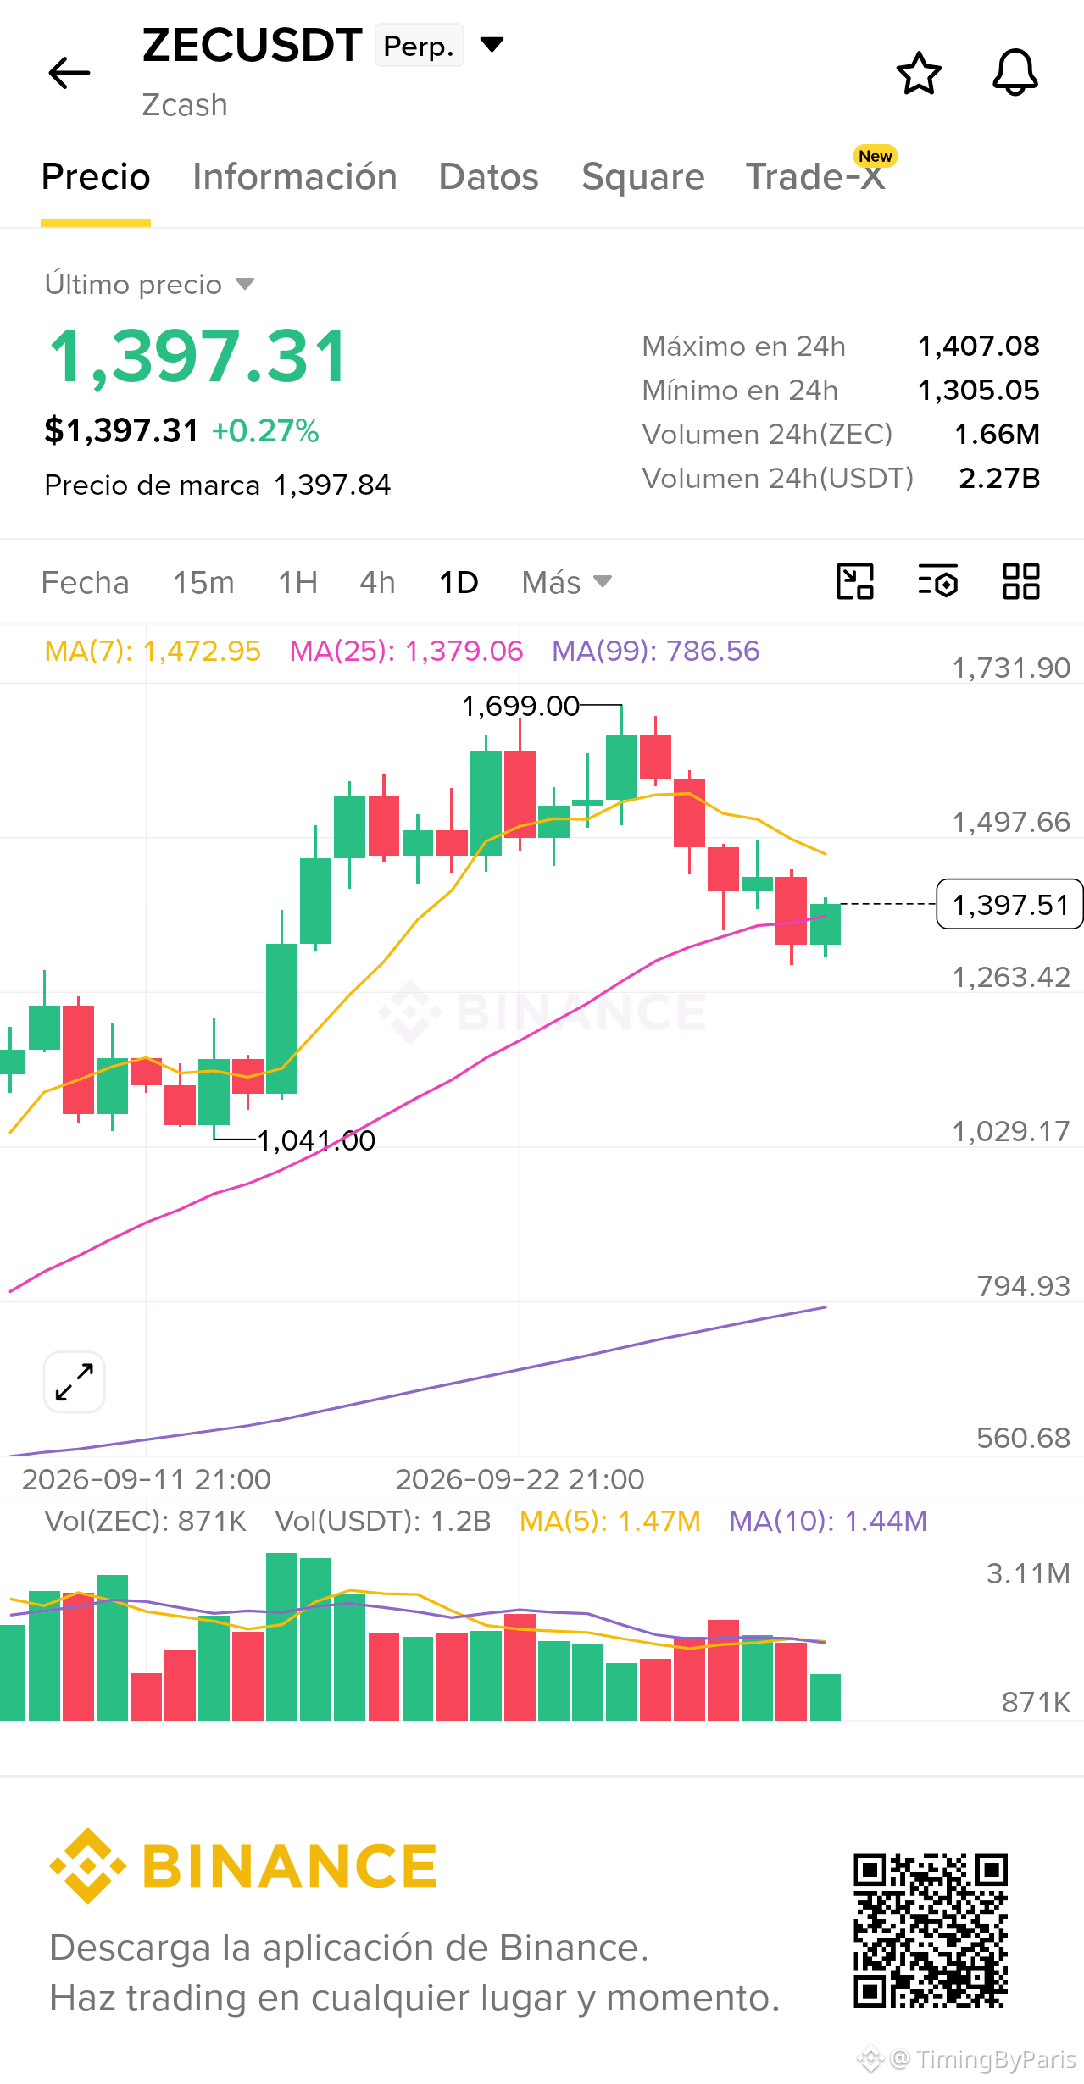
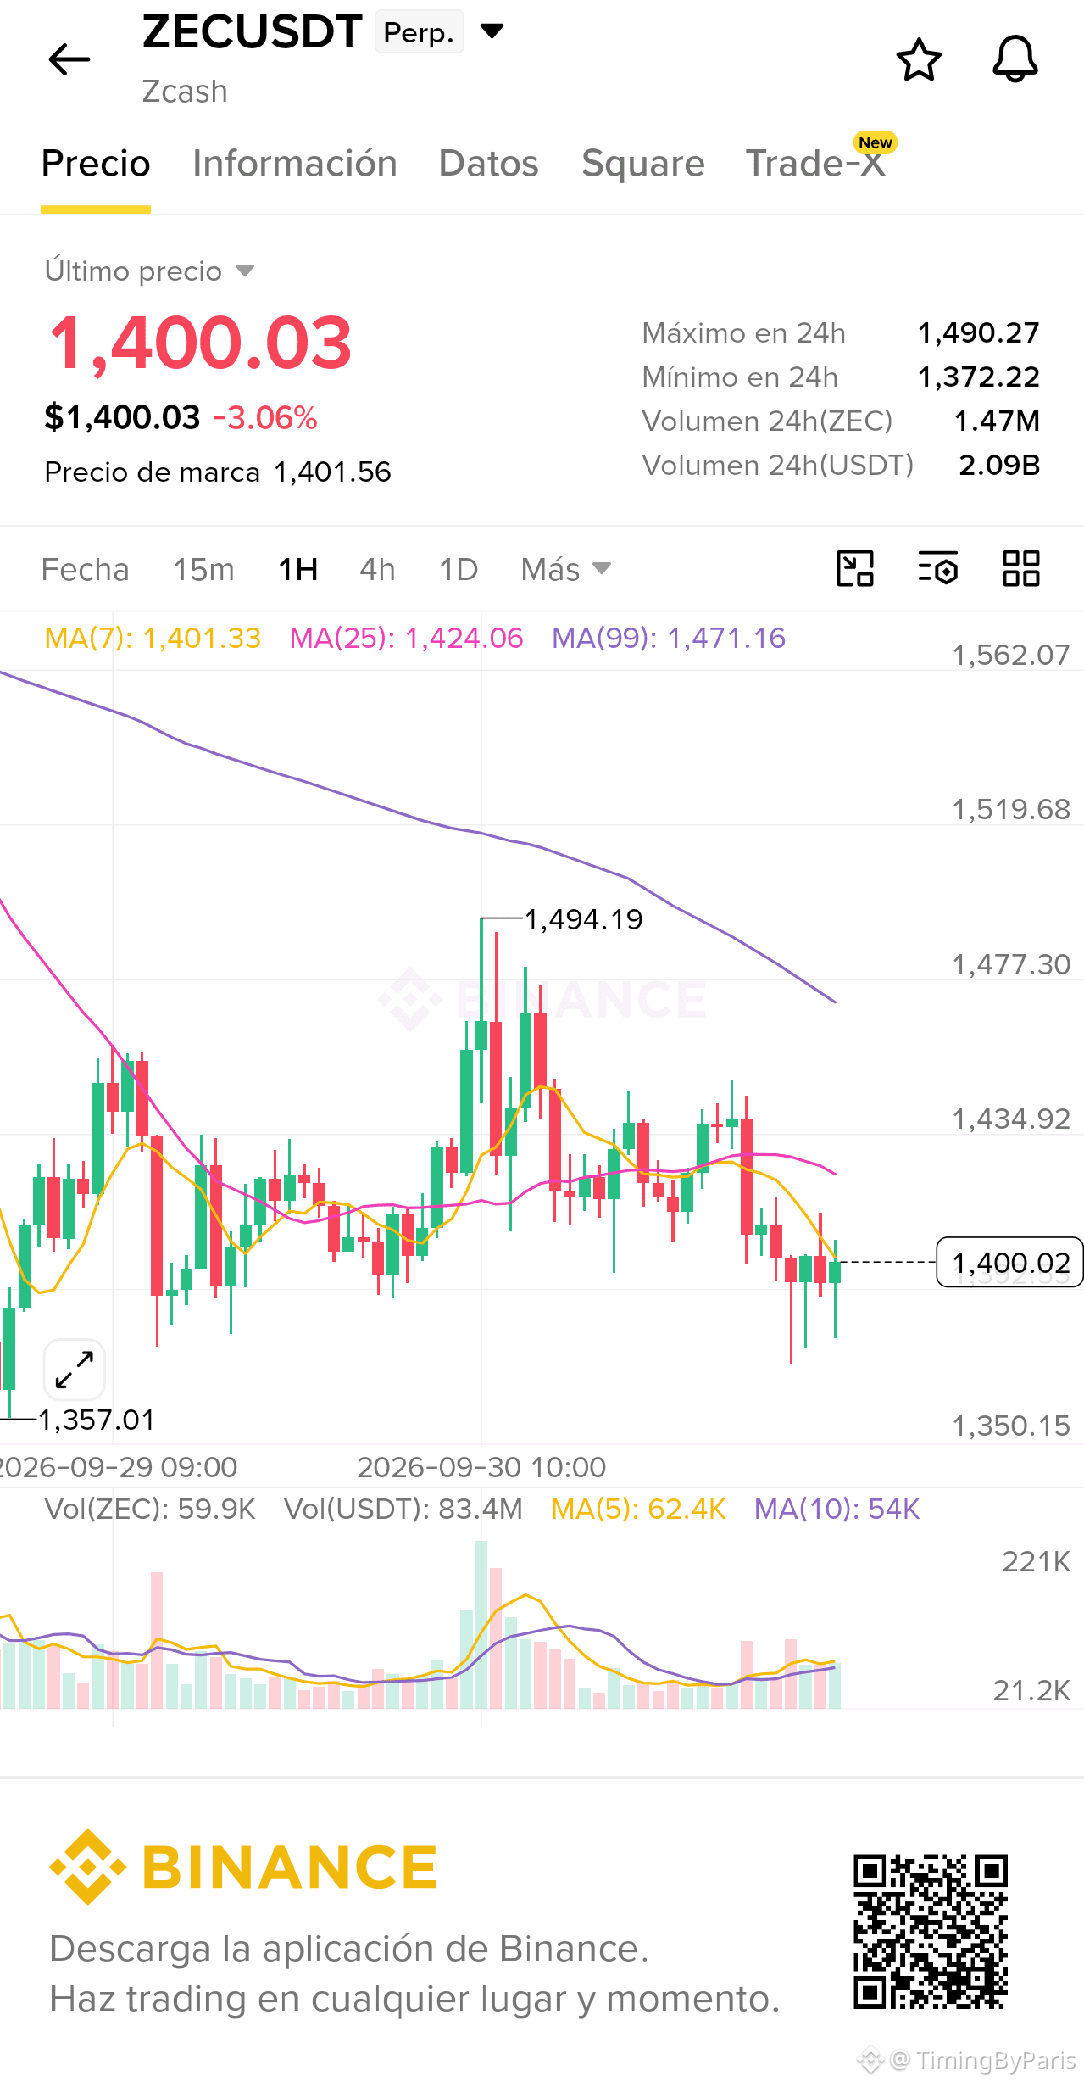
ZEC has had a hellish run.
But I think the next move will be toward $1,200 to clean up the liquidity below.
$1,380 is the local base that I'm seeing.
Once that drops, I'll see you all down there
$ZEC
{future}(ZECUSDT)
ZEC has had a hellish run.
But I think the next move will be toward $1,200 to clean up the liquidity below.
$1,380 is the local base that I'm seeing.
Once that drops, I'll see you all down there
$ZEC
But I think the next move will be toward $1,200 to clean up the liquidity below.
$1,380 is the local base that I'm seeing.
Once that drops, I'll see you all down there
$ZEC
1
2
909
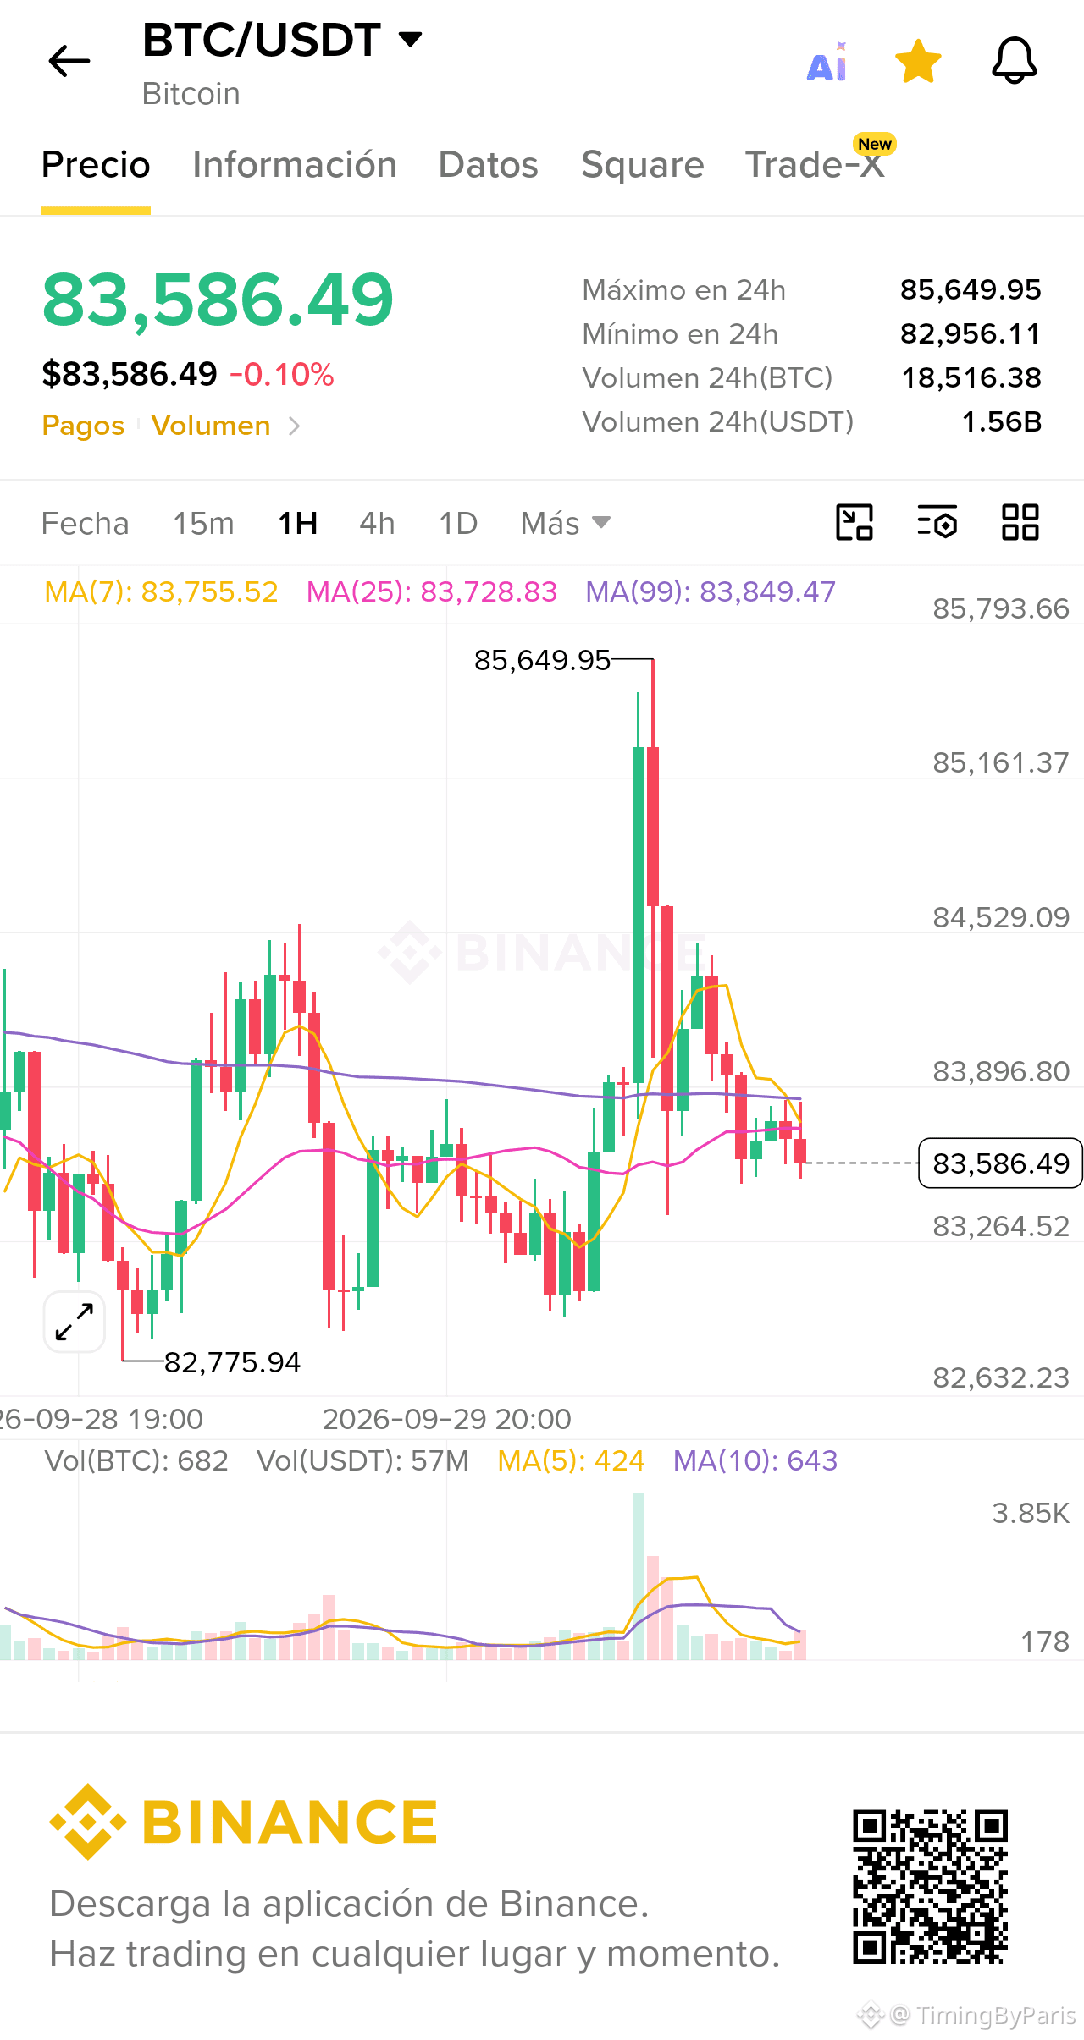
My long-term plan for $BTC within this range.
I still expect us to hunt liquidity around $81K and potentially lower before the next bullish macro impulse.
But in trading, you always have to be prepared for the alternative instead of getting married to a single scenario.
Looking at the structure objectively, there is a reasonable bullish case developing.
Buyers are stepping in earlier during pullbacks, with higher lows forming above the weekly breakout pivot.
If that continues, $81K could simply keep being front-run while BTC consolidates for another bullish move.
A break above $85.2K is my long trigger for that scenario.
That invalidates the local lower-high structure and gives me a setup that first targets $87K, then potentially $90K and higher on continuation.
If we lose $83K before that triggers, I expect us to sweep liquidity at $81.5K and lower.
In that case, I’ll just be patient and wait for the chart to give me a better long setup further down.
$BTC
{future}(BTCUSDT)
My long-term plan for $BTC within this range.
I still expect us to hunt liquidity around $81K and potentially lower before the next bullish macro impulse.
But in trading, you always have to be prepared for the alternative instead of getting married to a single scenario.
Looking at the structure objectively, there is a reasonable bullish case developing.
Buyers are stepping in earlier during pullbacks, with higher lows forming above the weekly breakout pivot.
If that continues, $81K could simply keep being front-run while BTC consolidates for another bullish move.
A break above $85.2K is my long trigger for that scenario.
That invalidates the local lower-high structure and gives me a setup that first targets $87K, then potentially $90K and higher on continuation.
If we lose $83K before that triggers, I expect us to sweep liquidity at $81.5K and lower.
In that case, I’ll just be patient and wait for the chart to give me a better long setup further down.
$BTC
I still expect us to hunt liquidity around $81K and potentially lower before the next bullish macro impulse.
But in trading, you always have to be prepared for the alternative instead of getting married to a single scenario.
Looking at the structure objectively, there is a reasonable bullish case developing.
Buyers are stepping in earlier during pullbacks, with higher lows forming above the weekly breakout pivot.
If that continues, $81K could simply keep being front-run while BTC consolidates for another bullish move.
A break above $85.2K is my long trigger for that scenario.
That invalidates the local lower-high structure and gives me a setup that first targets $87K, then potentially $90K and higher on continuation.
If we lose $83K before that triggers, I expect us to sweep liquidity at $81.5K and lower.
In that case, I’ll just be patient and wait for the chart to give me a better long setup further down.
$BTC
2
165
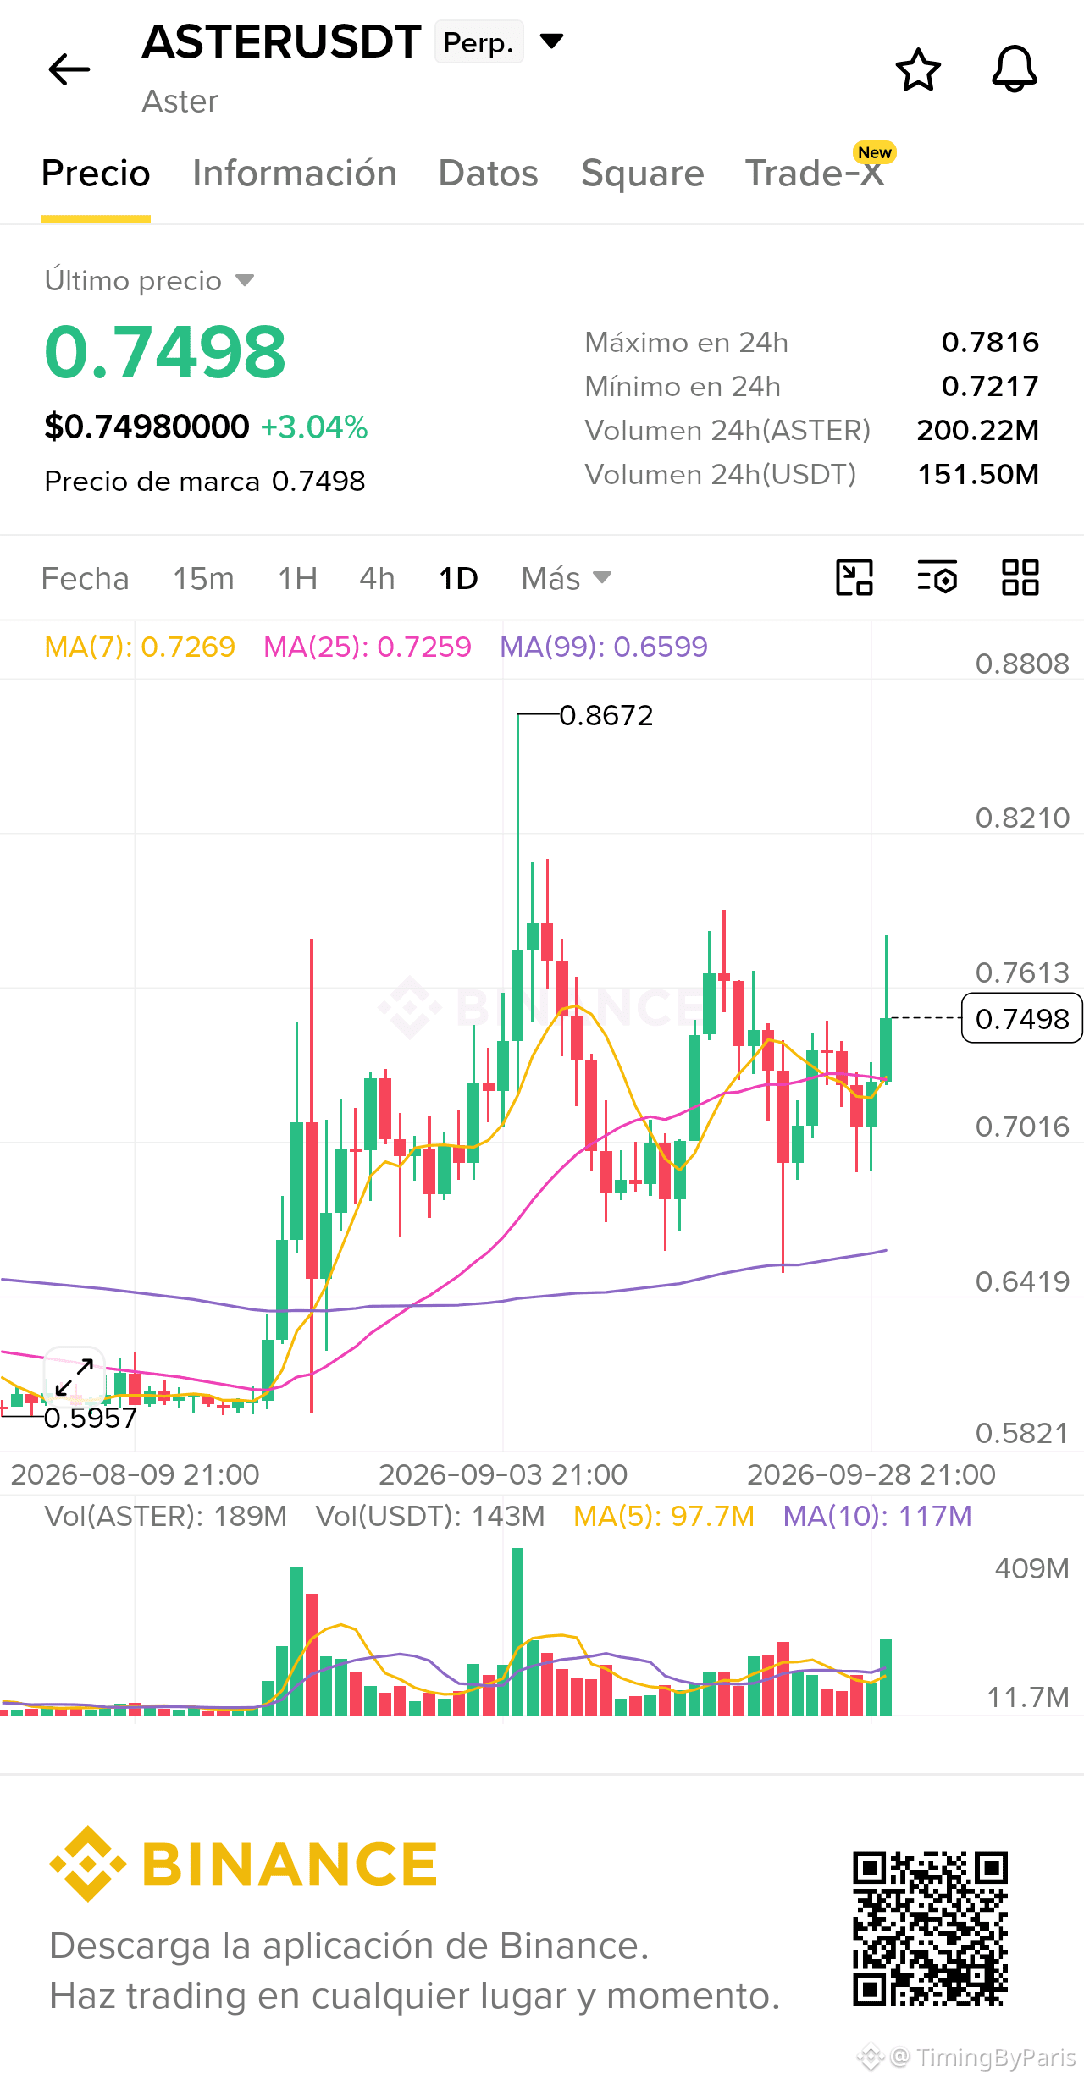
If Si $ASTER starts to accept above $0.81, ask yourself whether you would accept the same setup with a different ticker attached.
If the answer is yes, then your problem isn’t in the chart. It’s in how you feel about the asset.
You don’t have to like a project to recognize a good setup.
One thing I’ve learned in a decade of trading is that letting a setup pass—based on how I personally feel about the asset—rarely serves me well.
If Si $ASTER starts to accept above $0.81, ask yourself whether you would accept the same setup with a different ticker attached.
If the answer is yes, then your problem isn’t in the chart. It’s in how you feel about the asset.
You don’t have to like a project to recognize a good setup.
One thing I’ve learned in a decade of trading is that letting a setup pass—based on how I personally feel about the asset—rarely serves me well.
If the answer is yes, then your problem isn’t in the chart. It’s in how you feel about the asset.
You don’t have to like a project to recognize a good setup.
One thing I’ve learned in a decade of trading is that letting a setup pass—based on how I personally feel about the asset—rarely serves me well.
1
190
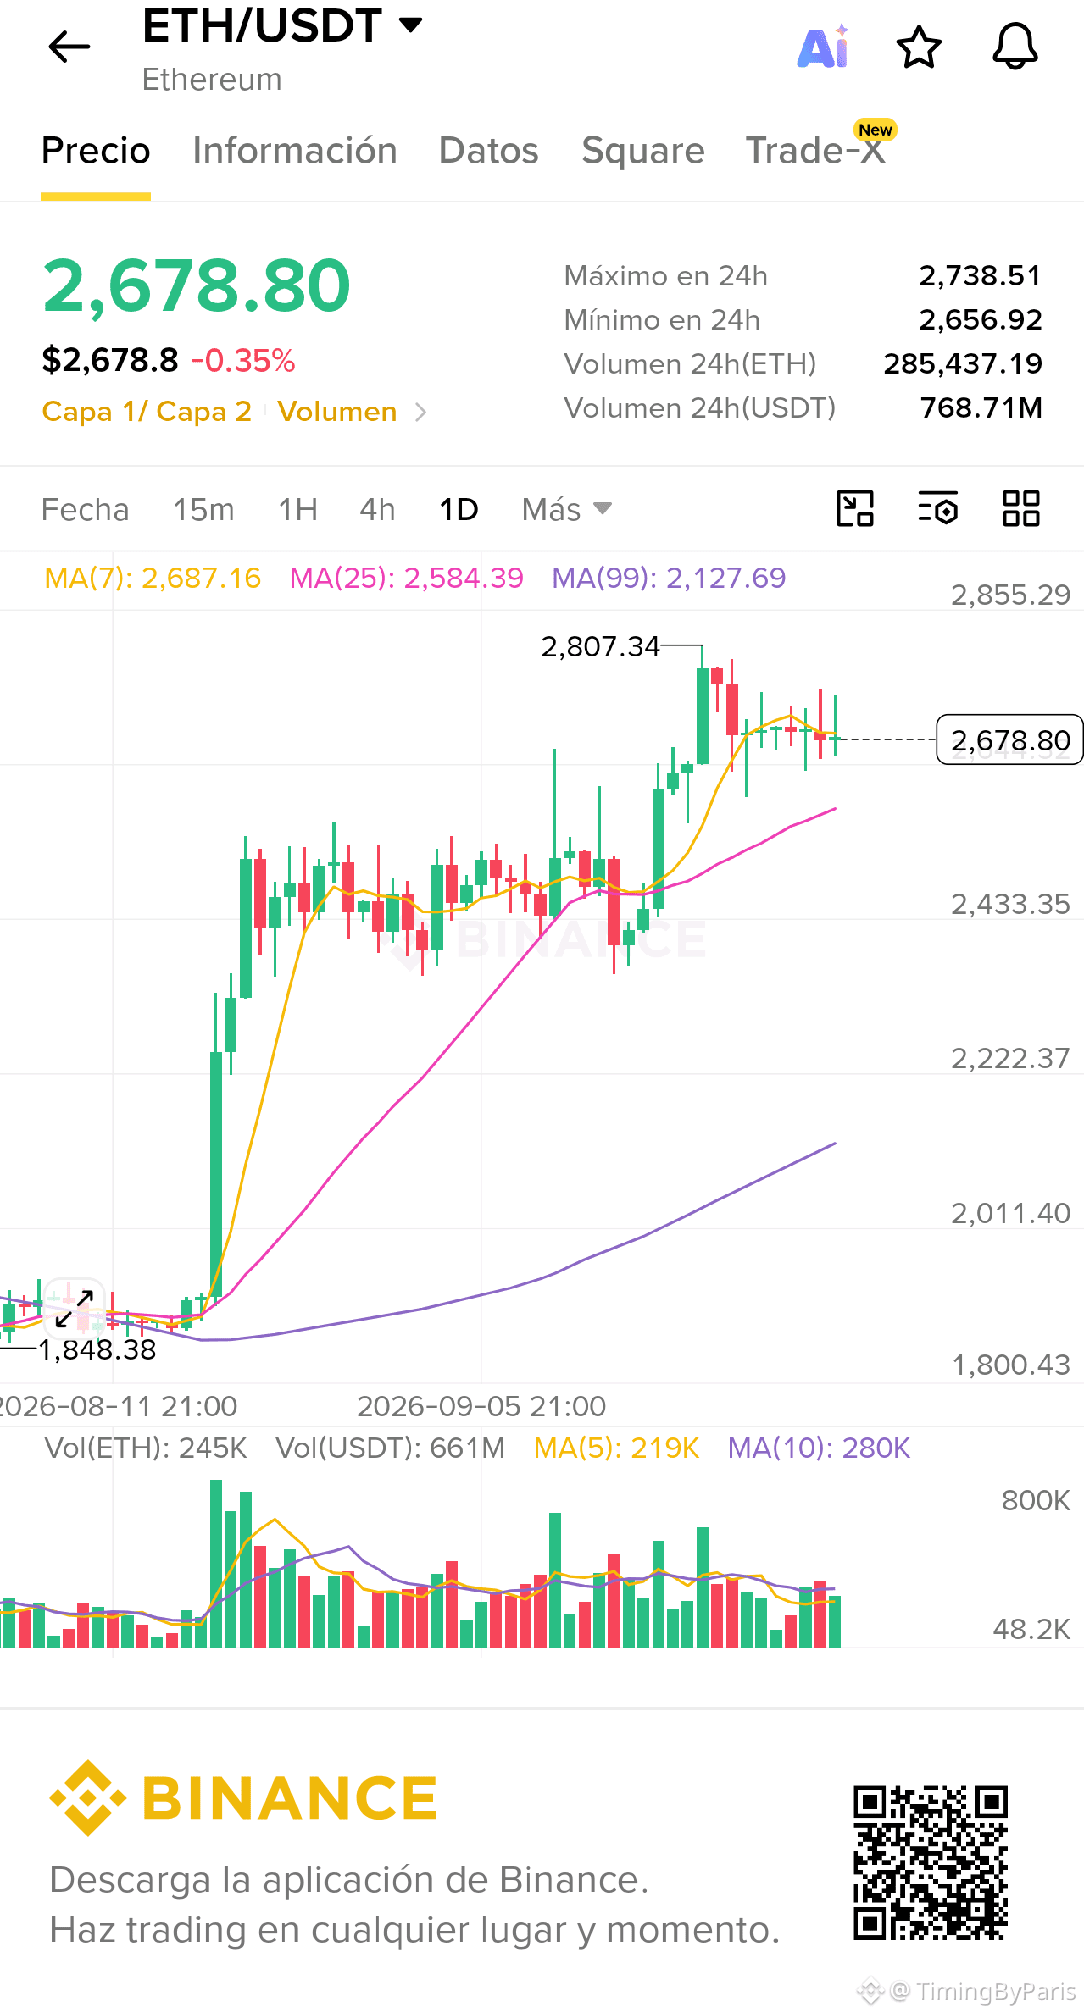
"I’m waiting for $$ETH to drop from $2K before buying."
Interesting how that price has become much more attractive now that Ethereum is trading around $2.7K.
The market had three months to build positions down there.
If I remember right, the discussion was about how much more Ethereum could fall—not about how much people wanted to hold.
Now all of a sudden, buying below $2K is everyone’s plan.
Just a casual 30% correction to give you the perfect entry.
There’s nothing wrong with waiting for a setup. But assuming the price has to return to the level you refused to buy at isn’t much of a plan.
Personally, I think many of those buy orders below $2K are going to go unfilled.
$ETH
{future}(ETHUSDT)
"I’m waiting for $$ETH to drop from $2K before buying."
Interesting how that price has become much more attractive now that Ethereum is trading around $2.7K.
The market had three months to build positions down there.
If I remember right, the discussion was about how much more Ethereum could fall—not about how much people wanted to hold.
Now all of a sudden, buying below $2K is everyone’s plan.
Just a casual 30% correction to give you the perfect entry.
There’s nothing wrong with waiting for a setup. But assuming the price has to return to the level you refused to buy at isn’t much of a plan.
Personally, I think many of those buy orders below $2K are going to go unfilled.
$ETH
Interesting how that price has become much more attractive now that Ethereum is trading around $2.7K.
The market had three months to build positions down there.
If I remember right, the discussion was about how much more Ethereum could fall—not about how much people wanted to hold.
Now all of a sudden, buying below $2K is everyone’s plan.
Just a casual 30% correction to give you the perfect entry.
There’s nothing wrong with waiting for a setup. But assuming the price has to return to the level you refused to buy at isn’t much of a plan.
Personally, I think many of those buy orders below $2K are going to go unfilled.
$ETH
3
1
1.3k
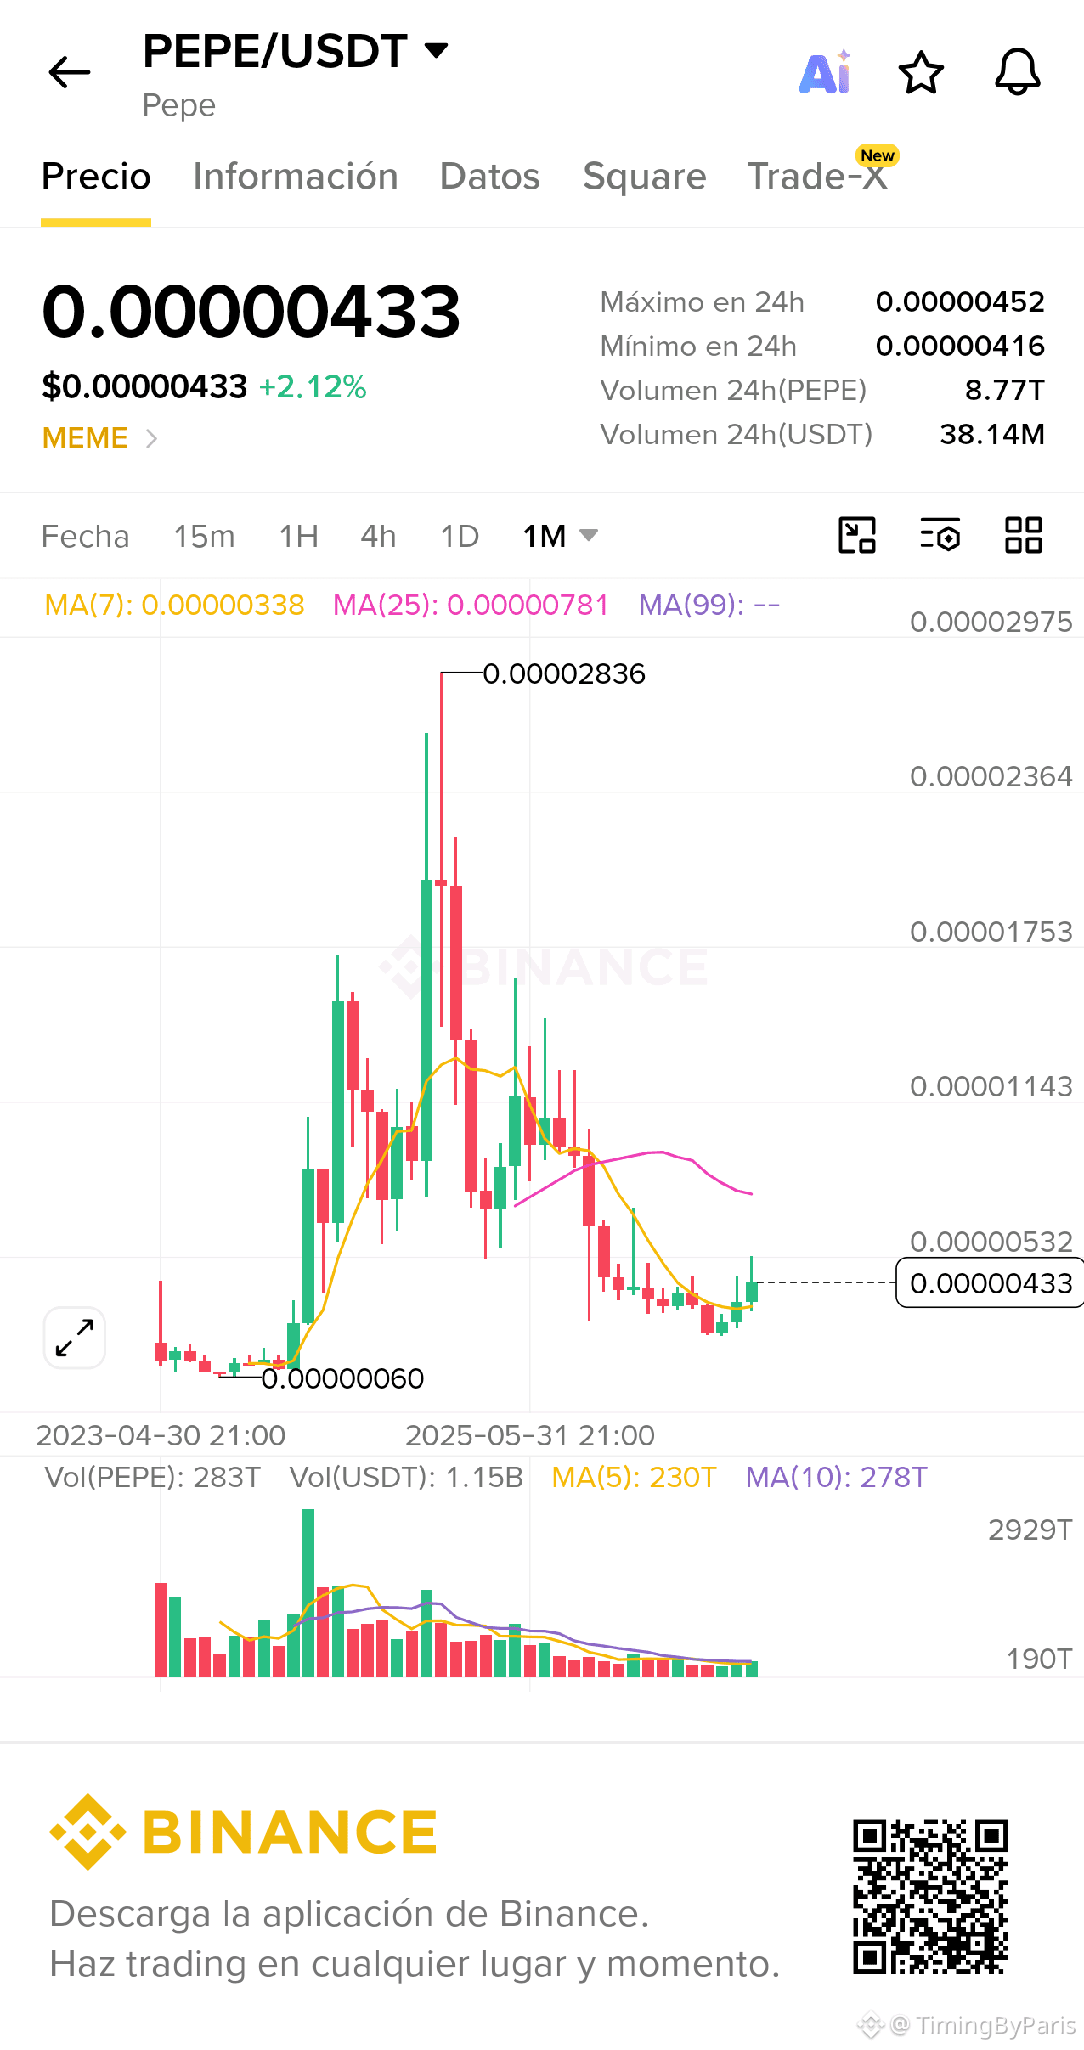
$PEPE
{spot}(PEPEUSDT)
1W 📈
PEPE has officially broken out of this huge 2.5-year bearish falling wedge, a classic macro bullish reversal pattern.
As has been seen across the entire market, altcoins continue to show solid technical setups for the next bullish leg.
Higher. 🚀
$PEPE
1W 📈
PEPE has officially broken out of this huge 2.5-year bearish falling wedge, a classic macro bullish reversal pattern.
As has been seen across the entire market, altcoins continue to show solid technical setups for the next bullish leg.
Higher. 🚀
1W 📈
PEPE has officially broken out of this huge 2.5-year bearish falling wedge, a classic macro bullish reversal pattern.
As has been seen across the entire market, altcoins continue to show solid technical setups for the next bullish leg.
Higher. 🚀
2
2
1.6k
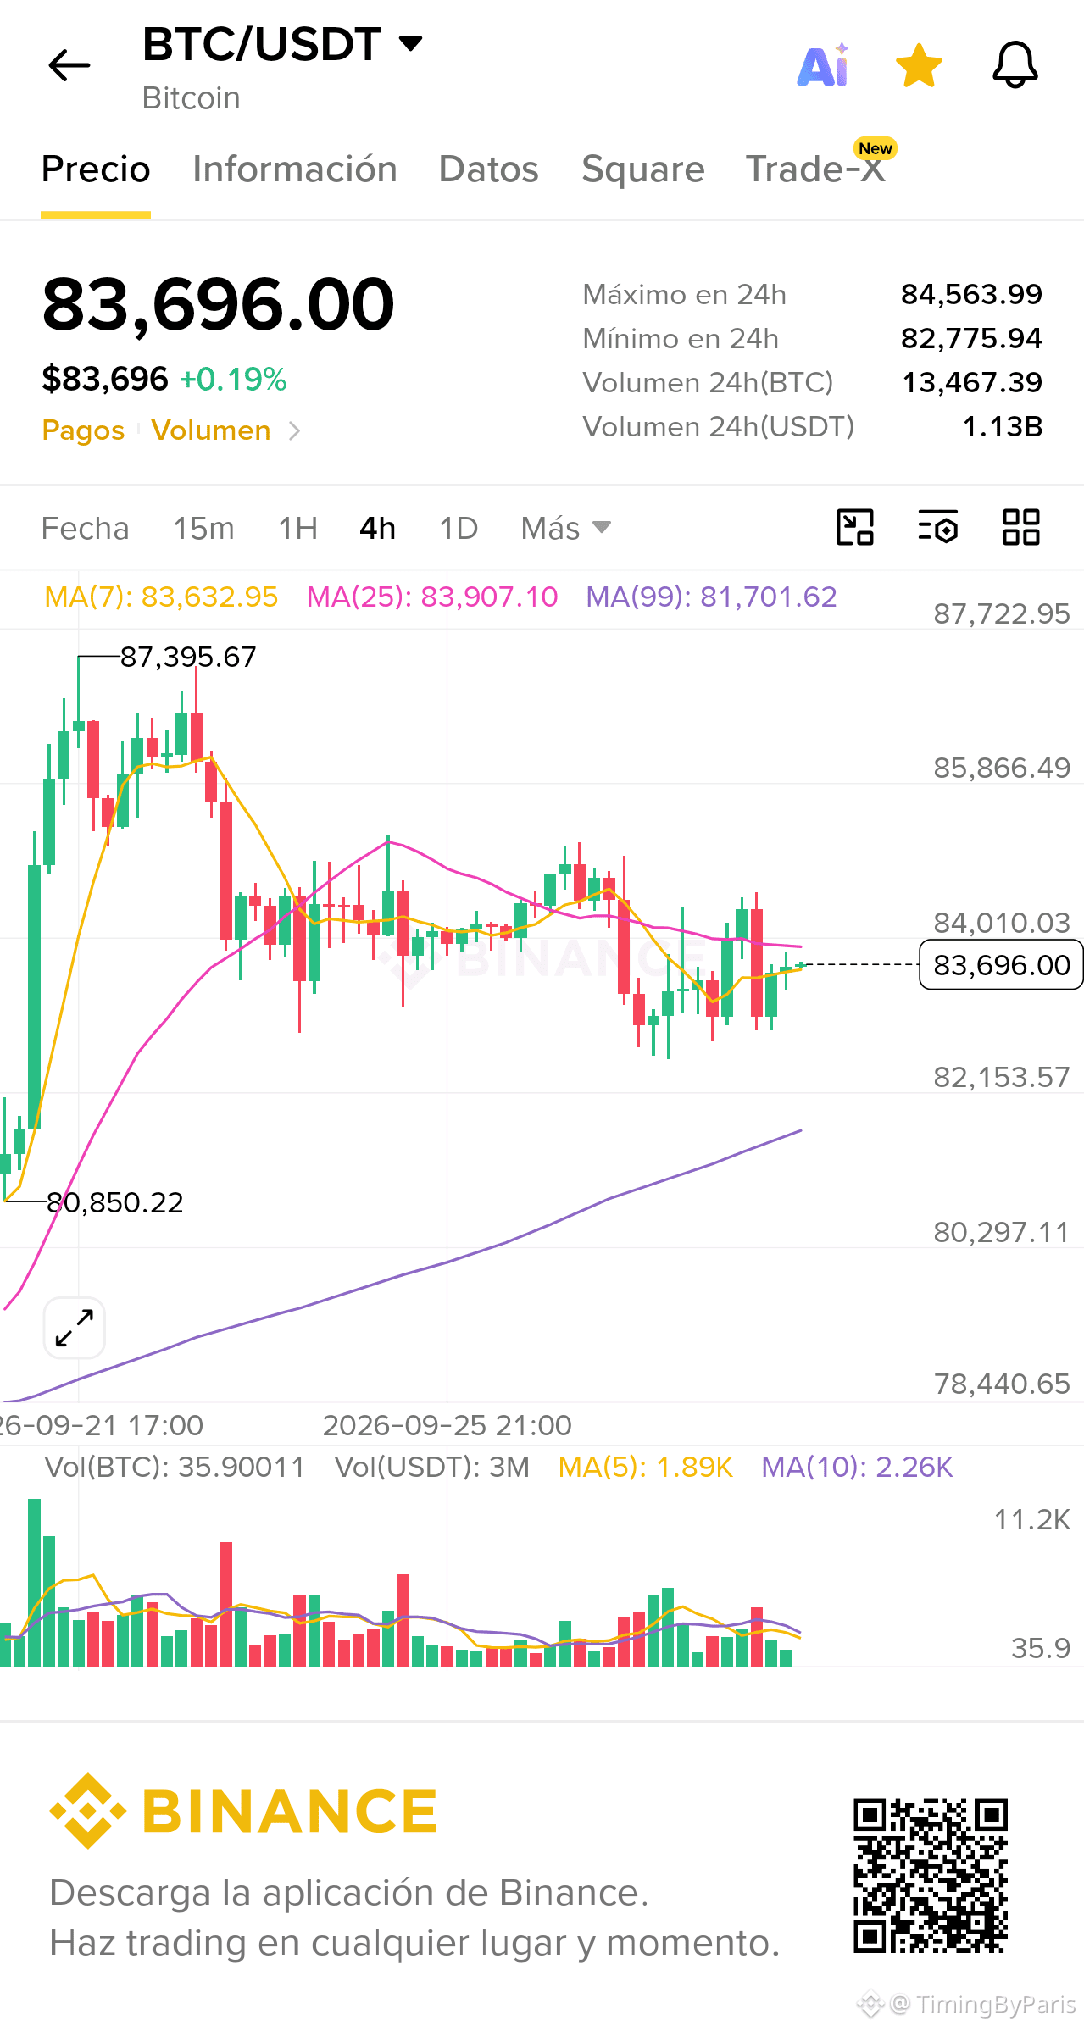
I think people are going to make this $BTC range much more complicated than it really needs to be.
My view is that we are re-accumulating now before the next increase.
We had accumulation near the lows, followed by the first expansion.
That process can include pullbacks, failed breakouts, and weeks of going nowhere. It doesn’t have to look clean while it’s happening.
Every push toward the highs will convince people that the next stage has started. Every move back down toward support will make them question whether the entire recovery was a trap.
You can spend weeks flip-flopping with that price action while the bigger picture barely changes.
Personally, I still believe we are building the next stage of the recovery here, and that the eventual resolution is higher.
$BTC
{future}(BTCUSDT)
I think people are going to make this $BTC range much more complicated than it really needs to be.
My view is that we are re-accumulating now before the next increase.
We had accumulation near the lows, followed by the first expansion.
That process can include pullbacks, failed breakouts, and weeks of going nowhere. It doesn’t have to look clean while it’s happening.
Every push toward the highs will convince people that the next stage has started. Every move back down toward support will make them question whether the entire recovery was a trap.
You can spend weeks flip-flopping with that price action while the bigger picture barely changes.
Personally, I still believe we are building the next stage of the recovery here, and that the eventual resolution is higher.
$BTC
My view is that we are re-accumulating now before the next increase.
We had accumulation near the lows, followed by the first expansion.
That process can include pullbacks, failed breakouts, and weeks of going nowhere. It doesn’t have to look clean while it’s happening.
Every push toward the highs will convince people that the next stage has started. Every move back down toward support will make them question whether the entire recovery was a trap.
You can spend weeks flip-flopping with that price action while the bigger picture barely changes.
Personally, I still believe we are building the next stage of the recovery here, and that the eventual resolution is higher.
$BTC
2
1.5k
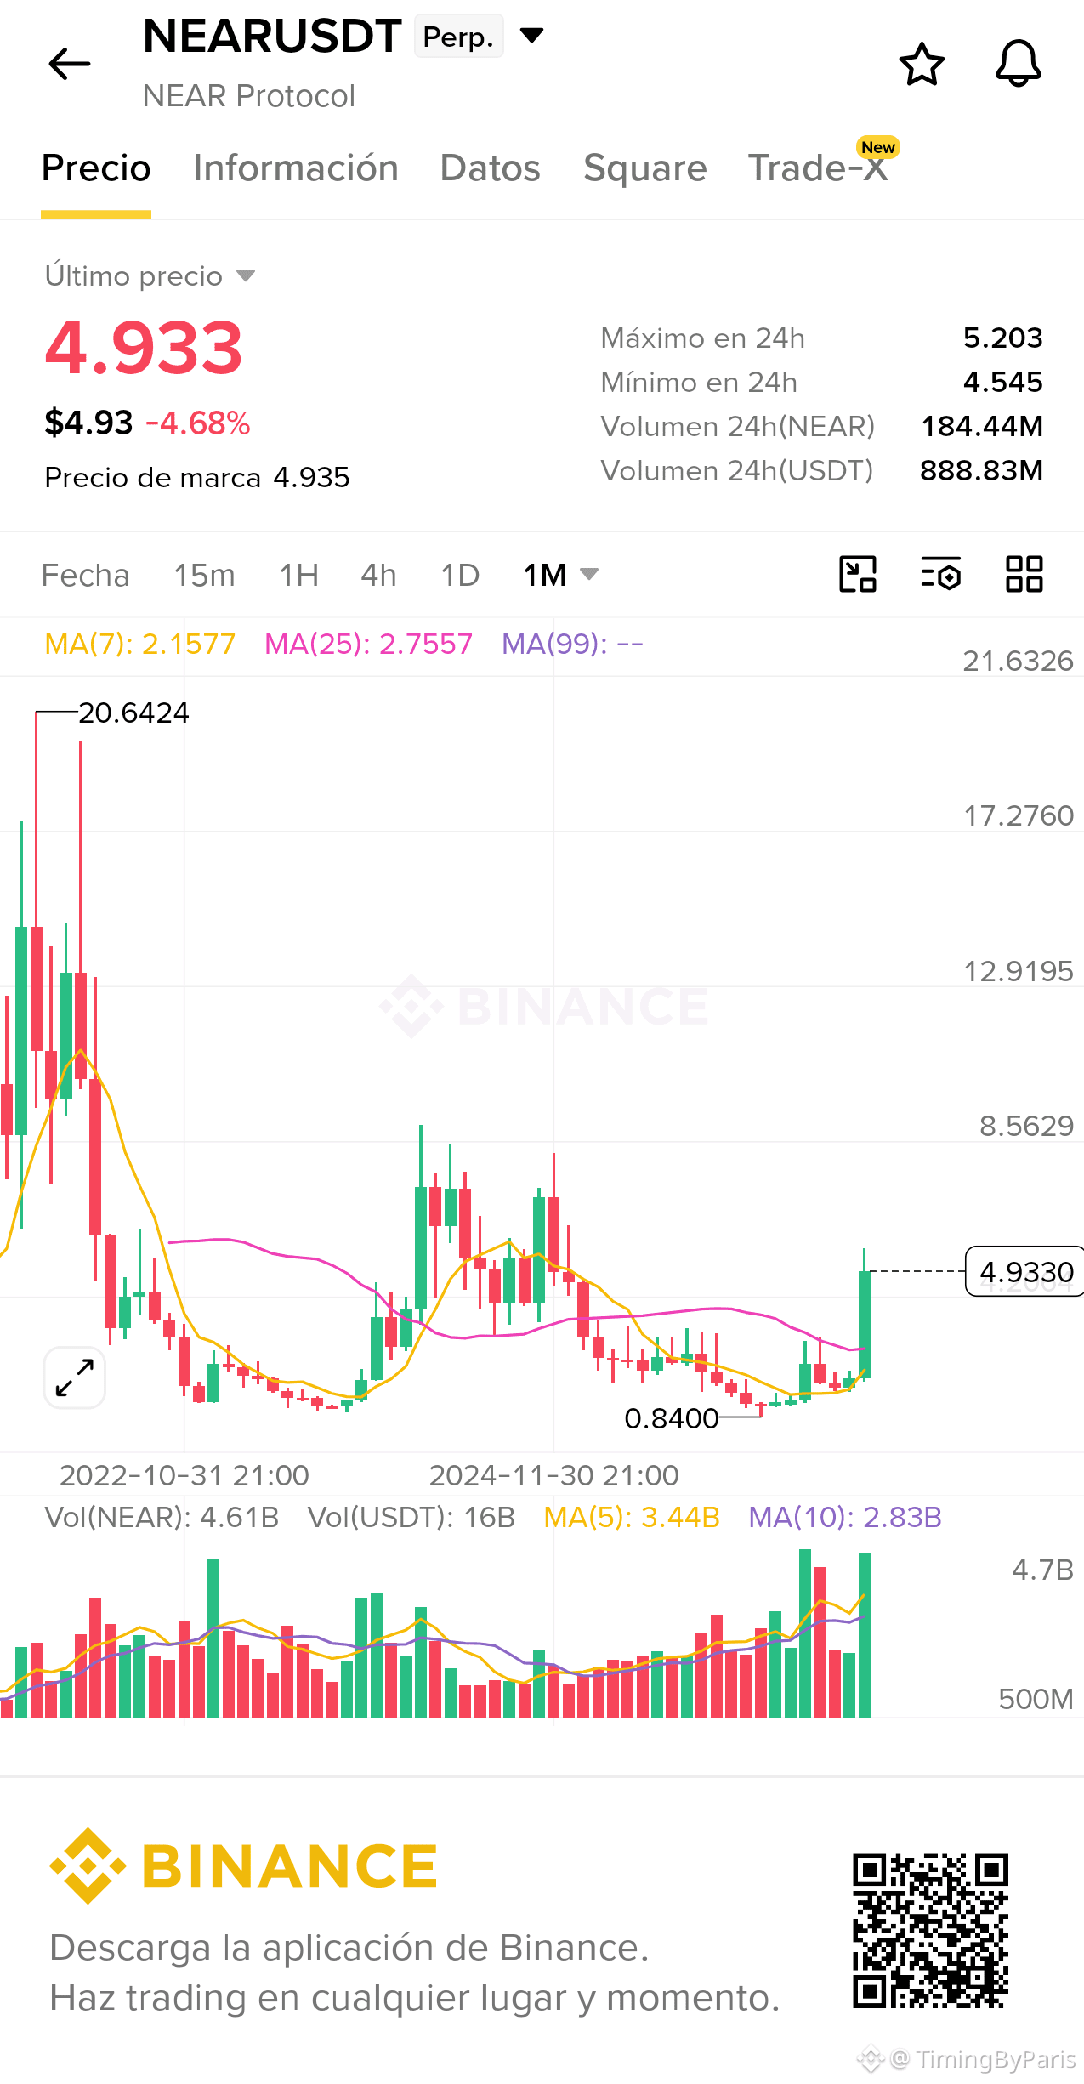
Look at this monthly chart and tell me where the bearish argument is at $NEAR
{future}(NEARUSDT)
A monthly oscillation failure at the lows.
A breakout through a five-year downtrend.
The monthly EMAs being reclaimed for the first time in 18 months.
That’s where your explanation is for why I turned bullish at $3.50.
As long as we stay above that trendline, I’m not going to fight with a chart that’s finally doing what the bulls have expected to see for years.
Look at this monthly chart and tell me where the bearish argument is at $NEAR
A monthly oscillation failure at the lows.
A breakout through a five-year downtrend.
The monthly EMAs being reclaimed for the first time in 18 months.
That’s where your explanation is for why I turned bullish at $3.50.
As long as we stay above that trendline, I’m not going to fight with a chart that’s finally doing what the bulls have expected to see for years.
A monthly oscillation failure at the lows.
A breakout through a five-year downtrend.
The monthly EMAs being reclaimed for the first time in 18 months.
That’s where your explanation is for why I turned bullish at $3.50.
As long as we stay above that trendline, I’m not going to fight with a chart that’s finally doing what the bulls have expected to see for years.
1
1
4
1.9k
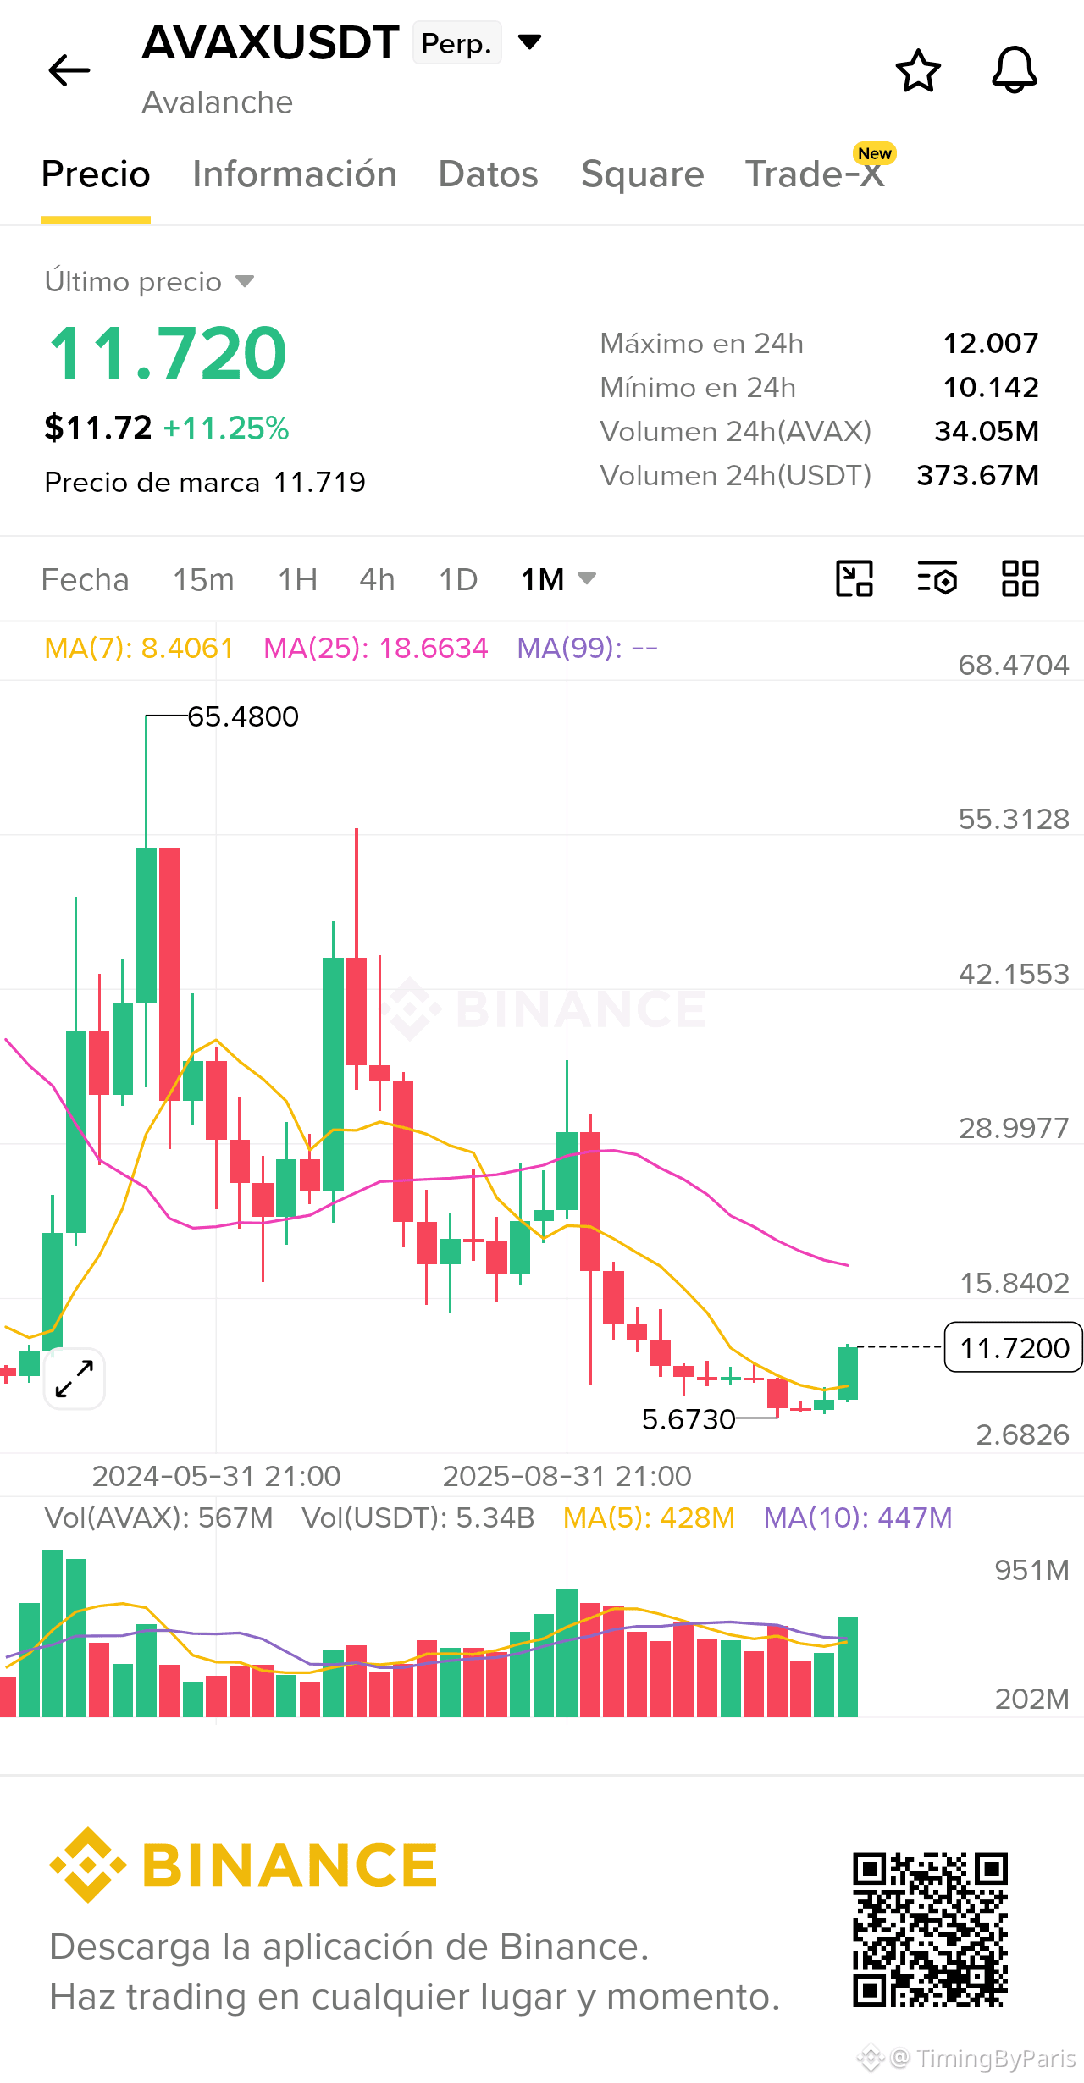
$AVAX 1M
AVAX has been in this bearish wedge since 2021. The MACD is also on the verge of a bullish crossover.
Let's take a look at a legendary bullish altcoin rally, and we're far from finished here, in my opinion.
$AVAX
{future}(AVAXUSDT)
$AVAX 1M
AVAX has been in this bearish wedge since 2021. The MACD is also on the verge of a bullish crossover.
Let's take a look at a legendary bullish altcoin rally, and we're far from finished here, in my opinion.
$AVAX
AVAX has been in this bearish wedge since 2021. The MACD is also on the verge of a bullish crossover.
Let's take a look at a legendary bullish altcoin rally, and we're far from finished here, in my opinion.
$AVAX
1
5
1.4k
Log in to explore more content
Join global crypto users on Binance Square
⚡️ Get latest and useful information about crypto.
💬 Trusted by the world’s largest crypto exchange.
👍 Discover real insights from verified creators.
Email / Phone number
Trending Topics
SECHaltsCryptoETFReviewsAmidFundingLapse
59,701 views
675 Discussing
🚨🔥 BREAKING: SEC FUNDING LAPSE JUST FREEZES NEW CRYPTO ETF REVIEWS! 🇺🇸
⚠️ Following the start of the U.S. fiscal year on October 1, a lapse in federal funding has temporarily disrupted SEC operations.
📄 Reviews and effective approvals for new crypto ETF registration statements are reportedly paused during the funding disruption.
👀 ETF APPROVALS ON HOLD — CRYPTO MARKET WATCHING!
🚀 Could this create a major delay for the next wave of crypto ETFs?
💬 BULLISH OR BEARISH FOR CRYPTO? DROP YOUR TAKE! 👇
🔔 Follow for more SEC, ETF & crypto breaking news.
$AIN $BEAMX $GLMR
#SECHaltsCryptoETFReviewsAmidFundingLapse
Salotra Crypto
·0 Likes
·74 views
ZcashETFPostsFirstWeeklyOutflow$93.6M
65,491 views
202 Discussing
GreekPoliceBustCryptoScamRingArrest17
217,350 views
1,538 Discussing