
波段七哥
368 Posts

波段七哥
公众号:(波段七哥)始终坚守核心纪律,止损为风险划定底线,趋势为操作指引方向,二者相辅相成。
1 Following
1.5K+ Followers
2.0K+ Liked
Posts
All
Quotes
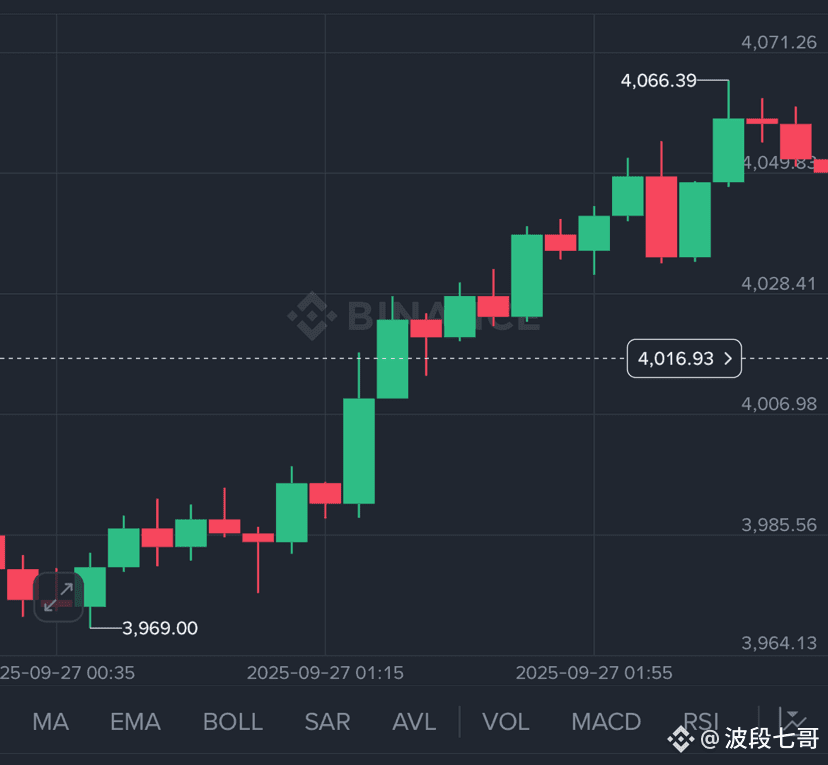
At seven in the morning, Brother Seven has already provided a plan and it has been verified.
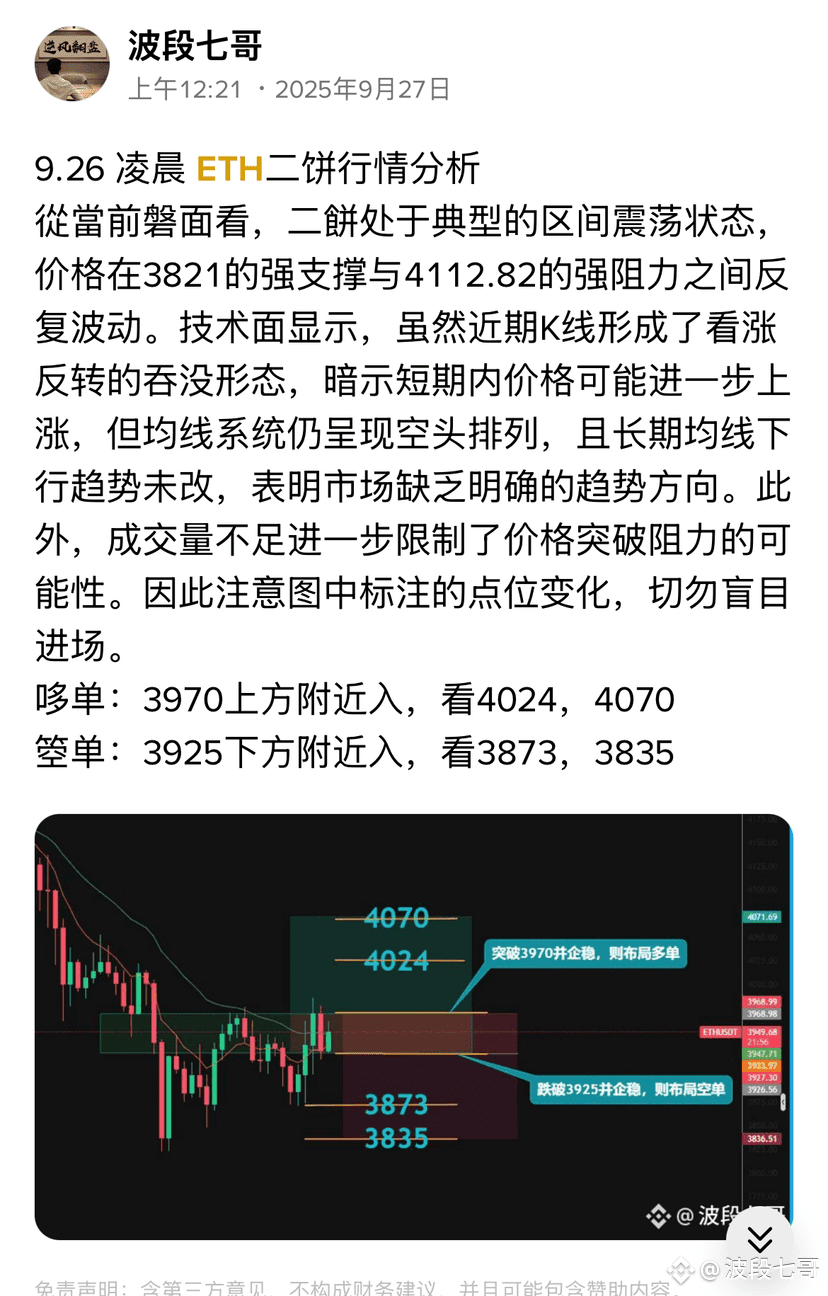
9.26 Early Morning ETH Market Analysis
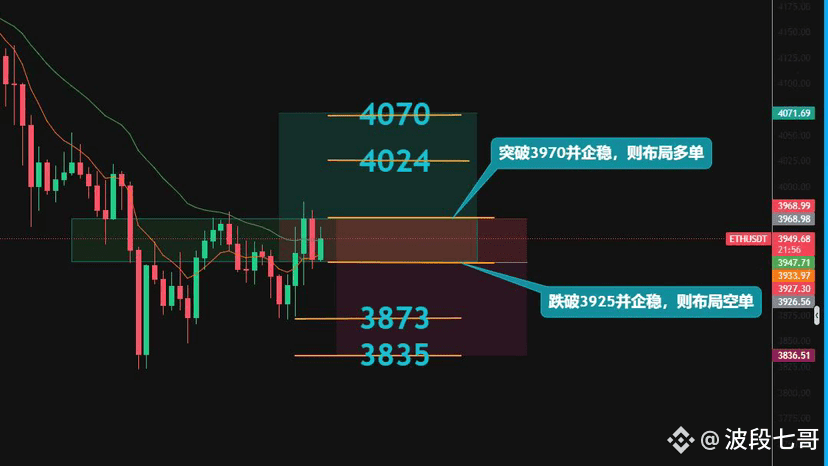
From the current market perspective, the price is in a typical range fluctuation state, oscillating between the strong support at 3821 and the strong resistance at 4112.82. The technical indicators show that although the recent candlestick pattern has formed a bullish reversal engulfing pattern, suggesting that the price may rise further in the short term, the moving average system still presents a bearish arrangement, and the long-term moving average downtrend remains unchanged, indicating a lack of a clear trend direction in the market. In addition, insufficient trading volume further limits the possibility of a price breakout against resistance. Therefore, pay attention to the point changes marked in the chart, and do not enter blindly.
Long Position: Enter near 3970, target 4024, 4070
Short Position: Enter near 3925, target 3873, 3835
From the current market perspective, the price is in a typical range fluctuation state, oscillating between the strong support at 3821 and the strong resistance at 4112.82. The technical indicators show that although the recent candlestick pattern has formed a bullish reversal engulfing pattern, suggesting that the price may rise further in the short term, the moving average system still presents a bearish arrangement, and the long-term moving average downtrend remains unchanged, indicating a lack of a clear trend direction in the market. In addition, insufficient trading volume further limits the possibility of a price breakout against resistance. Therefore, pay attention to the point changes marked in the chart, and do not enter blindly.
Long Position: Enter near 3970, target 4024, 4070
Short Position: Enter near 3925, target 3873, 3835
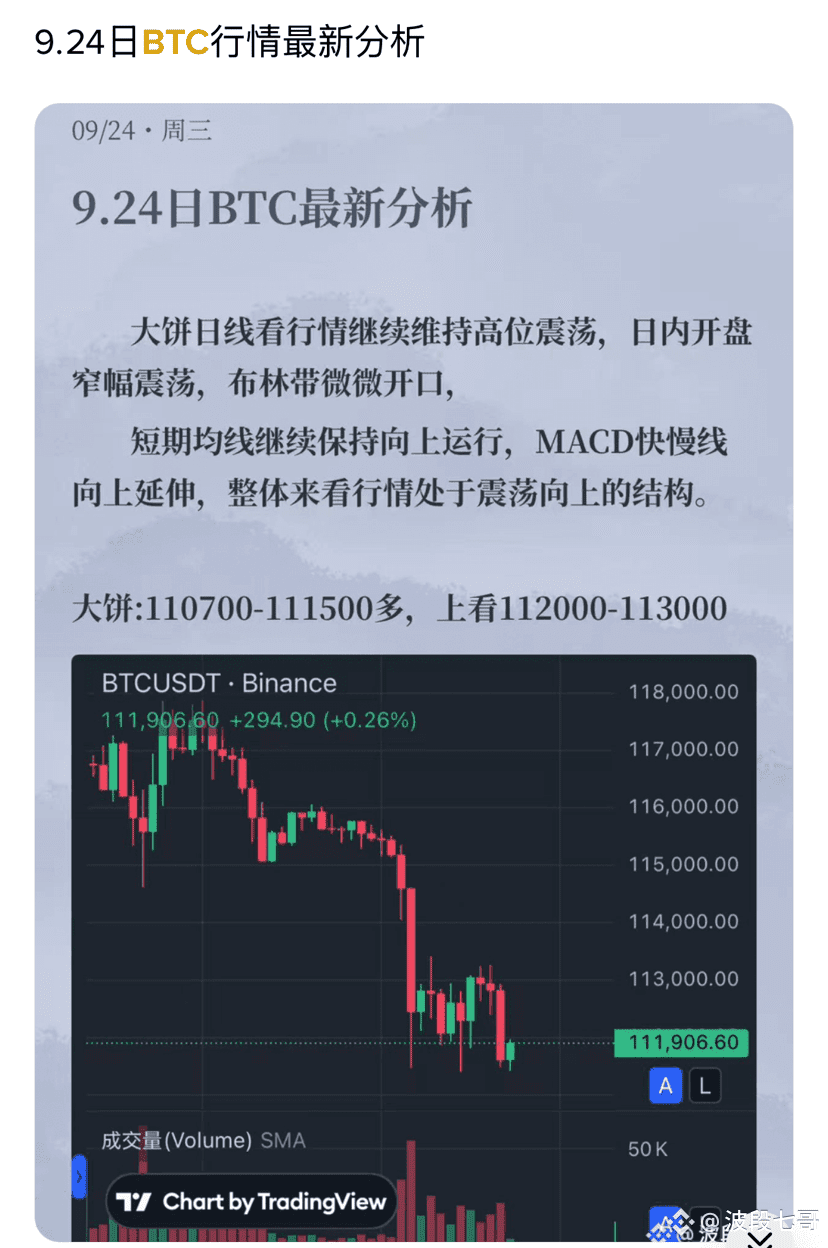
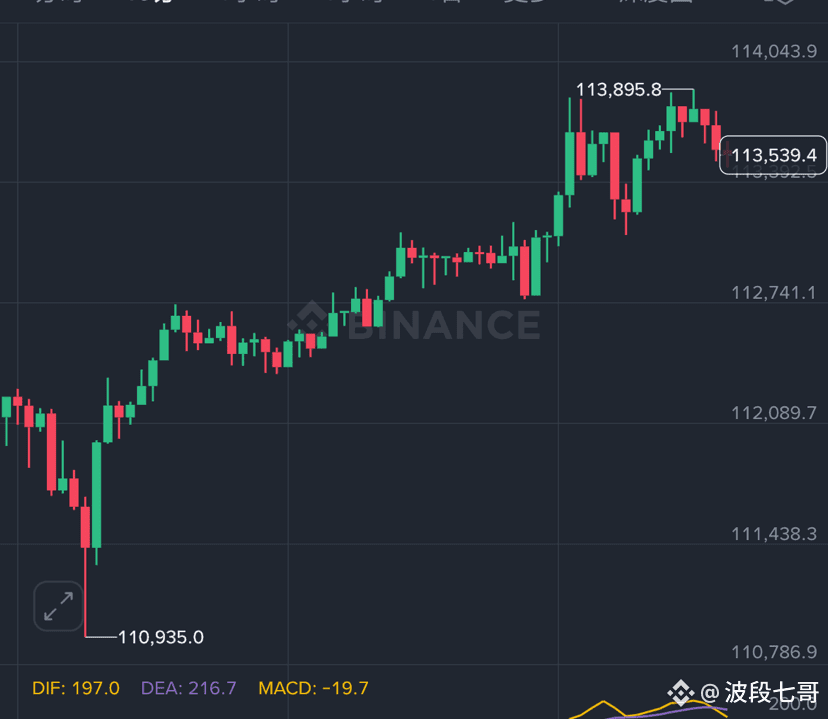

Hua Jiasha is here, brothers in Guangdong pay attention to safety!





The news is just about cutting leeks

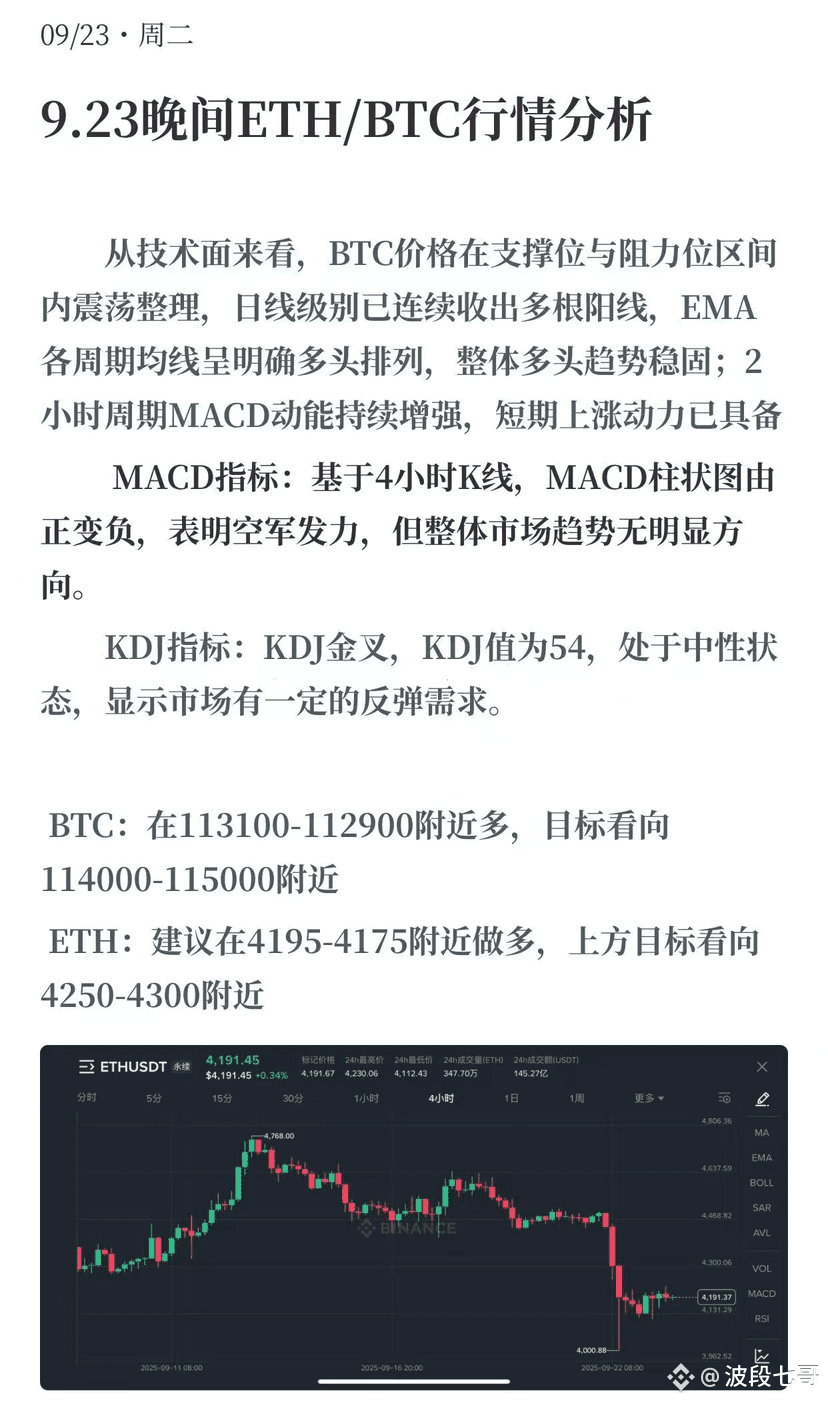
9.23 AM ETH Market Analysis
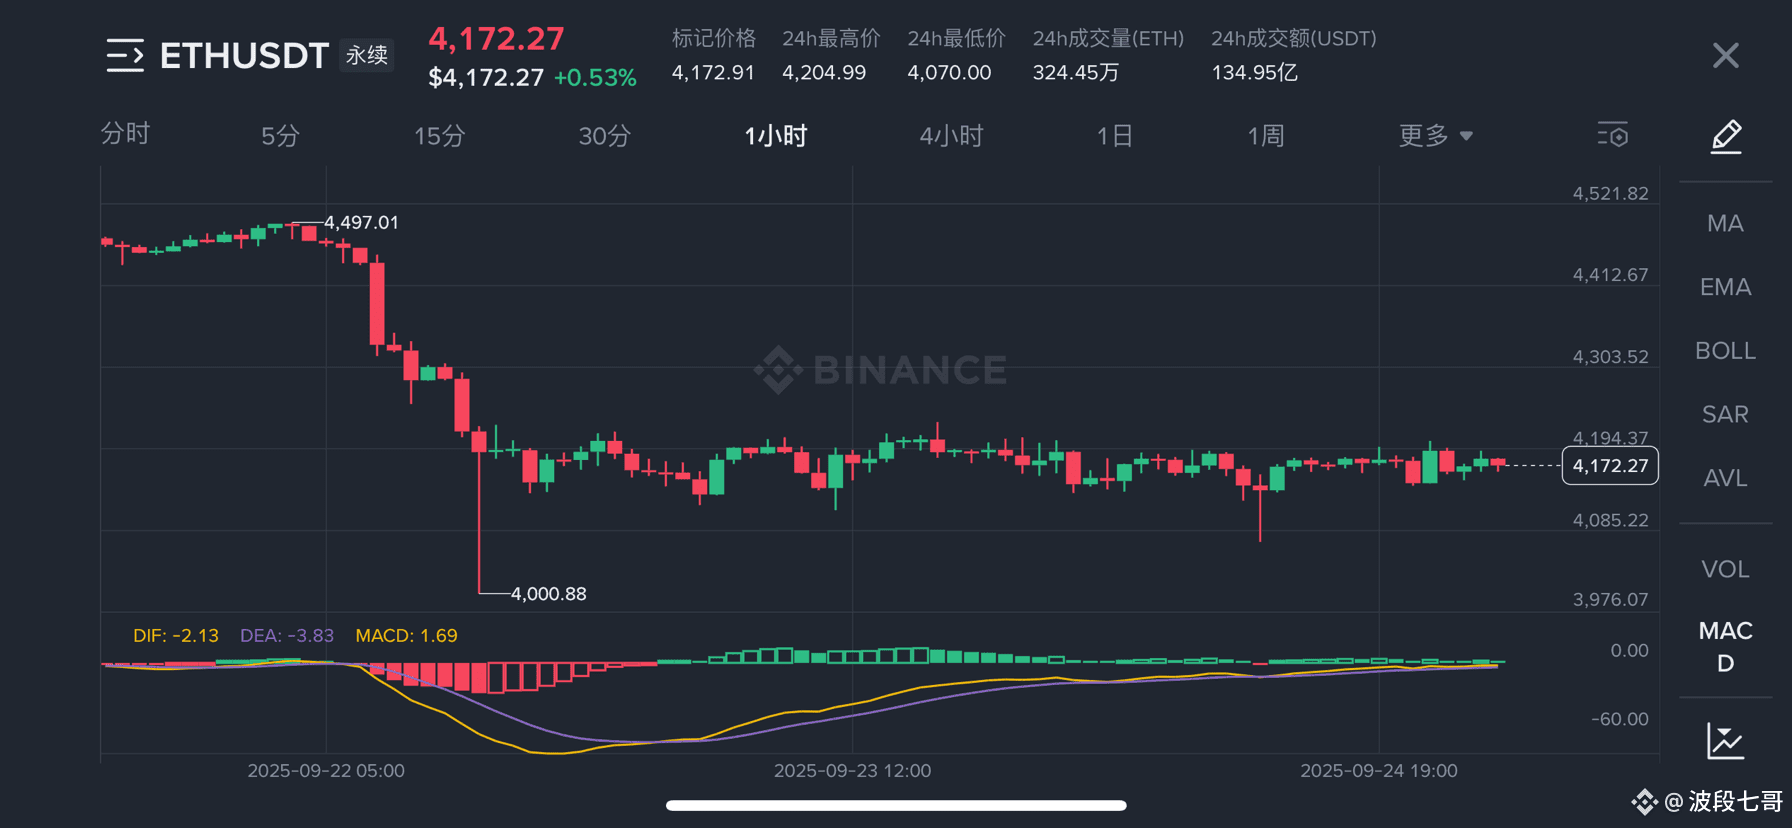
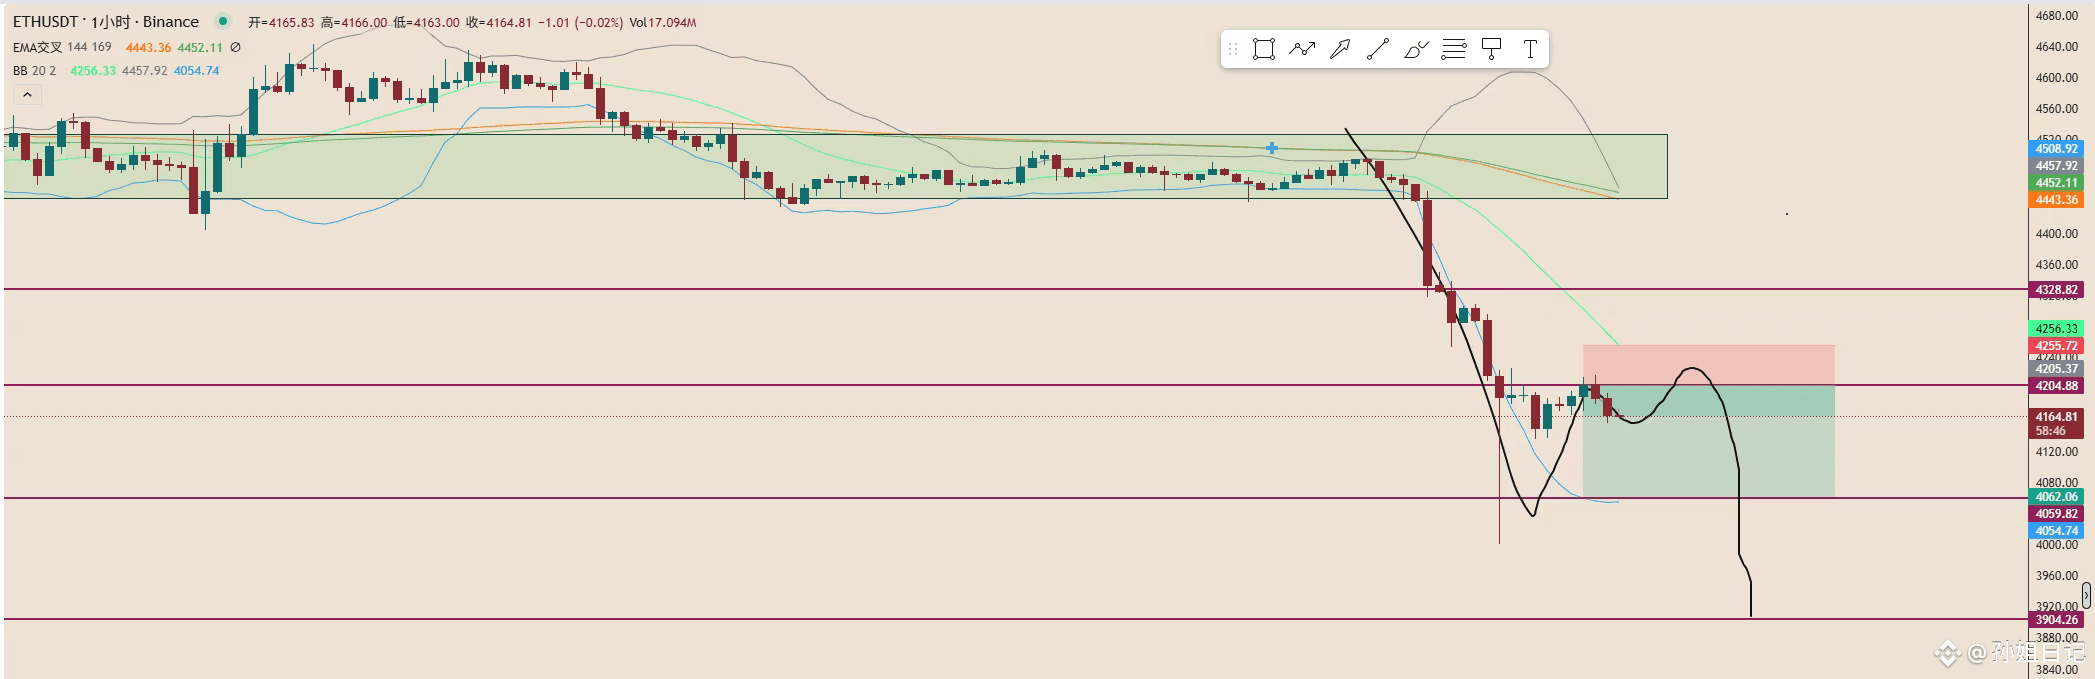
On September 22, the ETH market was extremely volatile, with the price of Ethereum plummeting sharply, falling nearly 500 points, and dipping to the 4000 point level, breaking through the previously viewed strong support level of 4205 points. It was pointed out earlier in the afternoon that if the 4205 point level could not be recovered, a bearish trend would be established, and subsequent profit-taking targets could look towards 4141, which was indeed the case as the bearish trend yielded substantial gains. Entering the evening, the price still could not return above 4205; the current market trend is quite clear, and the main strategy is to short on any pullbacks.
From a technical analysis perspective of the hourly structure, the EMA moving average death cross is continuing to widen, with bearish strength continuously increasing. The lower Bollinger Band is currently providing support around the 4050 point level. The once strong support level of 4205 has now transformed into a key resistance level. If the 4205 point level cannot be recovered and stabilized in the short term, according to the current trend, the price will likely test the 4050 point level, and may even fall further to the 4000 point level. Once the 4000 point level is also breached, the market situation will undergo a fundamental change; if it falls below 4000, a bear market may officially arrive!
On September 22, the ETH market was extremely volatile, with the price of Ethereum plummeting sharply, falling nearly 500 points, and dipping to the 4000 point level, breaking through the previously viewed strong support level of 4205 points. It was pointed out earlier in the afternoon that if the 4205 point level could not be recovered, a bearish trend would be established, and subsequent profit-taking targets could look towards 4141, which was indeed the case as the bearish trend yielded substantial gains. Entering the evening, the price still could not return above 4205; the current market trend is quite clear, and the main strategy is to short on any pullbacks.
From a technical analysis perspective of the hourly structure, the EMA moving average death cross is continuing to widen, with bearish strength continuously increasing. The lower Bollinger Band is currently providing support around the 4050 point level. The once strong support level of 4205 has now transformed into a key resistance level. If the 4205 point level cannot be recovered and stabilized in the short term, according to the current trend, the price will likely test the 4050 point level, and may even fall further to the 4000 point level. Once the 4000 point level is also breached, the market situation will undergo a fundamental change; if it falls below 4000, a bear market may officially arrive!
No analysis on Saturday and Sunday, as the fluctuations are not significant.
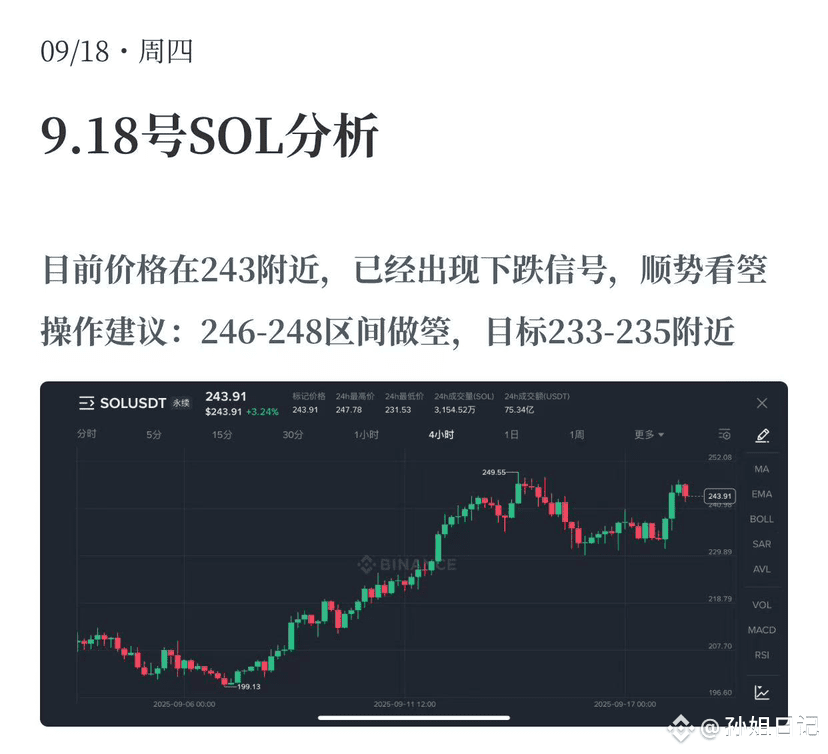
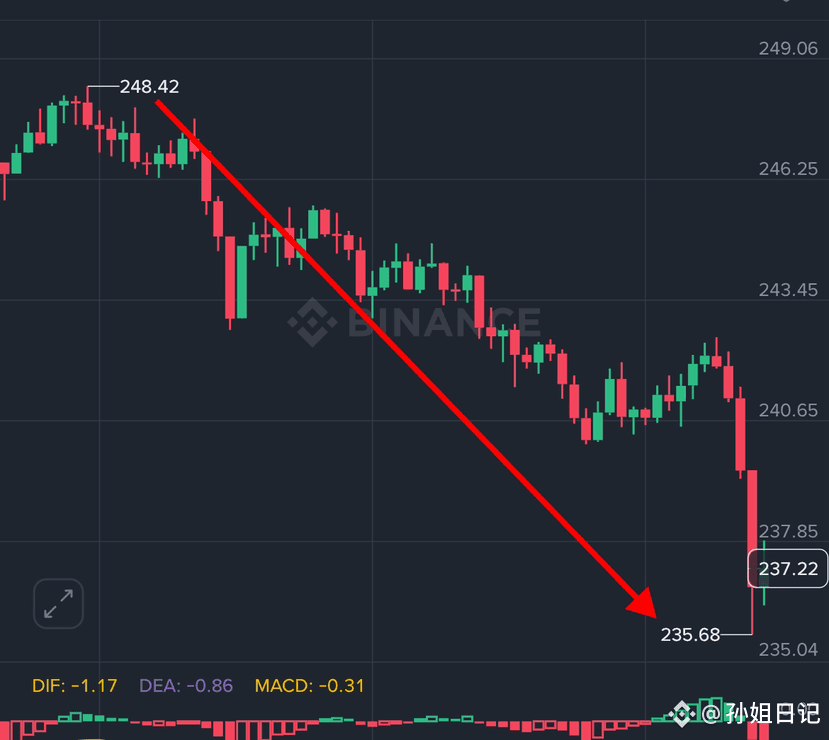
September 18 SOL Market Analysis
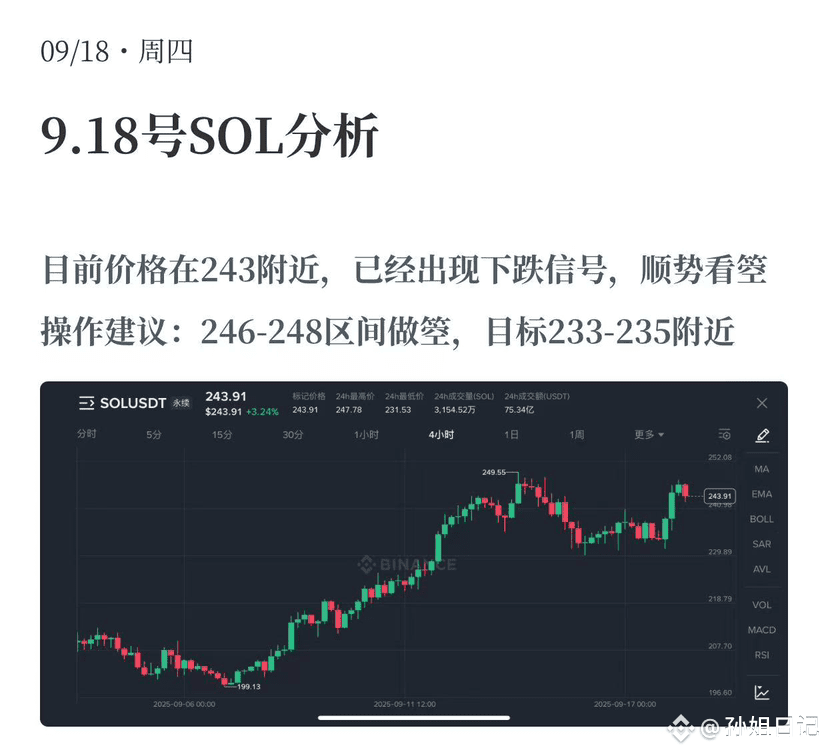
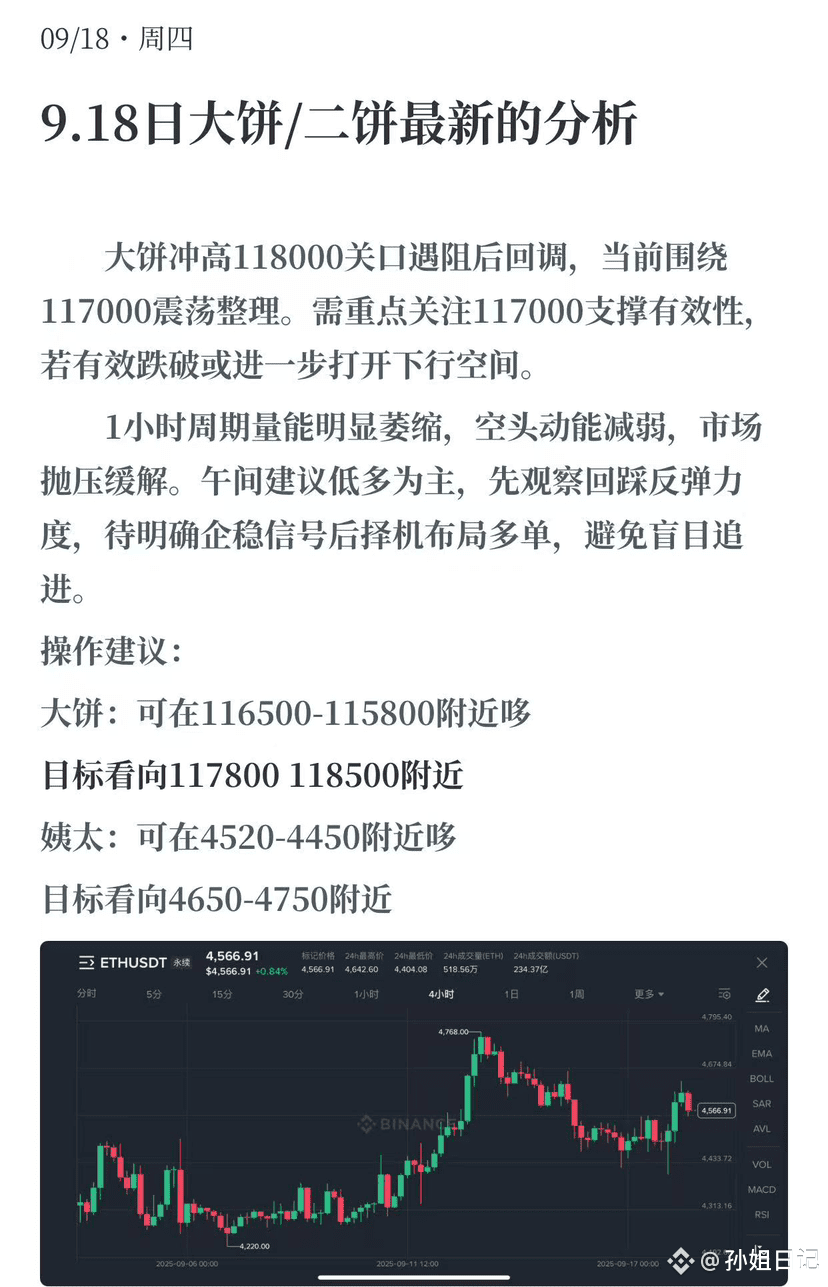
Latest analysis of the pancake on September 18th / second pancake
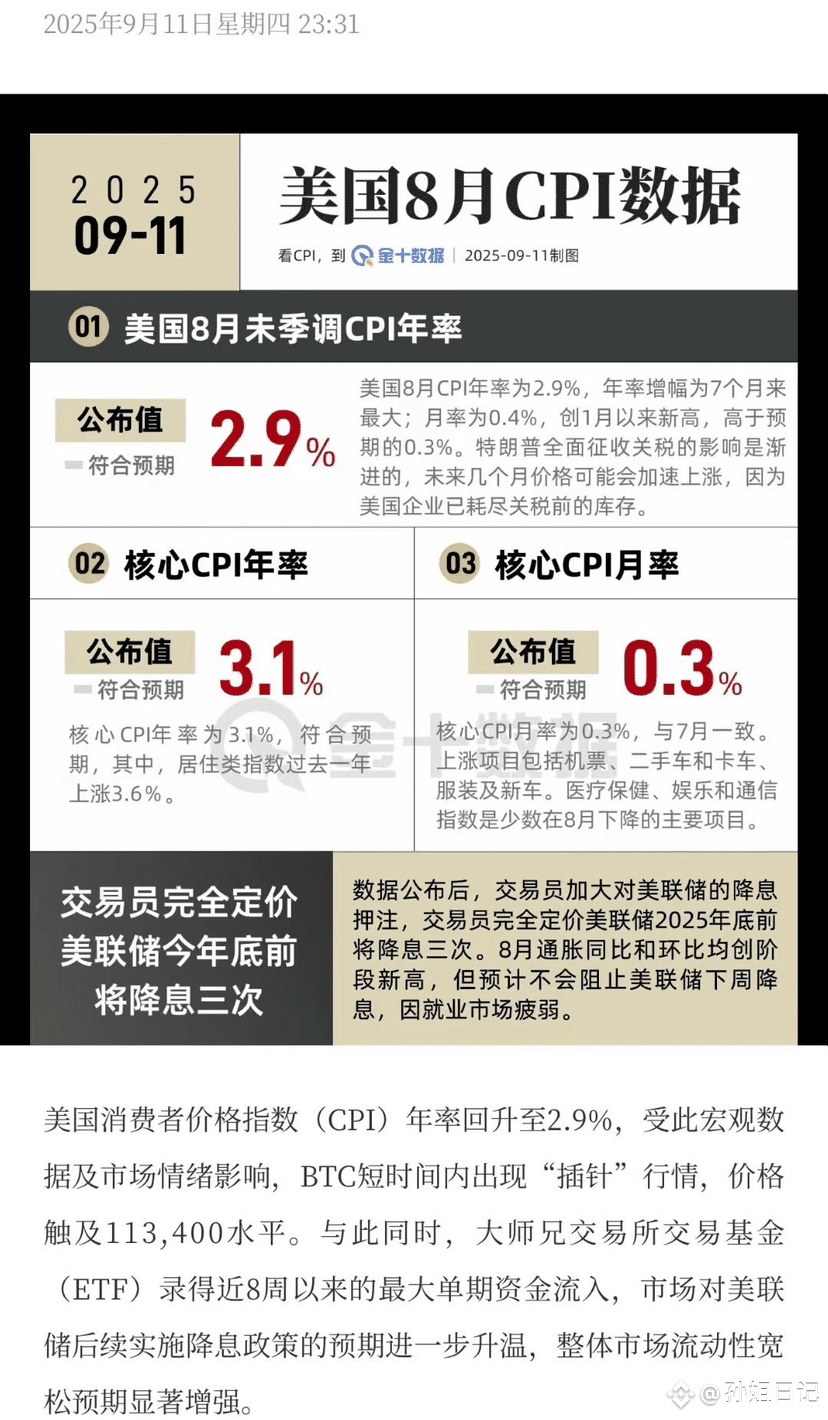
◾️The annual Consumer Price Index (CPI) in the United States rebounded to 2.9%. Affected by this macro data and market sentiment, BTC experienced a "spike" in a short period, with prices reaching the level of 113,400. Meanwhile, the BTC exchange-traded fund (ETF) recorded the largest single-period capital inflow in nearly 8 weeks, with market expectations for the Federal Reserve's subsequent interest rate cuts further heating up, significantly enhancing overall market liquidity expectations.
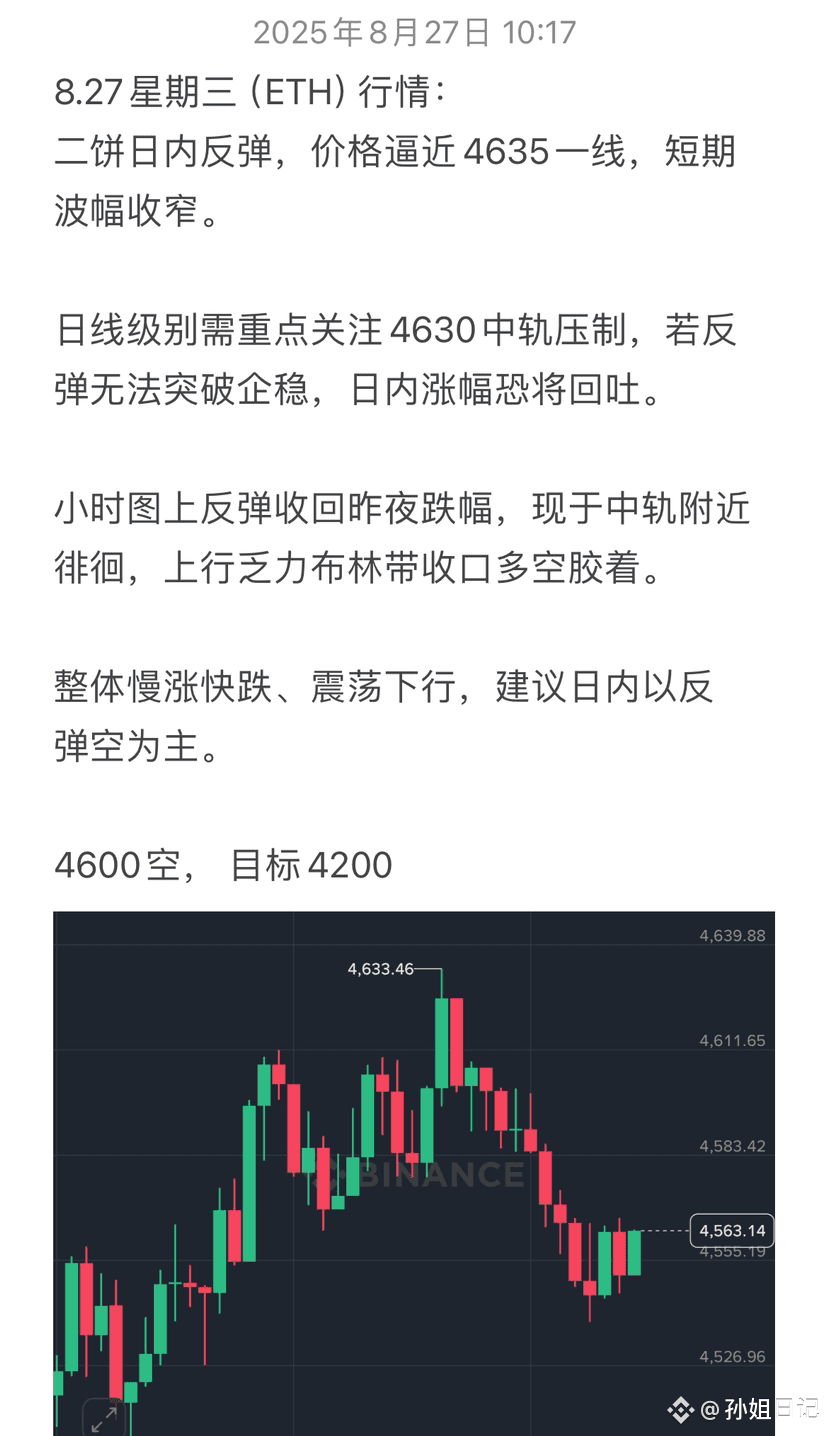
Wednesday, 8.27 (ETH) Market:
The second round has rebounded during the day, with prices approaching the 4635 line, and short-term volatility is narrowing.
On the daily chart, it is crucial to pay attention to the 4630 middle track resistance. If the rebound cannot break through and stabilize, the intraday gains are likely to be given back.
On the hourly chart, the rebound has recovered last night's decline, currently hovering near the middle track, with weak upward momentum and the Bollinger Bands tightening, leading to a tug of war between long and short positions.
Overall, there is a slow rise and quick drop, with a downward fluctuation. It is recommended to focus on short positions during intraday rebounds.
Short at 4600, target 4200.
The second round has rebounded during the day, with prices approaching the 4635 line, and short-term volatility is narrowing.
On the daily chart, it is crucial to pay attention to the 4630 middle track resistance. If the rebound cannot break through and stabilize, the intraday gains are likely to be given back.
On the hourly chart, the rebound has recovered last night's decline, currently hovering near the middle track, with weak upward momentum and the Bollinger Bands tightening, leading to a tug of war between long and short positions.
Overall, there is a slow rise and quick drop, with a downward fluctuation. It is recommended to focus on short positions during intraday rebounds.
Short at 4600, target 4200.
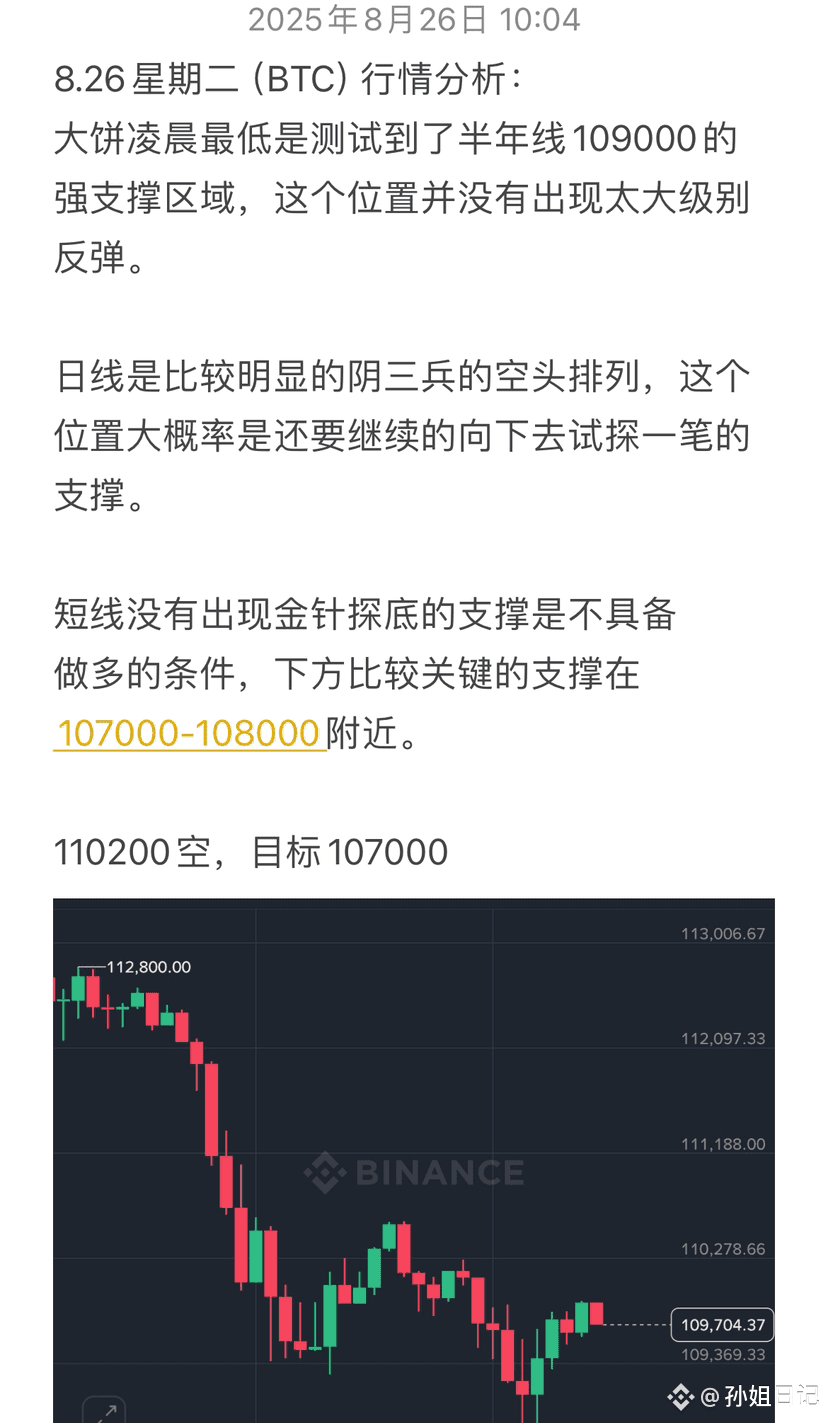
Market Analysis for Tuesday, August 26 (BTC):
Bitcoin's early morning low tested strong support at 109,000, the six-month moving average. This level hasn't seen a significant rebound.
The daily chart shows a clear bearish pattern of three Yin-Yang soldiers. This level is likely to see further downward testing of support.
Without the short-term support of a golden needle bottom, long positions are not feasible. Key support below is around 107,000-108,000.
Short at 110,200, target 107,000.
Bitcoin's early morning low tested strong support at 109,000, the six-month moving average. This level hasn't seen a significant rebound.
The daily chart shows a clear bearish pattern of three Yin-Yang soldiers. This level is likely to see further downward testing of support.
Without the short-term support of a golden needle bottom, long positions are not feasible. Key support below is around 107,000-108,000.
Short at 110,200, target 107,000.
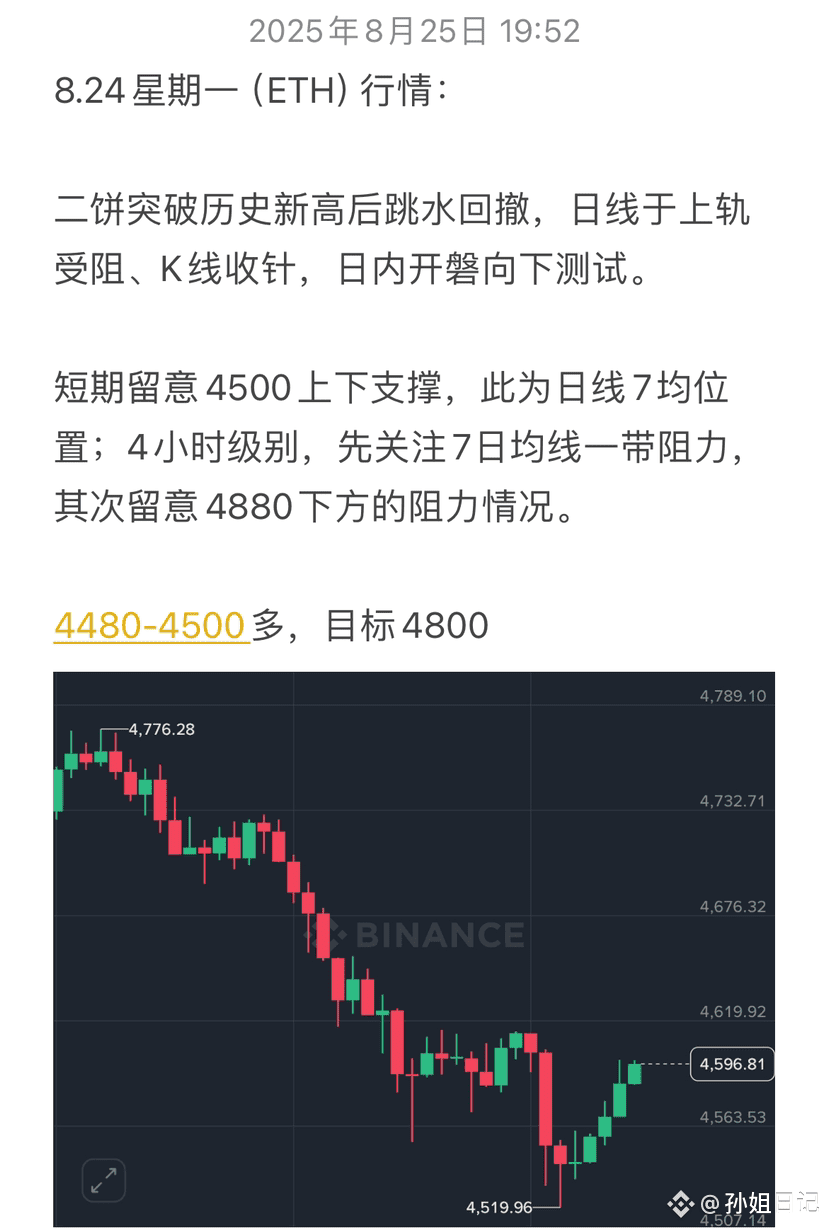
Monday, 8.24 (ETH) Market:
After the second coin broke through its historical high, it plunged back, being blocked at the upper track on the daily line, with the K-line closing as a pin. It opened today testing downwards.
In the short term, pay attention to the support around 4500; this is the position of the 7-day moving average on the daily line. On the 4-hour level, first focus on the resistance around the 7-day moving average, and then observe the resistance situation below 4880.
Buy between 4480-4500, target 4800.
After the second coin broke through its historical high, it plunged back, being blocked at the upper track on the daily line, with the K-line closing as a pin. It opened today testing downwards.
In the short term, pay attention to the support around 4500; this is the position of the 7-day moving average on the daily line. On the 4-hour level, first focus on the resistance around the 7-day moving average, and then observe the resistance situation below 4880.
Buy between 4480-4500, target 4800.
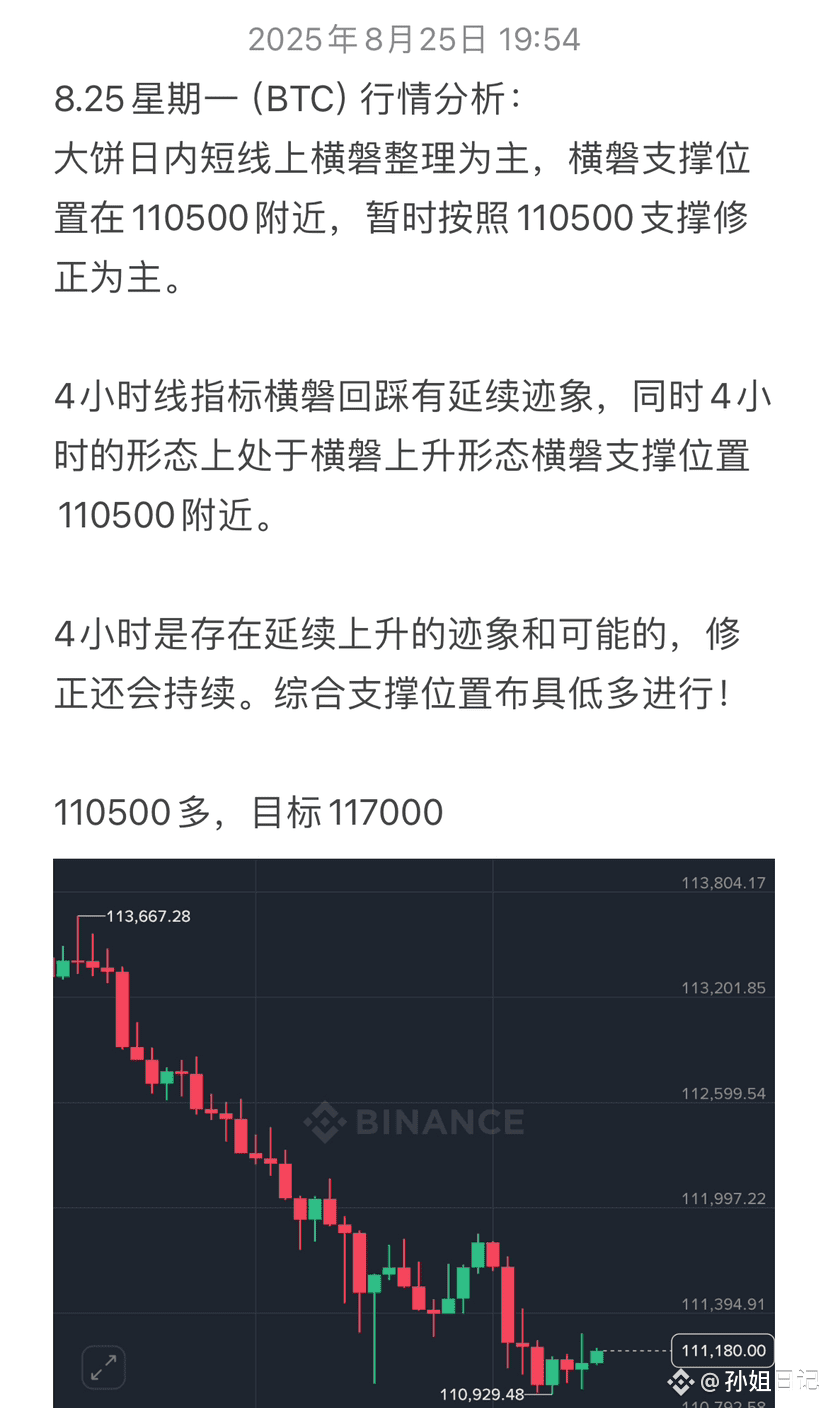
8.25 Monday (BTC) Market Analysis:
The Bitcoin market is primarily consolidating in a sideways manner today, with support around 110,500. For now, the main correction is based on the support at 110,500.
The 4-hour indicators show signs of continued consolidation and the 4-hour pattern is in an upward consolidation shape, with support around 110,500.
There are signs and possibilities of continued upward movement on the 4-hour chart, and the correction will continue. Overall, it's advisable to take a low long position at the support level!
Long at 110,500, target 117,000
The Bitcoin market is primarily consolidating in a sideways manner today, with support around 110,500. For now, the main correction is based on the support at 110,500.
The 4-hour indicators show signs of continued consolidation and the 4-hour pattern is in an upward consolidation shape, with support around 110,500.
There are signs and possibilities of continued upward movement on the 4-hour chart, and the correction will continue. Overall, it's advisable to take a low long position at the support level!
Long at 110,500, target 117,000
Log in to explore more content