
Professor Craig
768 Posts

Professor Craig
Report
Block User
This account shares only Legit Trade Signals and Useful trading Content.
Open Trade
High-Frequency Trader
5.2 Years
3 Following
185 Followers
921 Liked
Posts
Portfolio
All
Quotes
Videos
PINNED
Everyone is welcomed on my chatroom right now.
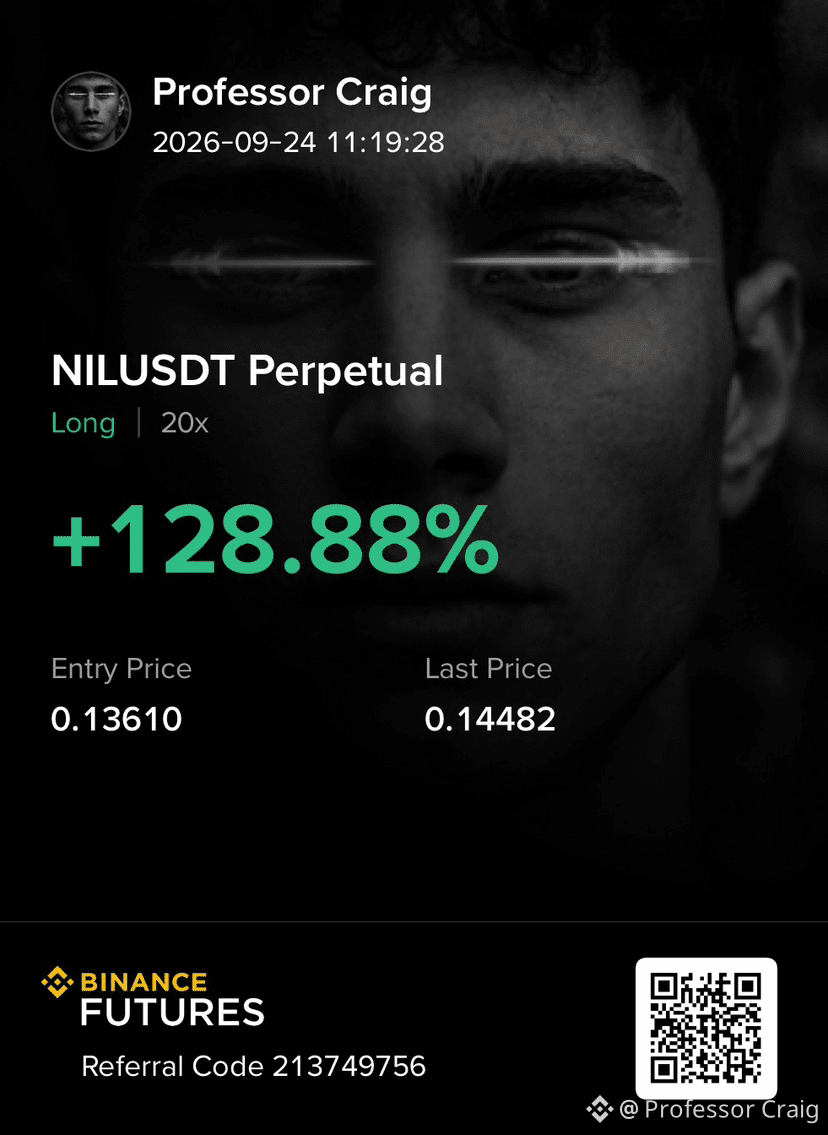
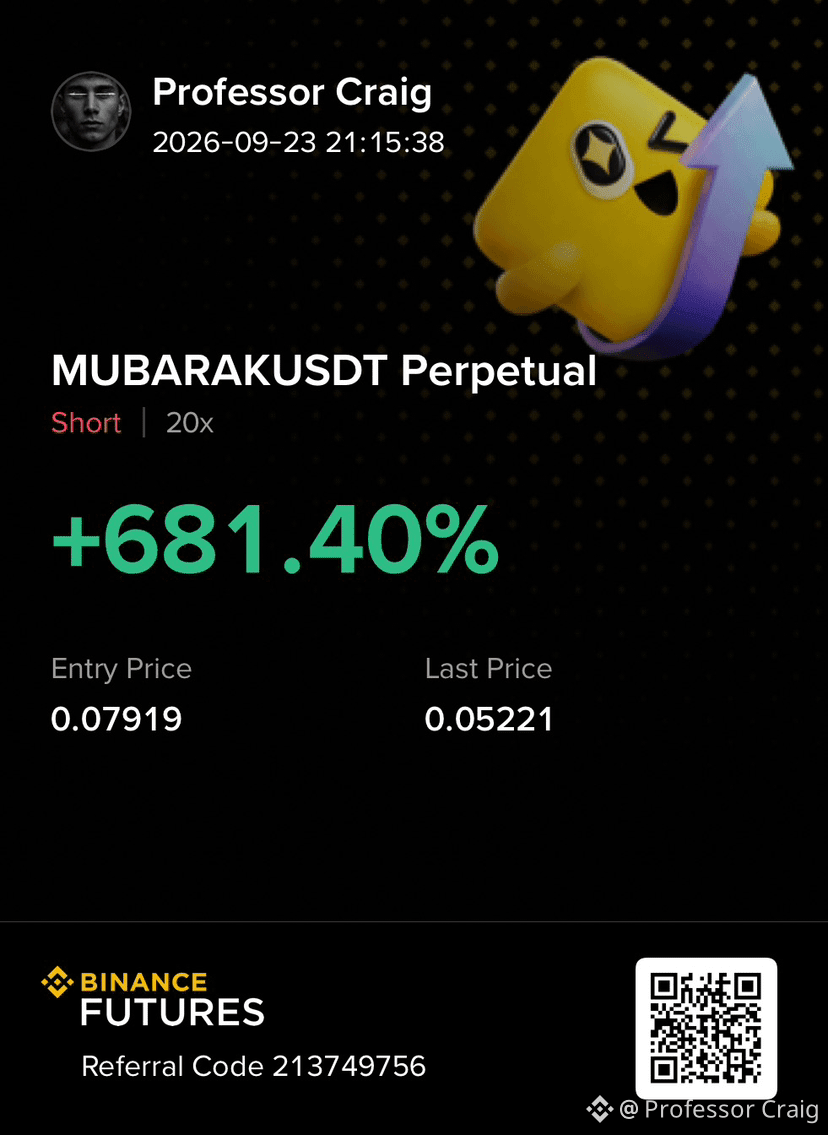
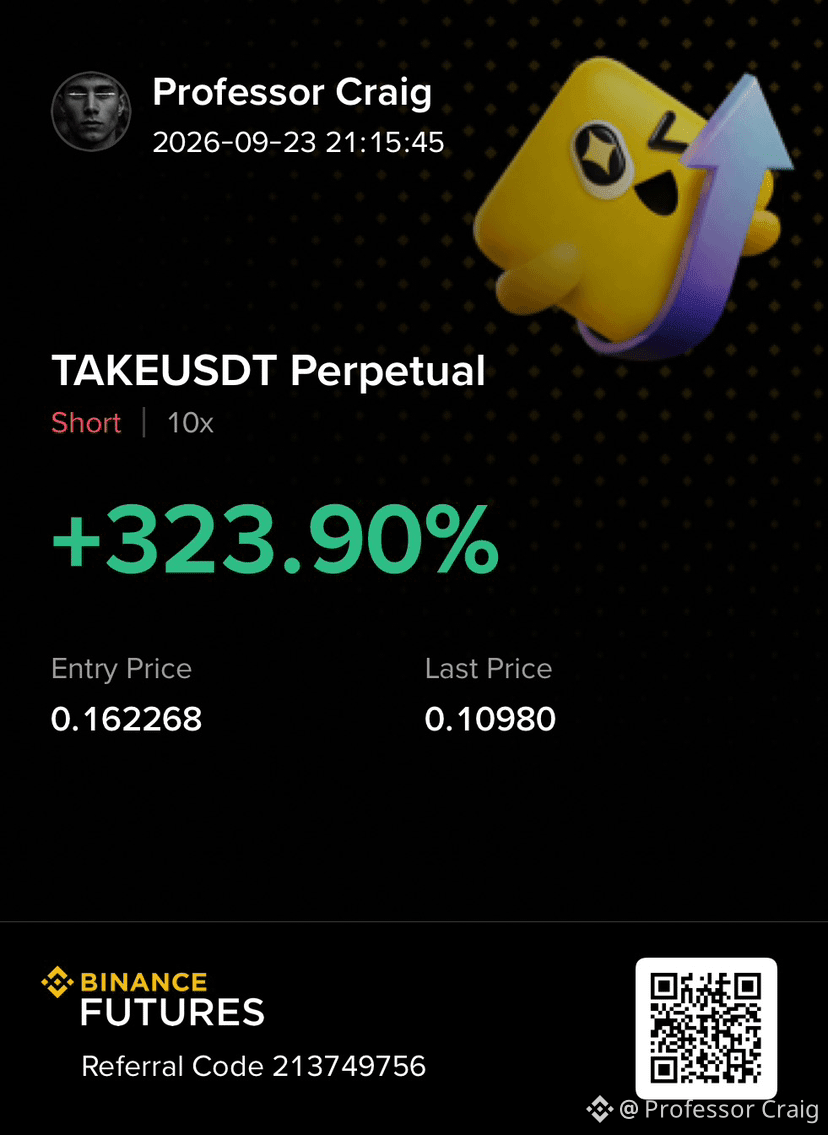
We post only VIP Signals here. Until now Winrate is still 100% and its already been Day 24 and more to go together guys.
Scan this QR or comment down Join to Get in my chatroom.
$NIL $MUBARAK $TAKE
{future}(TAKEUSDT)
{future}(MUBARAKUSDT)
{future}(NILUSDT)
Everyone is welcomed on my chatroom right now.
We post only VIP Signals here. Until now Winrate is still 100% and its already been Day 24 and more to go together guys.
Scan this QR or comment down Join to Get in my chatroom.
$NIL $MUBARAK $TAKE
We post only VIP Signals here. Until now Winrate is still 100% and its already been Day 24 and more to go together guys.
Scan this QR or comment down Join to Get in my chatroom.
$NIL $MUBARAK $TAKE

2
3
70
·
--
Bearish
🚨$ESPORTS /USDT: The Rally Is Losing Strength, Is a Major Correction Next?
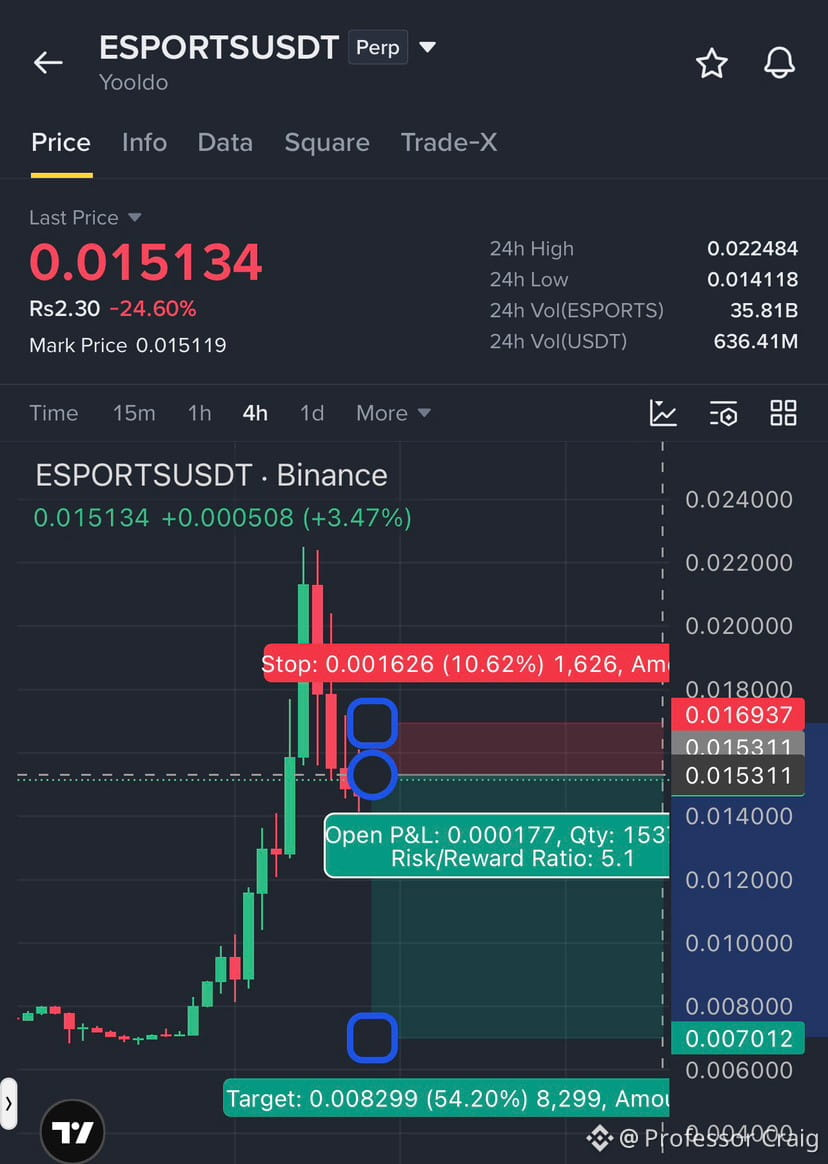
After an explosive rally from the $0.0070 region toward $0.0224, ESPORTS has started showing significant selling pressure. The 4H chart reveals a sharp rejection near the recent high, followed by consecutive bearish candles and a decline of approximately 24.60% in the last 24 hours. This indicates that buyers are losing control after the massive upward move.
Currently trading around $0.01513, the price is attempting a small recovery, but this bounce is not enough to change the overall short-term structure. The $0.0153-$0.0160 region is an important resistance zone. If the price fails to reclaim this area, another bearish move could develop. A stronger rejection below $0.0169 would further support the downside setup. On the downside, $0.0141 is the first important support to watch. Losing this level could open the door toward $0.0120, followed by $0.0100 and potentially $0.0080. The larger downside target sits near $0.0070, which is also close to the previous consolidation area before the massive rally.
Short Trading Plan: 📉
Entry: $0.0151-$0.0153
Stop Loss: $0.016937
TP1: $0.0120
TP2: $0.0100
TP3: $0.0080
Final Target: $0.007012
The risk/reward structure offers approximately 5.1R toward the marked final target. My bias remains bearish while the price stays below the $0.0169 resistance. Do you think ESPORTS will revisit $0.007 before attempting another major rally?
Guys, we need to focus on $AIN & $LSK also, so i will be dropping the analysis post about these two very soon.
{future}(LSKUSDT)
{future}(AINUSDT)
{future}(ESPORTSUSDT)
#esportsusdt #AINUSDT #LSKUSDT
🚨$ESPORTS /USDT: The Rally Is Losing Strength, Is a Major Correction Next?
After an explosive rally from the $0.0070 region toward $0.0224, ESPORTS has started showing significant selling pressure. The 4H chart reveals a sharp rejection near the recent high, followed by consecutive bearish candles and a decline of approximately 24.60% in the last 24 hours. This indicates that buyers are losing control after the massive upward move.
Currently trading around $0.01513, the price is attempting a small recovery, but this bounce is not enough to change the overall short-term structure. The $0.0153-$0.0160 region is an important resistance zone. If the price fails to reclaim this area, another bearish move could develop. A stronger rejection below $0.0169 would further support the downside setup. On the downside, $0.0141 is the first important support to watch. Losing this level could open the door toward $0.0120, followed by $0.0100 and potentially $0.0080. The larger downside target sits near $0.0070, which is also close to the previous consolidation area before the massive rally.
Short Trading Plan: 📉
Entry: $0.0151-$0.0153
Stop Loss: $0.016937
TP1: $0.0120
TP2: $0.0100
TP3: $0.0080
Final Target: $0.007012
The risk/reward structure offers approximately 5.1R toward the marked final target. My bias remains bearish while the price stays below the $0.0169 resistance. Do you think ESPORTS will revisit $0.007 before attempting another major rally?
Guys, we need to focus on $AIN & $LSK also, so i will be dropping the analysis post about these two very soon.
#esportsusdt #AINUSDT #LSKUSDT
After an explosive rally from the $0.0070 region toward $0.0224, ESPORTS has started showing significant selling pressure. The 4H chart reveals a sharp rejection near the recent high, followed by consecutive bearish candles and a decline of approximately 24.60% in the last 24 hours. This indicates that buyers are losing control after the massive upward move.
Currently trading around $0.01513, the price is attempting a small recovery, but this bounce is not enough to change the overall short-term structure. The $0.0153-$0.0160 region is an important resistance zone. If the price fails to reclaim this area, another bearish move could develop. A stronger rejection below $0.0169 would further support the downside setup. On the downside, $0.0141 is the first important support to watch. Losing this level could open the door toward $0.0120, followed by $0.0100 and potentially $0.0080. The larger downside target sits near $0.0070, which is also close to the previous consolidation area before the massive rally.
Short Trading Plan: 📉
Entry: $0.0151-$0.0153
Stop Loss: $0.016937
TP1: $0.0120
TP2: $0.0100
TP3: $0.0080
Final Target: $0.007012
The risk/reward structure offers approximately 5.1R toward the marked final target. My bias remains bearish while the price stays below the $0.0169 resistance. Do you think ESPORTS will revisit $0.007 before attempting another major rally?
Guys, we need to focus on $AIN & $LSK also, so i will be dropping the analysis post about these two very soon.
#esportsusdt #AINUSDT #LSKUSDT
1
86
·
--
Bearish
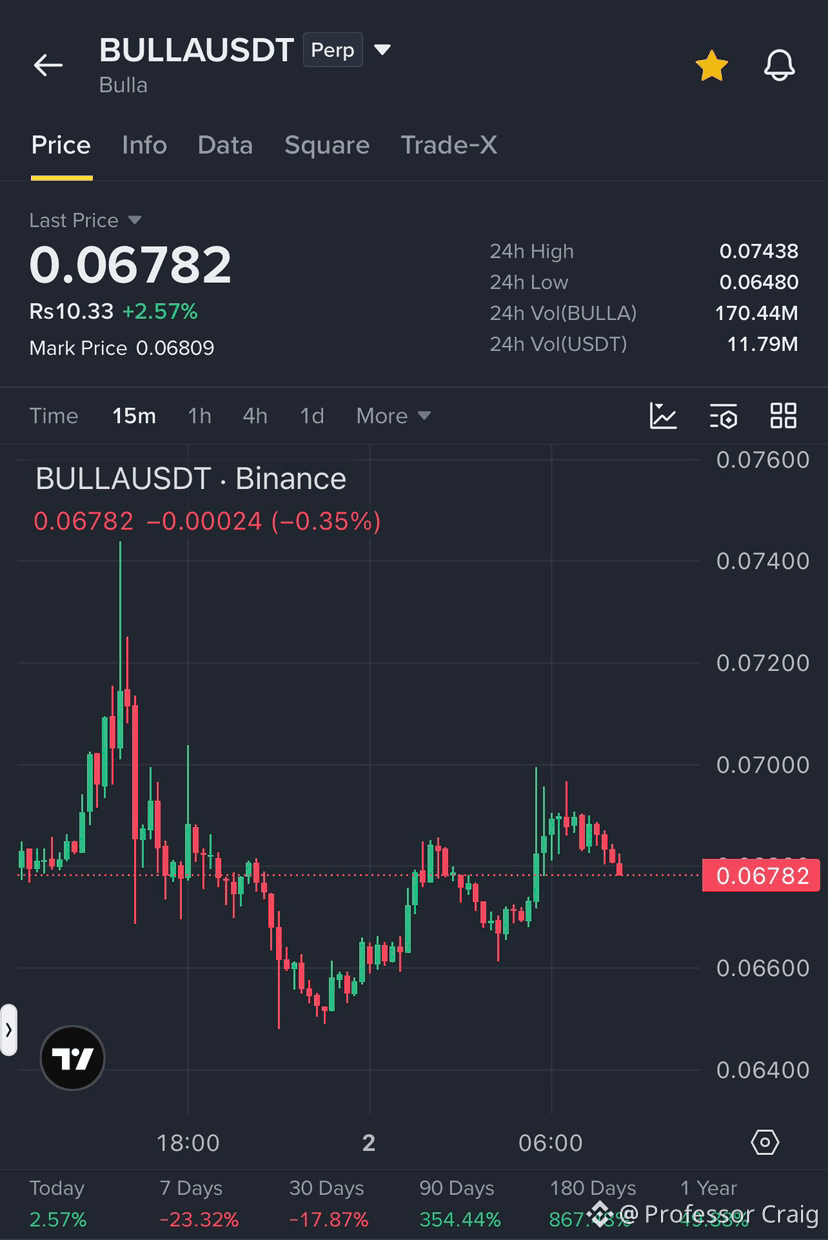
🚨$BULLA is showing signs of weakening after its recent recovery. Can sellers push it back toward the $0.065 support zone?
It is currently trading around $0.06782, up 2.57% over the last 24 hours. However, the 15-minute chart shows that bullish momentum is losing strength after failing to maintain its recovery toward the $0.0690-$0.0700 resistance area. Looking at the recent price action, it initially experienced a strong upward move toward $0.0740 before facing heavy selling pressure. This resulted in a sharp correction toward $0.0650-$0.0660. Buyers eventually stepped in and pushed the price higher, but the latest candles show another rejection near $0.0690.
My short-term view is slightly bearish. The price is currently struggling to maintain its upward momentum, and sellers are beginning to put pressure on the recovery. If BULLA loses the $0.0670 support, the next important downside levels are around $0.0660 and $0.0650. A stronger breakdown could bring the price closer to the 24-hour low of $0.06480. On the other hand, buyers still have an opportunity to regain control. A strong move above $0.0690 could open the door toward $0.0700 and potentially $0.0720. Until that happens, I would be cautious about chasing long positions.
Short Trading Plan
Entry: $0.0680 - $0.0686
TP1: $0.0670
TP2: $0.0660
TP3: $0.0650
Stop Loss: $0.0696
The main level I am watching is $0.0670. Losing this support would strengthen the bearish setup, while reclaiming $0.0690 would weaken it.
What do you think? Will BULLA revisit $0.0650, or can buyers push it back above $0.0700?
{future}(BULLAUSDT)
🚨$BULLA is showing signs of weakening after its recent recovery. Can sellers push it back toward the $0.065 support zone?
It is currently trading around $0.06782, up 2.57% over the last 24 hours. However, the 15-minute chart shows that bullish momentum is losing strength after failing to maintain its recovery toward the $0.0690-$0.0700 resistance area. Looking at the recent price action, it initially experienced a strong upward move toward $0.0740 before facing heavy selling pressure. This resulted in a sharp correction toward $0.0650-$0.0660. Buyers eventually stepped in and pushed the price higher, but the latest candles show another rejection near $0.0690.
My short-term view is slightly bearish. The price is currently struggling to maintain its upward momentum, and sellers are beginning to put pressure on the recovery. If BULLA loses the $0.0670 support, the next important downside levels are around $0.0660 and $0.0650. A stronger breakdown could bring the price closer to the 24-hour low of $0.06480. On the other hand, buyers still have an opportunity to regain control. A strong move above $0.0690 could open the door toward $0.0700 and potentially $0.0720. Until that happens, I would be cautious about chasing long positions.
Short Trading Plan
Entry: $0.0680 - $0.0686
TP1: $0.0670
TP2: $0.0660
TP3: $0.0650
Stop Loss: $0.0696
The main level I am watching is $0.0670. Losing this support would strengthen the bearish setup, while reclaiming $0.0690 would weaken it.
What do you think? Will BULLA revisit $0.0650, or can buyers push it back above $0.0700?
It is currently trading around $0.06782, up 2.57% over the last 24 hours. However, the 15-minute chart shows that bullish momentum is losing strength after failing to maintain its recovery toward the $0.0690-$0.0700 resistance area. Looking at the recent price action, it initially experienced a strong upward move toward $0.0740 before facing heavy selling pressure. This resulted in a sharp correction toward $0.0650-$0.0660. Buyers eventually stepped in and pushed the price higher, but the latest candles show another rejection near $0.0690.
My short-term view is slightly bearish. The price is currently struggling to maintain its upward momentum, and sellers are beginning to put pressure on the recovery. If BULLA loses the $0.0670 support, the next important downside levels are around $0.0660 and $0.0650. A stronger breakdown could bring the price closer to the 24-hour low of $0.06480. On the other hand, buyers still have an opportunity to regain control. A strong move above $0.0690 could open the door toward $0.0700 and potentially $0.0720. Until that happens, I would be cautious about chasing long positions.
Short Trading Plan
Entry: $0.0680 - $0.0686
TP1: $0.0670
TP2: $0.0660
TP3: $0.0650
Stop Loss: $0.0696
The main level I am watching is $0.0670. Losing this support would strengthen the bearish setup, while reclaiming $0.0690 would weaken it.
What do you think? Will BULLA revisit $0.0650, or can buyers push it back above $0.0700?
1
118
·
--
Bullish
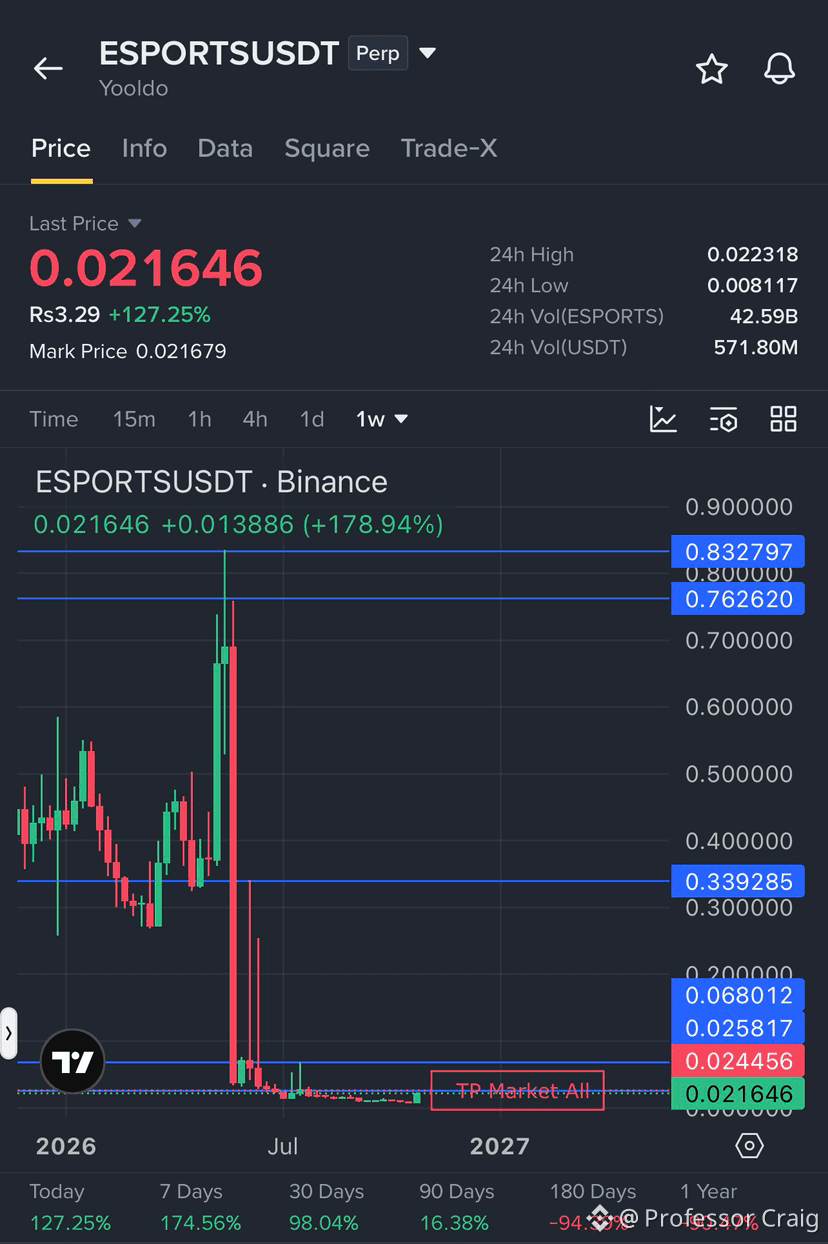
There are levels on this game and most of you still don’t understand this system.
$ESPORTS has already secured a high celing way before we had even realized and now just from +100% gains, people are going mad crazy thinking that this token will cross zero and move to 0.1$ and more. 🙄
Chill bruh, its a crypto and things don’t work that way, that happens only in 0.000001% Case and thats nor happening here, tokens need to burn, caps need to be uplifted, demands and Attention need to be balanced equally. Lots of thing need to go in that way to secure that type of gains so, chill my delusional brothers and sisters.
I agree $ESPORTS will go bullish and Can secure impressive gains but don’t be greedy by looking for 1$ zone or that kinda of stupid target.
If you want to listen my honest suggestion, just Start selling partially like around 20-25 percent and set your target around 0.024$ to 0.027$ and don’t even think above that guys, that would be insanity and stupidity at max.
{future}(ESPORTSUSDT)
There are levels on this game and most of you still don’t understand this system.
$ESPORTS has already secured a high celing way before we had even realized and now just from +100% gains, people are going mad crazy thinking that this token will cross zero and move to 0.1$ and more. 🙄
Chill bruh, its a crypto and things don’t work that way, that happens only in 0.000001% Case and thats nor happening here, tokens need to burn, caps need to be uplifted, demands and Attention need to be balanced equally. Lots of thing need to go in that way to secure that type of gains so, chill my delusional brothers and sisters.
I agree $ESPORTS will go bullish and Can secure impressive gains but don’t be greedy by looking for 1$ zone or that kinda of stupid target.
If you want to listen my honest suggestion, just Start selling partially like around 20-25 percent and set your target around 0.024$ to 0.027$ and don’t even think above that guys, that would be insanity and stupidity at max.
$ESPORTS has already secured a high celing way before we had even realized and now just from +100% gains, people are going mad crazy thinking that this token will cross zero and move to 0.1$ and more. 🙄
Chill bruh, its a crypto and things don’t work that way, that happens only in 0.000001% Case and thats nor happening here, tokens need to burn, caps need to be uplifted, demands and Attention need to be balanced equally. Lots of thing need to go in that way to secure that type of gains so, chill my delusional brothers and sisters.
I agree $ESPORTS will go bullish and Can secure impressive gains but don’t be greedy by looking for 1$ zone or that kinda of stupid target.
If you want to listen my honest suggestion, just Start selling partially like around 20-25 percent and set your target around 0.024$ to 0.027$ and don’t even think above that guys, that would be insanity and stupidity at max.
1
2
66
·
--
Bullish
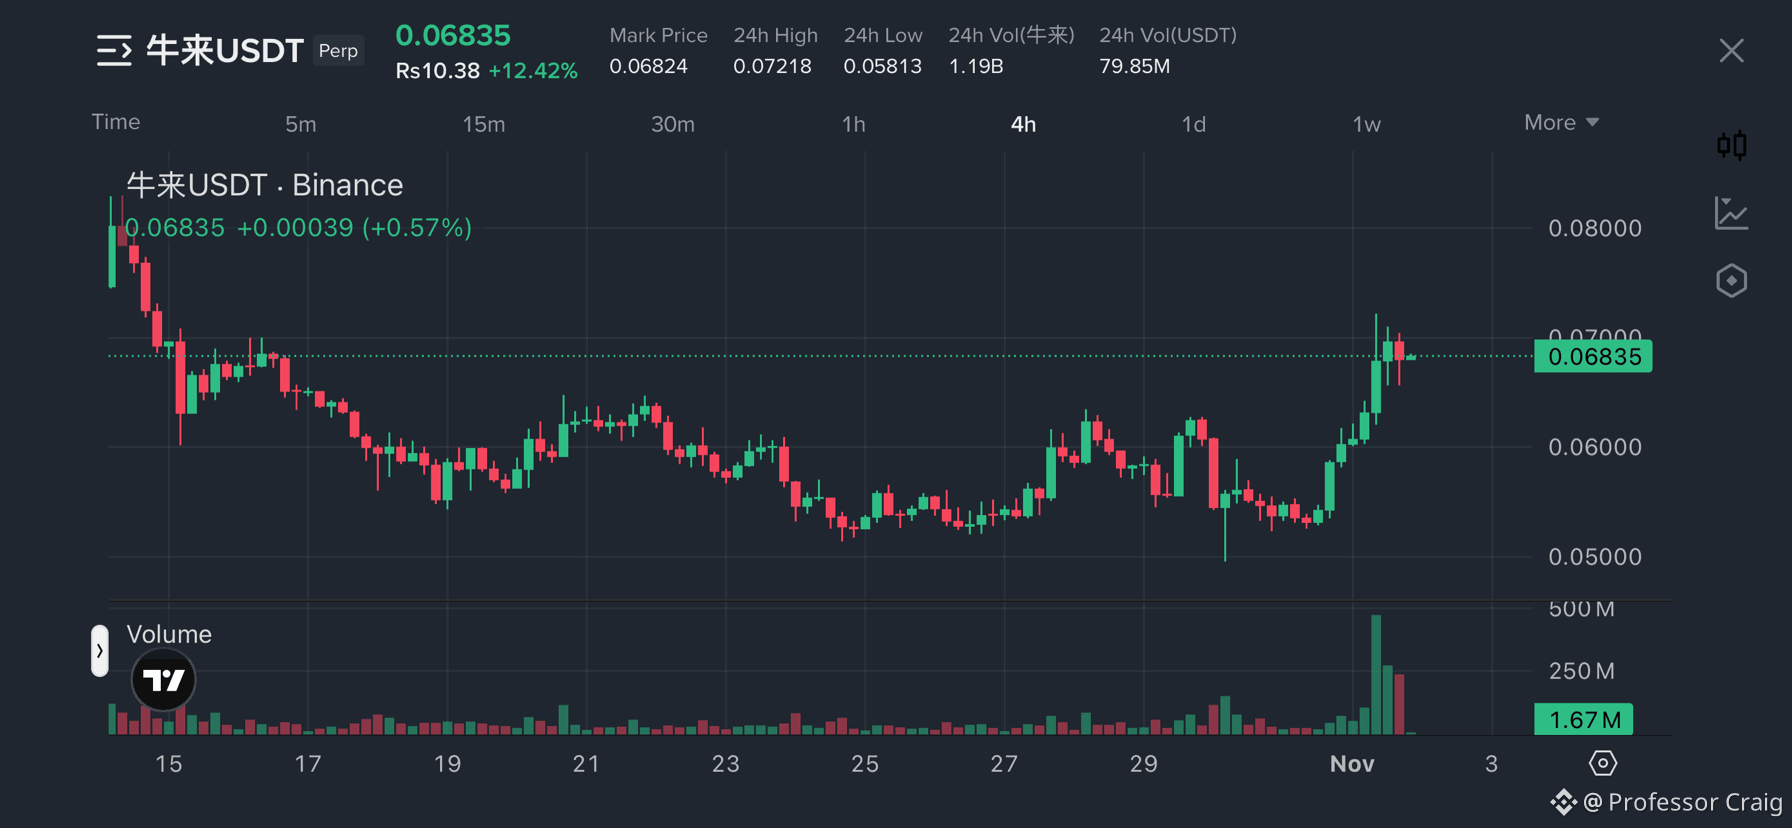
🚨 $牛来 is showing a strong bullish recovery after weeks of consolidation. Is this the beginning of a bigger move?
The 4H chart is showing a clear change in momentum. After spending several weeks trading inside a relatively narrow range between $0.052 and $0.063, it has finally started pushing higher with a strong breakout. The price is currently around $0.06835, up approximately 12.42% over the last 24 hours.
What makes this move interesting is the sudden increase in trading volume. The breakout was supported by a significant volume spike, suggesting that buying activity has increased considerably. This is an important development because the previous price action was mostly sideways, without enough momentum to establish a strong upward trend. Now, the immediate resistance sits around $0.07000-$0.07218. This is the area where sellers have already started responding after the recent upward move. A strong 4H close above $0.07218 would be an important development and could open the door toward $0.07500 and potentially $0.08000.
On the downside, $0.06500-$0.06600 is the first important support zone. As long as it maintains this area, the bullish structure remains healthy. A deeper correction toward $0.06000 would also be worth watching if selling pressure increases.
My outlook: The overall momentum has shifted in favor of buyers. The recent volume expansion and breakout from consolidation make this chart interesting. However, holding above the breakout area is important to sustain the rally.
The big question now is whether buyers have enough strength to push through $0.07218 and establish a new higher trading range.
Wanna open long? Click here 👉 $牛来 👈
{future}(牛来USDT)
#牛来 #WithdrawalsBack: 15 networks live #BinanceUpdatesProofofReservesAddresses
🚨 $牛来 is showing a strong bullish recovery after weeks of consolidation. Is this the beginning of a bigger move?
The 4H chart is showing a clear change in momentum. After spending several weeks trading inside a relatively narrow range between $0.052 and $0.063, it has finally started pushing higher with a strong breakout. The price is currently around $0.06835, up approximately 12.42% over the last 24 hours.
What makes this move interesting is the sudden increase in trading volume. The breakout was supported by a significant volume spike, suggesting that buying activity has increased considerably. This is an important development because the previous price action was mostly sideways, without enough momentum to establish a strong upward trend. Now, the immediate resistance sits around $0.07000-$0.07218. This is the area where sellers have already started responding after the recent upward move. A strong 4H close above $0.07218 would be an important development and could open the door toward $0.07500 and potentially $0.08000.
On the downside, $0.06500-$0.06600 is the first important support zone. As long as it maintains this area, the bullish structure remains healthy. A deeper correction toward $0.06000 would also be worth watching if selling pressure increases.
My outlook: The overall momentum has shifted in favor of buyers. The recent volume expansion and breakout from consolidation make this chart interesting. However, holding above the breakout area is important to sustain the rally.
The big question now is whether buyers have enough strength to push through $0.07218 and establish a new higher trading range.
Wanna open long? Click here 👉 $牛来 👈
#牛来 #WithdrawalsBack: 15 networks live #BinanceUpdatesProofofReservesAddresses
The 4H chart is showing a clear change in momentum. After spending several weeks trading inside a relatively narrow range between $0.052 and $0.063, it has finally started pushing higher with a strong breakout. The price is currently around $0.06835, up approximately 12.42% over the last 24 hours.
What makes this move interesting is the sudden increase in trading volume. The breakout was supported by a significant volume spike, suggesting that buying activity has increased considerably. This is an important development because the previous price action was mostly sideways, without enough momentum to establish a strong upward trend. Now, the immediate resistance sits around $0.07000-$0.07218. This is the area where sellers have already started responding after the recent upward move. A strong 4H close above $0.07218 would be an important development and could open the door toward $0.07500 and potentially $0.08000.
On the downside, $0.06500-$0.06600 is the first important support zone. As long as it maintains this area, the bullish structure remains healthy. A deeper correction toward $0.06000 would also be worth watching if selling pressure increases.
My outlook: The overall momentum has shifted in favor of buyers. The recent volume expansion and breakout from consolidation make this chart interesting. However, holding above the breakout area is important to sustain the rally.
The big question now is whether buyers have enough strength to push through $0.07218 and establish a new higher trading range.
Wanna open long? Click here 👉 $牛来 👈
#牛来 #WithdrawalsBack: 15 networks live #BinanceUpdatesProofofReservesAddresses
1
32
·
--
Bearish
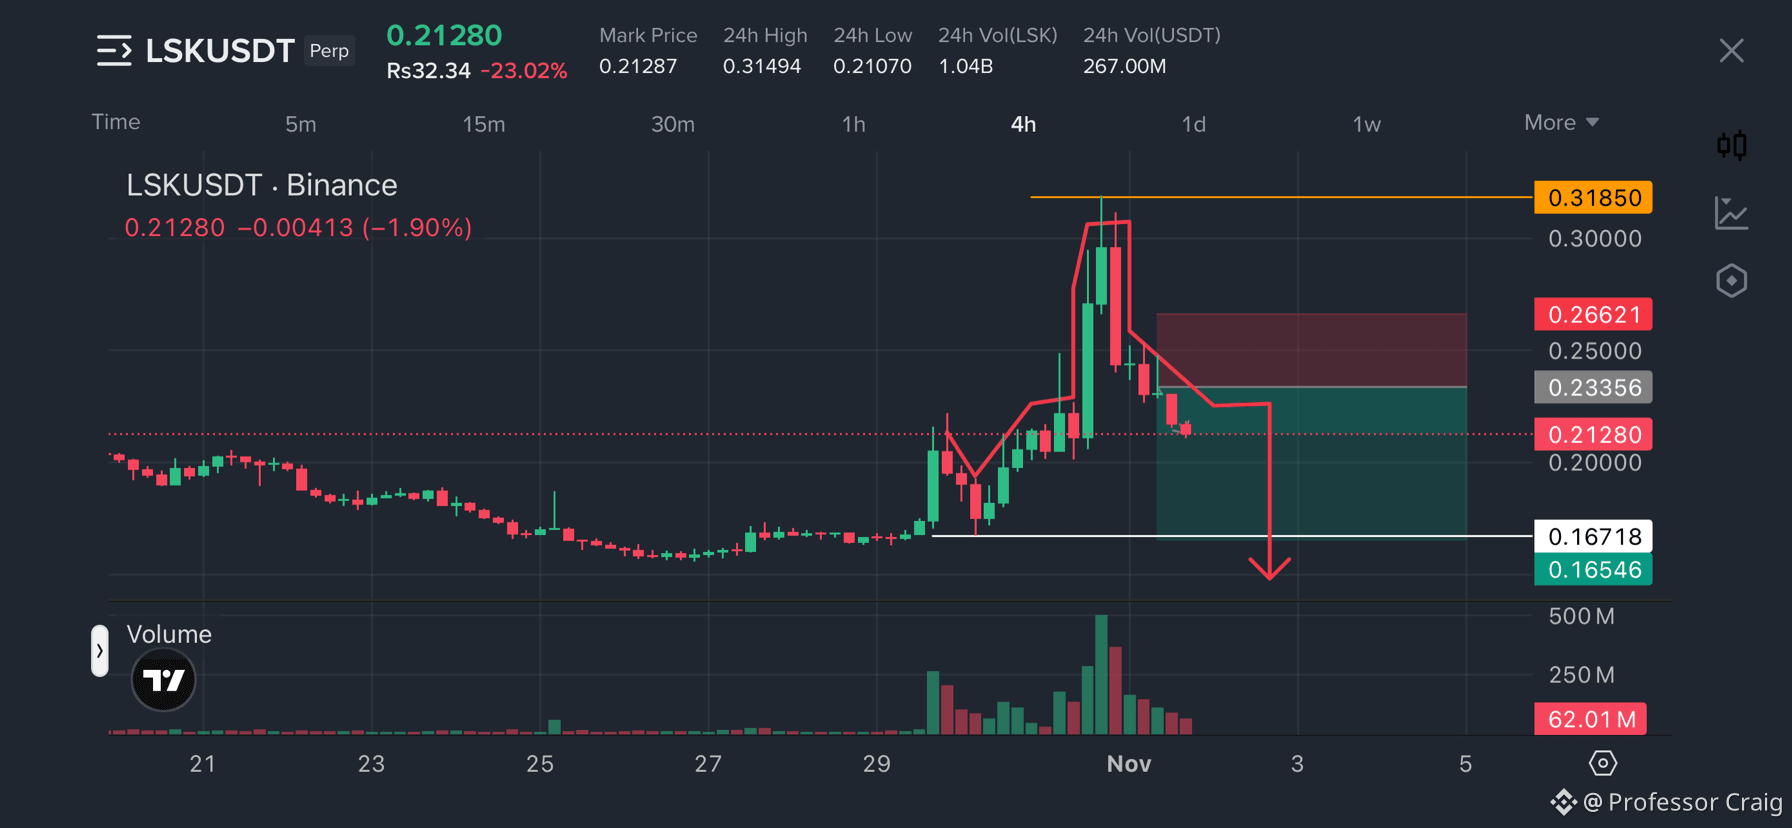
🚨$LSK USDT: Sharp Rejection From $0.3185! Is Another Major Drop Coming?
It has turned sharply bearish after failing to sustain its massive upward move toward $0.3185. The 4H chart is showing a clear shift in momentum, with strong selling pressure entering after the rejection and price now trading around $0.2128.
What makes this structure concerning for buyers is the way price has fallen from its recent peak. After the rejection, it started forming lower highs and lower lows, while consecutive red candles showed that sellers were taking control. The increased trading volume during the sharp move also suggests that this is more than just a minor pullback. The $0.2335 area is now an important resistance zone. If price attempts a recovery toward this level but fails to reclaim it, another bearish move becomes increasingly likely. On the downside, $0.2000 is an important psychological level, but the bigger target sits around $0.1671-$0.1654, which was previously an important consolidation area.
Short Trading Plan:📉
Entry: $0.2335
SL: $0.2662
TP1: $0.2000
TP2: $0.1850
TP3: $0.1671-$0.1654
My bias remains bearish as long as it stays below the $0.2335 resistance zone. I would rather look for a recovery toward resistance to enter a short position instead of chasing the price after such a significant drop. The next few 4H candles will be important. Can buyers recover the lost momentum, or will sellers push it toward the $0.1650 region?
What do you think, another leg down for LSK?
Watchout for $AIN & $BLESS down trend is coming strong guys.👀
{future}(BLESSUSDT)
{future}(AINUSDT)
{future}(LSKUSDT)
#lskusdt #AINUSDT #BLESSUSDT
🚨$LSK USDT: Sharp Rejection From $0.3185! Is Another Major Drop Coming?
It has turned sharply bearish after failing to sustain its massive upward move toward $0.3185. The 4H chart is showing a clear shift in momentum, with strong selling pressure entering after the rejection and price now trading around $0.2128.
What makes this structure concerning for buyers is the way price has fallen from its recent peak. After the rejection, it started forming lower highs and lower lows, while consecutive red candles showed that sellers were taking control. The increased trading volume during the sharp move also suggests that this is more than just a minor pullback. The $0.2335 area is now an important resistance zone. If price attempts a recovery toward this level but fails to reclaim it, another bearish move becomes increasingly likely. On the downside, $0.2000 is an important psychological level, but the bigger target sits around $0.1671-$0.1654, which was previously an important consolidation area.
Short Trading Plan:📉
Entry: $0.2335
SL: $0.2662
TP1: $0.2000
TP2: $0.1850
TP3: $0.1671-$0.1654
My bias remains bearish as long as it stays below the $0.2335 resistance zone. I would rather look for a recovery toward resistance to enter a short position instead of chasing the price after such a significant drop. The next few 4H candles will be important. Can buyers recover the lost momentum, or will sellers push it toward the $0.1650 region?
What do you think, another leg down for LSK?
Watchout for $AIN & $BLESS down trend is coming strong guys.👀
#lskusdt #AINUSDT #BLESSUSDT
It has turned sharply bearish after failing to sustain its massive upward move toward $0.3185. The 4H chart is showing a clear shift in momentum, with strong selling pressure entering after the rejection and price now trading around $0.2128.
What makes this structure concerning for buyers is the way price has fallen from its recent peak. After the rejection, it started forming lower highs and lower lows, while consecutive red candles showed that sellers were taking control. The increased trading volume during the sharp move also suggests that this is more than just a minor pullback. The $0.2335 area is now an important resistance zone. If price attempts a recovery toward this level but fails to reclaim it, another bearish move becomes increasingly likely. On the downside, $0.2000 is an important psychological level, but the bigger target sits around $0.1671-$0.1654, which was previously an important consolidation area.
Short Trading Plan:📉
Entry: $0.2335
SL: $0.2662
TP1: $0.2000
TP2: $0.1850
TP3: $0.1671-$0.1654
My bias remains bearish as long as it stays below the $0.2335 resistance zone. I would rather look for a recovery toward resistance to enter a short position instead of chasing the price after such a significant drop. The next few 4H candles will be important. Can buyers recover the lost momentum, or will sellers push it toward the $0.1650 region?
What do you think, another leg down for LSK?
Watchout for $AIN & $BLESS down trend is coming strong guys.👀
#lskusdt #AINUSDT #BLESSUSDT
74
·
--
Bullish
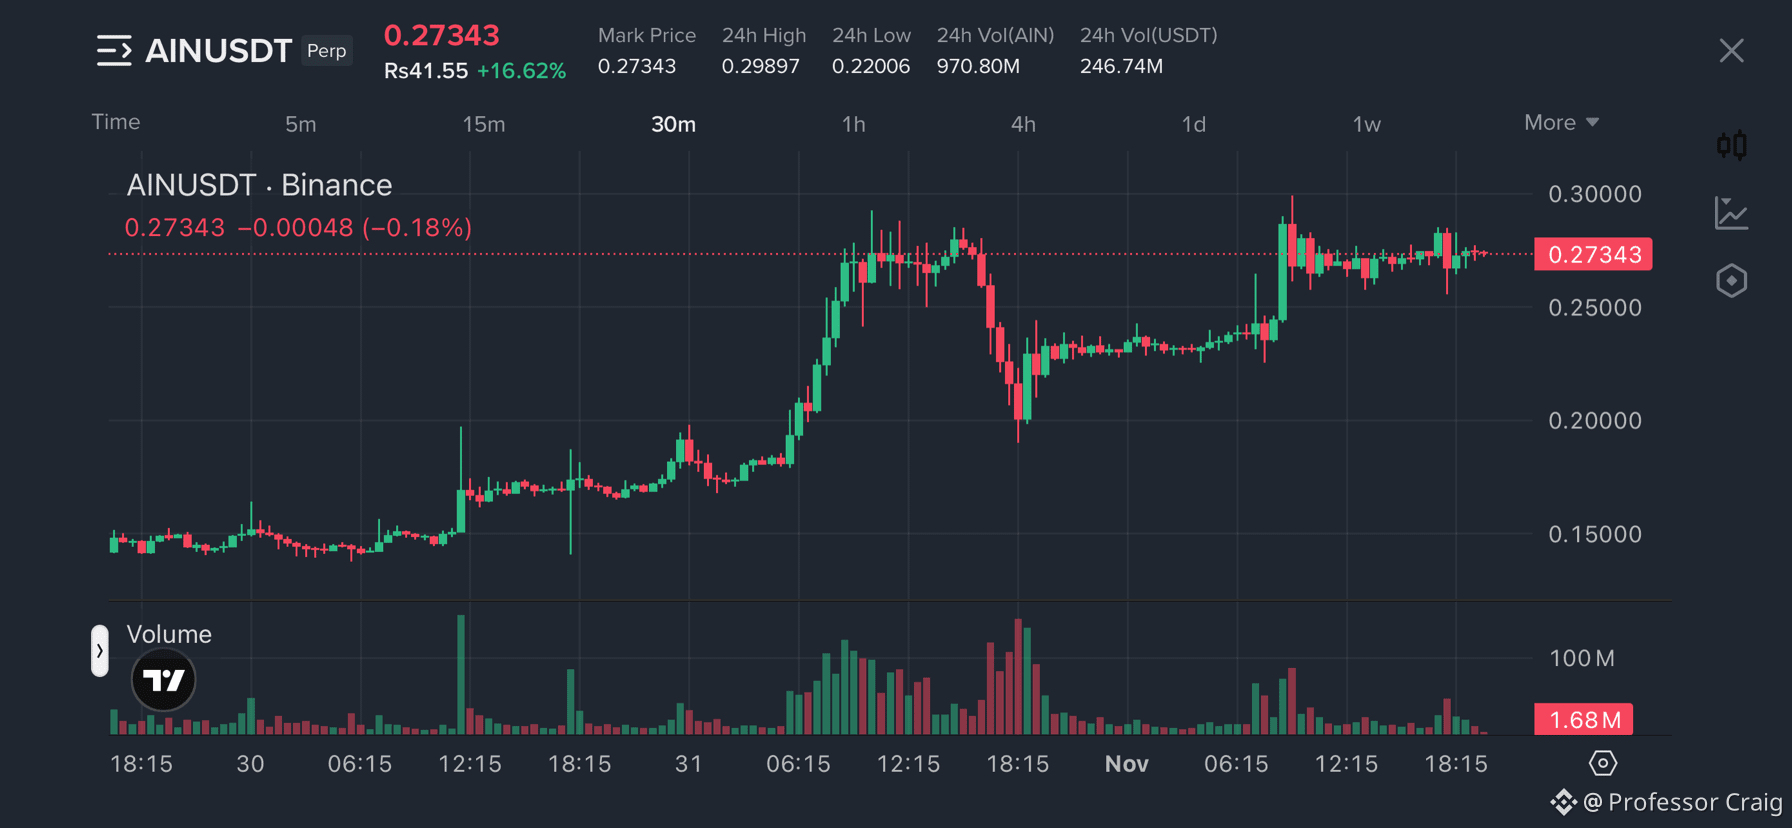
🚨$AIN /USDT is holding strong after a massive 16% rally. Is another breakout coming?
On the 30 minute chart, buyers have managed to establish a new trading range around $0.26-$0.27. This is an important development because the market is showing signs of consolidation rather than an immediate reversal. Volume also increased significantly during the initial upward move, suggesting strong trading activity behind the rally. as long as AIN maintains support around $0.26, the bullish structure remains attractive. A strong breakout above $0.28 could open the door for another attempt toward $0.30. If buyers manage to push through that level with increasing volume, we could see another expansion in price.
Long Trading Plan 📈
Entry: $0.2650-$0.2750
TP1: $0.2850
TP2: $0.2950
TP3: $0.3100
Stop Loss: $0.2550
The biggest thing I am watching right now is how price behaves around the current consolidation zone. After such a strong rally, holding these levels would be a positive signal for buyers. AIN has already attracted considerable market attention, and another volume-supported breakout could bring even more momentum.
Do you think AIN can break above $0.30 and continue its bullish run?
Anyways guys, keep an watch at $ESPORTS & $G also you guys can check my analysis, it will be helpful for sure.
{future}(GUSDT)
{future}(ESPORTSUSDT)
{future}(AINUSDT)
#ainusdt #esports #GUSDT
🚨$AIN /USDT is holding strong after a massive 16% rally. Is another breakout coming?
On the 30 minute chart, buyers have managed to establish a new trading range around $0.26-$0.27. This is an important development because the market is showing signs of consolidation rather than an immediate reversal. Volume also increased significantly during the initial upward move, suggesting strong trading activity behind the rally. as long as AIN maintains support around $0.26, the bullish structure remains attractive. A strong breakout above $0.28 could open the door for another attempt toward $0.30. If buyers manage to push through that level with increasing volume, we could see another expansion in price.
Long Trading Plan 📈
Entry: $0.2650-$0.2750
TP1: $0.2850
TP2: $0.2950
TP3: $0.3100
Stop Loss: $0.2550
The biggest thing I am watching right now is how price behaves around the current consolidation zone. After such a strong rally, holding these levels would be a positive signal for buyers. AIN has already attracted considerable market attention, and another volume-supported breakout could bring even more momentum.
Do you think AIN can break above $0.30 and continue its bullish run?
Anyways guys, keep an watch at $ESPORTS & $G also you guys can check my analysis, it will be helpful for sure.
#ainusdt #esports #GUSDT
On the 30 minute chart, buyers have managed to establish a new trading range around $0.26-$0.27. This is an important development because the market is showing signs of consolidation rather than an immediate reversal. Volume also increased significantly during the initial upward move, suggesting strong trading activity behind the rally. as long as AIN maintains support around $0.26, the bullish structure remains attractive. A strong breakout above $0.28 could open the door for another attempt toward $0.30. If buyers manage to push through that level with increasing volume, we could see another expansion in price.
Long Trading Plan 📈
Entry: $0.2650-$0.2750
TP1: $0.2850
TP2: $0.2950
TP3: $0.3100
Stop Loss: $0.2550
The biggest thing I am watching right now is how price behaves around the current consolidation zone. After such a strong rally, holding these levels would be a positive signal for buyers. AIN has already attracted considerable market attention, and another volume-supported breakout could bring even more momentum.
Do you think AIN can break above $0.30 and continue its bullish run?
Anyways guys, keep an watch at $ESPORTS & $G also you guys can check my analysis, it will be helpful for sure.
#ainusdt #esports #GUSDT
1
71
·
--
Bullish
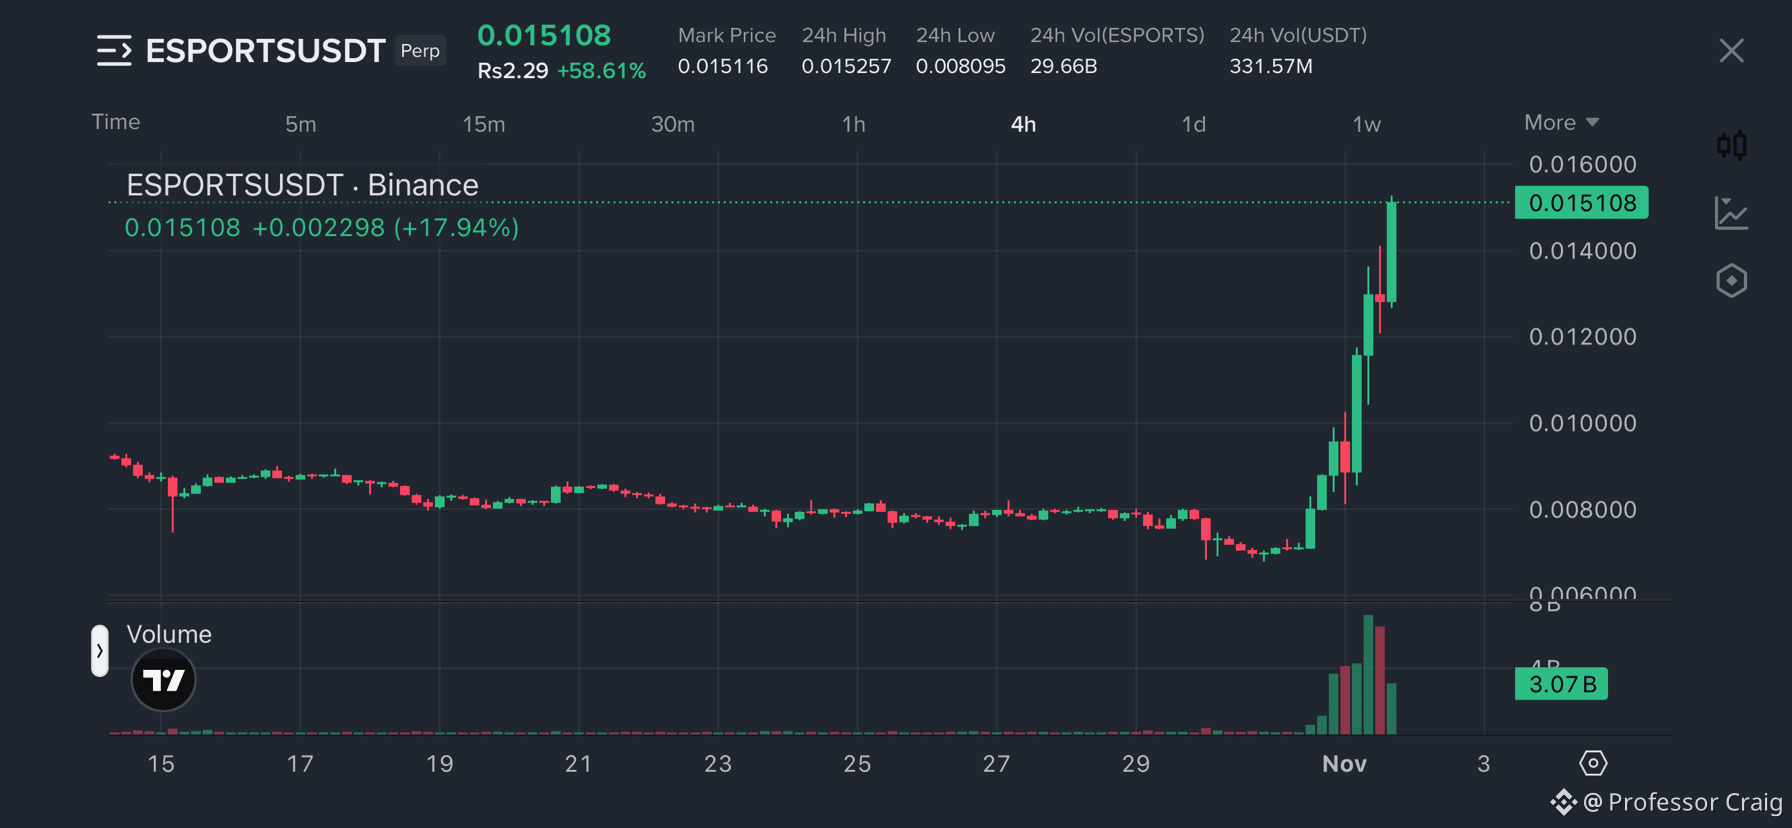
🚨$ESPORTS is up more than 58% in 24 hours. Is this just the beginning of a bigger rally?
It is showing serious bullish momentum after spending several weeks moving sideways and struggling to attract buyers. The 4-hour chart now tells a completely different story. Price has broken out of its previous consolidation range around $0.0080-$0.0090 and pushed aggressively toward $0.0151, with strong green candles and a massive increase in trading volume.
What makes this move interesting is the strength behind the breakout. Volume has expanded significantly, showing that market participation has increased as buyers stepped in. This is not the kind of slow movement we were seeing during the previous sessions. The sudden buying pressure has completely changed the short-term market structure, putting it in a strong bullish position. However, after such a sharp rally, some profit-taking and short term corrections would be completely normal.
Long Trading Plan:📊
Entry Zone: $0.0140-$0.0146
TP1: $0.0155
TP2: $0.0165
TP3: $0.0180
Stop Loss: $0.0132
The biggest thing I am watching is whether it can maintain its position above the previous breakout area. Strong volume combined with continued buying pressure could keep the bullish momentum alive. On the other hand, losing the $0.0140 region would increase the possibility of a deeper pullback. It has clearly caught the market’s attention, and its recent performance makes it one of the interesting movers to watch right now. The breakout has already delivered an impressive move, but the next few 4 hour candles will be important in determining whether another leg higher is coming.
Do you think ESPORTS can reach $0.0180 in this rally?
Anyways, don’t forget to keep an eye on $AIN & $BEAMX also, both of these token are securing Insane Gains.👀
{future}(BEAMXUSDT)
{future}(AINUSDT)
{future}(ESPORTSUSDT)
#esportsusdt #AINUSDT #BEAMXUSDT
🚨$ESPORTS is up more than 58% in 24 hours. Is this just the beginning of a bigger rally?
It is showing serious bullish momentum after spending several weeks moving sideways and struggling to attract buyers. The 4-hour chart now tells a completely different story. Price has broken out of its previous consolidation range around $0.0080-$0.0090 and pushed aggressively toward $0.0151, with strong green candles and a massive increase in trading volume.
What makes this move interesting is the strength behind the breakout. Volume has expanded significantly, showing that market participation has increased as buyers stepped in. This is not the kind of slow movement we were seeing during the previous sessions. The sudden buying pressure has completely changed the short-term market structure, putting it in a strong bullish position. However, after such a sharp rally, some profit-taking and short term corrections would be completely normal.
Long Trading Plan:📊
Entry Zone: $0.0140-$0.0146
TP1: $0.0155
TP2: $0.0165
TP3: $0.0180
Stop Loss: $0.0132
The biggest thing I am watching is whether it can maintain its position above the previous breakout area. Strong volume combined with continued buying pressure could keep the bullish momentum alive. On the other hand, losing the $0.0140 region would increase the possibility of a deeper pullback. It has clearly caught the market’s attention, and its recent performance makes it one of the interesting movers to watch right now. The breakout has already delivered an impressive move, but the next few 4 hour candles will be important in determining whether another leg higher is coming.
Do you think ESPORTS can reach $0.0180 in this rally?
Anyways, don’t forget to keep an eye on $AIN & $BEAMX also, both of these token are securing Insane Gains.👀
#esportsusdt #AINUSDT #BEAMXUSDT
It is showing serious bullish momentum after spending several weeks moving sideways and struggling to attract buyers. The 4-hour chart now tells a completely different story. Price has broken out of its previous consolidation range around $0.0080-$0.0090 and pushed aggressively toward $0.0151, with strong green candles and a massive increase in trading volume.
What makes this move interesting is the strength behind the breakout. Volume has expanded significantly, showing that market participation has increased as buyers stepped in. This is not the kind of slow movement we were seeing during the previous sessions. The sudden buying pressure has completely changed the short-term market structure, putting it in a strong bullish position. However, after such a sharp rally, some profit-taking and short term corrections would be completely normal.
Long Trading Plan:📊
Entry Zone: $0.0140-$0.0146
TP1: $0.0155
TP2: $0.0165
TP3: $0.0180
Stop Loss: $0.0132
The biggest thing I am watching is whether it can maintain its position above the previous breakout area. Strong volume combined with continued buying pressure could keep the bullish momentum alive. On the other hand, losing the $0.0140 region would increase the possibility of a deeper pullback. It has clearly caught the market’s attention, and its recent performance makes it one of the interesting movers to watch right now. The breakout has already delivered an impressive move, but the next few 4 hour candles will be important in determining whether another leg higher is coming.
Do you think ESPORTS can reach $0.0180 in this rally?
Anyways, don’t forget to keep an eye on $AIN & $BEAMX also, both of these token are securing Insane Gains.👀
#esportsusdt #AINUSDT #BEAMXUSDT
1
84
·
--
Bullish
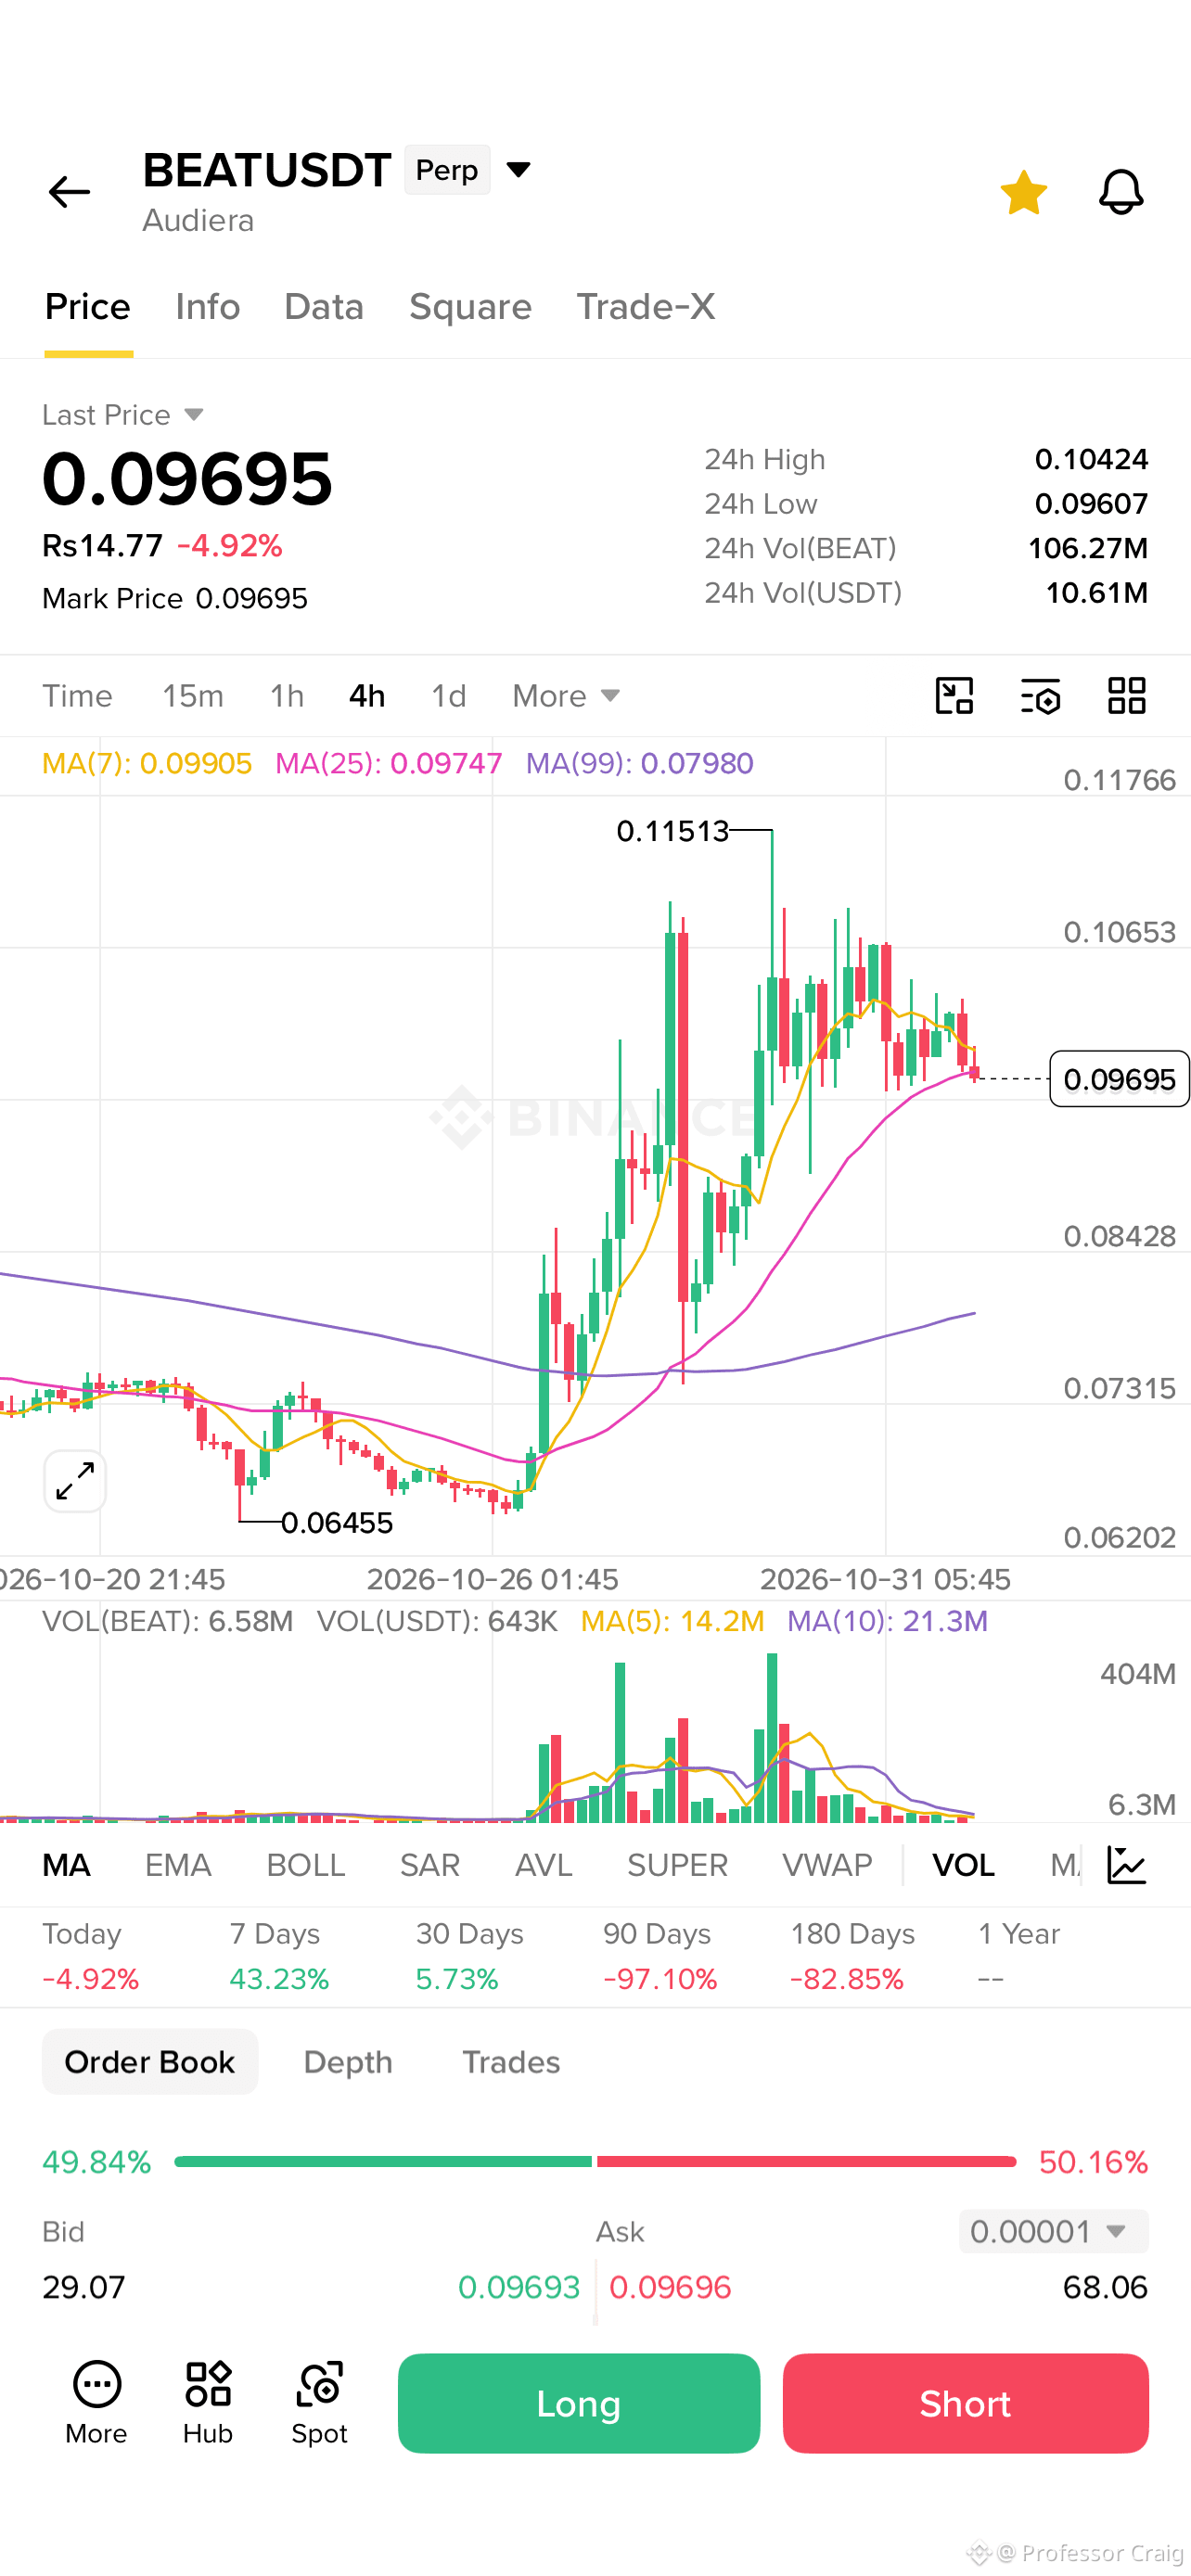
$BEAT will reach 1$ Very soon!
Mark my word guys.
{future}(BEATUSDT)
$BEAT will reach 1$ Very soon!
Mark my word guys.
Mark my word guys.
3
429
·
--
Bullish
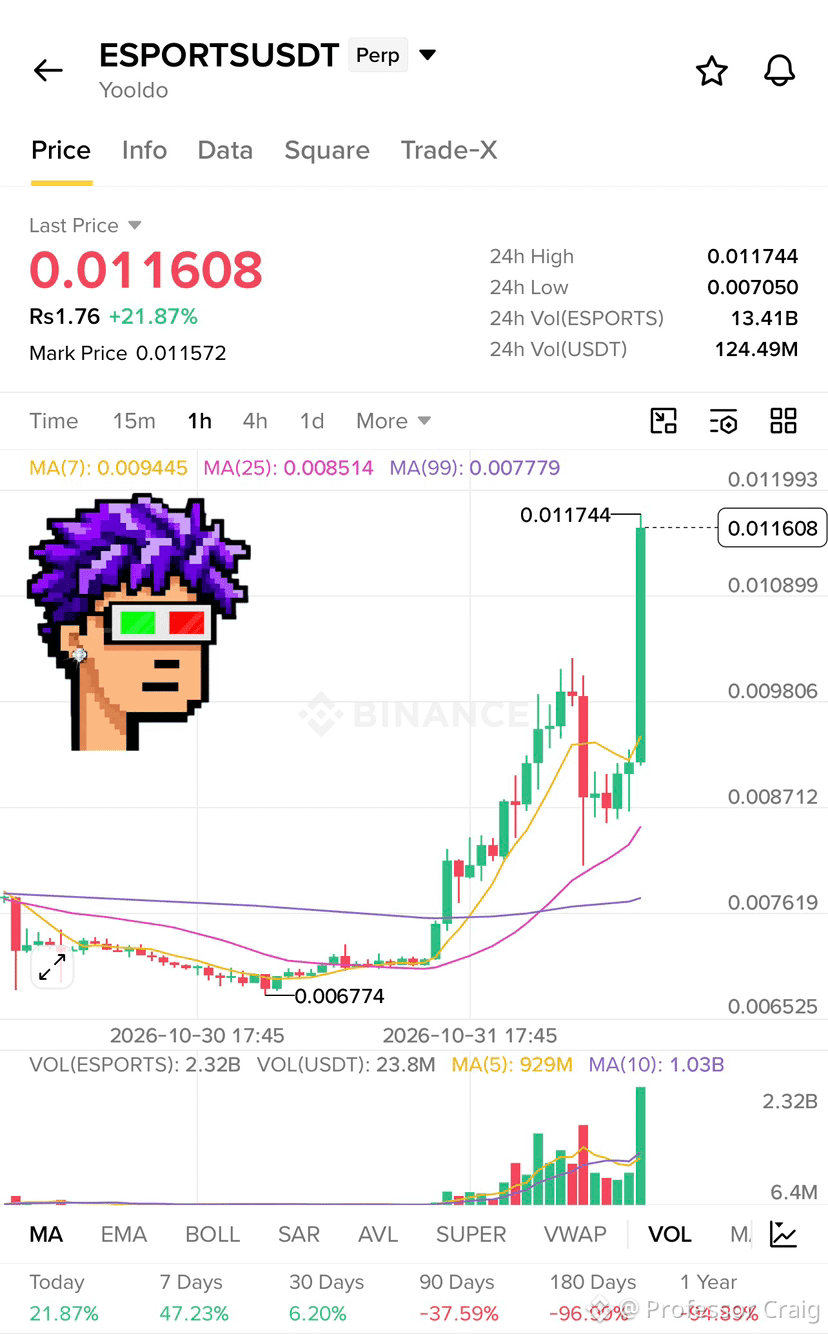
🚀 $ESPORTS : Bulls Are Preparing for Another Potential Move!
It is attracting attention as buyers look for opportunities to push the price toward higher levels. My long entry is positioned at $0.011608, targeting a potential bullish continuation. The focus now is on whether buyers can maintain momentum, defend the entry region, and build enough strength for the next upward move.
The key here is maintaining buying pressure rather than allowing sellers to regain control. If the price holds above the entry zone, a continuation toward the next resistance levels becomes an interesting possibility. Increasing volume and consistent buying activity would further strengthen the bullish outlook. I am watching this setup closely because a successful move could offer an attractive opportunity for momentum traders.
Long Trading Plan: 📈
Entry: $0.011608
TP1: $0.012200
TP2: $0.012800
TP3: $0.013500
Stop Loss: $0.011200
My bias is bullish while the price respects the entry support. I am targeting a gradual move toward $0.013500, with risk management remaining the priority. No trade is guaranteed, so position sizing matters.
Can ESPORTS deliver another bullish expansion from here?
Can we also focus on $AIN & $BLESS also guys.👀
{future}(BLESSUSDT)
{future}(AINUSDT)
{future}(ESPORTSUSDT)
#ainusdt #BLESSUSDT #ESPORTSUSDT
🚀 $ESPORTS : Bulls Are Preparing for Another Potential Move!
It is attracting attention as buyers look for opportunities to push the price toward higher levels. My long entry is positioned at $0.011608, targeting a potential bullish continuation. The focus now is on whether buyers can maintain momentum, defend the entry region, and build enough strength for the next upward move.
The key here is maintaining buying pressure rather than allowing sellers to regain control. If the price holds above the entry zone, a continuation toward the next resistance levels becomes an interesting possibility. Increasing volume and consistent buying activity would further strengthen the bullish outlook. I am watching this setup closely because a successful move could offer an attractive opportunity for momentum traders.
Long Trading Plan: 📈
Entry: $0.011608
TP1: $0.012200
TP2: $0.012800
TP3: $0.013500
Stop Loss: $0.011200
My bias is bullish while the price respects the entry support. I am targeting a gradual move toward $0.013500, with risk management remaining the priority. No trade is guaranteed, so position sizing matters.
Can ESPORTS deliver another bullish expansion from here?
Can we also focus on $AIN & $BLESS also guys.👀
#ainusdt #BLESSUSDT #ESPORTSUSDT
It is attracting attention as buyers look for opportunities to push the price toward higher levels. My long entry is positioned at $0.011608, targeting a potential bullish continuation. The focus now is on whether buyers can maintain momentum, defend the entry region, and build enough strength for the next upward move.
The key here is maintaining buying pressure rather than allowing sellers to regain control. If the price holds above the entry zone, a continuation toward the next resistance levels becomes an interesting possibility. Increasing volume and consistent buying activity would further strengthen the bullish outlook. I am watching this setup closely because a successful move could offer an attractive opportunity for momentum traders.
Long Trading Plan: 📈
Entry: $0.011608
TP1: $0.012200
TP2: $0.012800
TP3: $0.013500
Stop Loss: $0.011200
My bias is bullish while the price respects the entry support. I am targeting a gradual move toward $0.013500, with risk management remaining the priority. No trade is guaranteed, so position sizing matters.
Can ESPORTS deliver another bullish expansion from here?
Can we also focus on $AIN & $BLESS also guys.👀
#ainusdt #BLESSUSDT #ESPORTSUSDT
2
264
·
--
Bullish
🚨$AIN /USDT: Bulls Are Taking Control as AIN Breaks Toward $0.30!
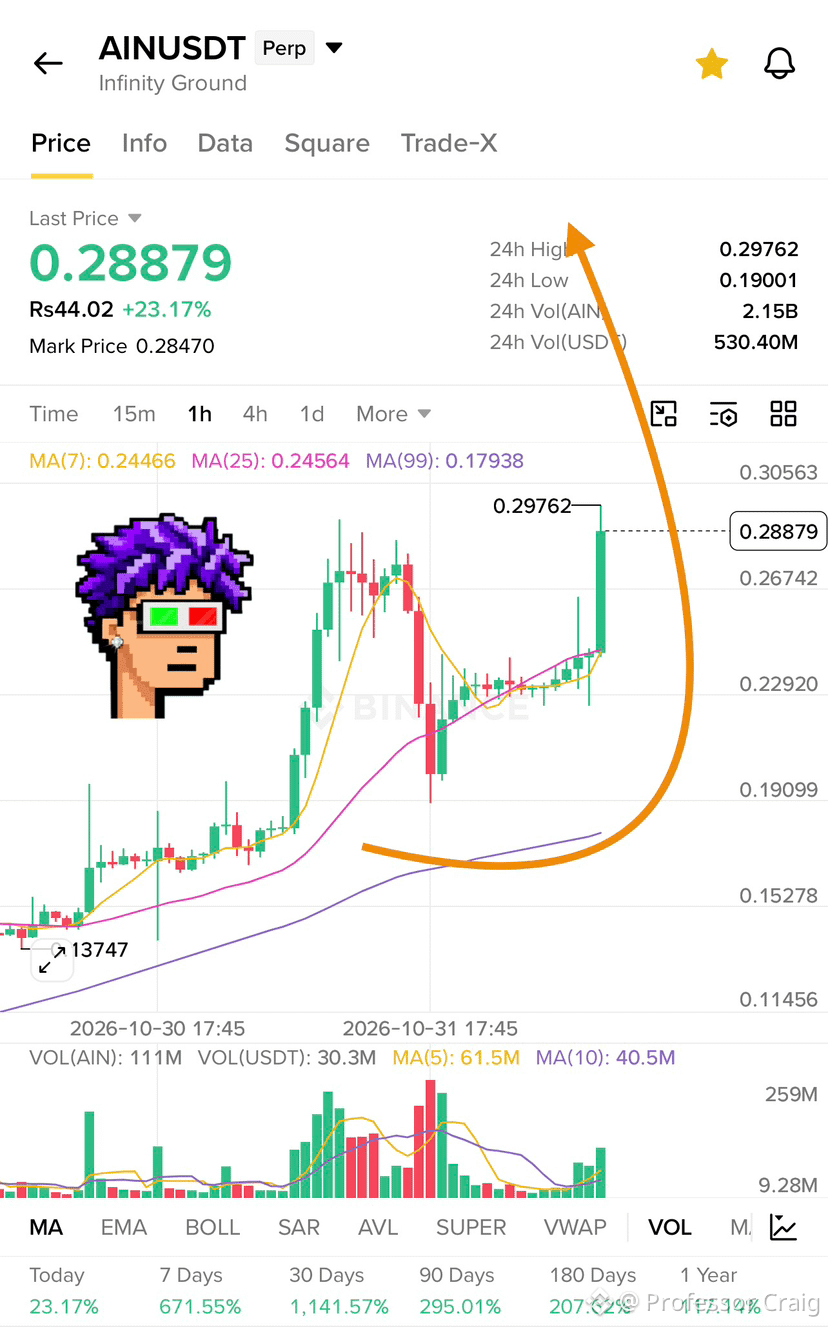
It is showing serious bullish strength, and the latest 1 hour candle is making this move difficult to ignore. Trading around $0.28879, the token has gained 23.17% in 24 hours, with price approaching its recent high of $0.29762. What makes this move interesting is that it isn’t simply another green candle. After a strong rally, AIN experienced a correction, found support around the $0.19–$0.20 region, and gradually rebuilt its momentum. Buyers stepped back in, pushed price above the $0.23 consolidation area, and now the market is testing the next major psychological resistance at $0.30.
The moving averages are also supporting the bullish structure. MA(7) at $0.24466 is above MA(25) at $0.24564? The short-term averages are converging, while MA(99) remains considerably lower at $0.17938. The latest breakout candle is accompanied by increased trading activity, suggesting renewed buying interest. The $0.30 level is the main battle. A decisive break above $0.29762 would put AIN in a strong position to extend its rally toward $0.31 and potentially explore higher levels. With momentum attracting attention, another expansion in buying volume could accelerate the move.
Long Trading Plan: 📈
Entry Range: $0.2780 – $0.2880
TP1: $0.3100
TP2: $0.3300
TP3: $0.3500
Stop Loss: $0.2660
My bias remains bullish as long as AIN maintains its breakout structure and holds above the entry support region. A healthy retest would offer a better risk-to-reward opportunity than chasing an extended green candle. However, traders should remember that a rapid 23% rally can also invite profit-taking. Losing the $0.2660 region would weaken this particular setup. AIN is approaching a major breakout opportunity. Can the bulls push it above $0.30 and turn this rally into another explosive leg upward?
Keep an eye on $G & $ESPORTS also guys.👀
{future}(ESPORTSUSDT)
{future}(GUSDT)
{future}(AINUSDT)
#gusdt #AINUSDT #ESPORTSUSDT
🚨$AIN /USDT: Bulls Are Taking Control as AIN Breaks Toward $0.30!
It is showing serious bullish strength, and the latest 1 hour candle is making this move difficult to ignore. Trading around $0.28879, the token has gained 23.17% in 24 hours, with price approaching its recent high of $0.29762. What makes this move interesting is that it isn’t simply another green candle. After a strong rally, AIN experienced a correction, found support around the $0.19–$0.20 region, and gradually rebuilt its momentum. Buyers stepped back in, pushed price above the $0.23 consolidation area, and now the market is testing the next major psychological resistance at $0.30.
The moving averages are also supporting the bullish structure. MA(7) at $0.24466 is above MA(25) at $0.24564? The short-term averages are converging, while MA(99) remains considerably lower at $0.17938. The latest breakout candle is accompanied by increased trading activity, suggesting renewed buying interest. The $0.30 level is the main battle. A decisive break above $0.29762 would put AIN in a strong position to extend its rally toward $0.31 and potentially explore higher levels. With momentum attracting attention, another expansion in buying volume could accelerate the move.
Long Trading Plan: 📈
Entry Range: $0.2780 – $0.2880
TP1: $0.3100
TP2: $0.3300
TP3: $0.3500
Stop Loss: $0.2660
My bias remains bullish as long as AIN maintains its breakout structure and holds above the entry support region. A healthy retest would offer a better risk-to-reward opportunity than chasing an extended green candle. However, traders should remember that a rapid 23% rally can also invite profit-taking. Losing the $0.2660 region would weaken this particular setup. AIN is approaching a major breakout opportunity. Can the bulls push it above $0.30 and turn this rally into another explosive leg upward?
Keep an eye on $G & $ESPORTS also guys.👀
#gusdt #AINUSDT #ESPORTSUSDT
It is showing serious bullish strength, and the latest 1 hour candle is making this move difficult to ignore. Trading around $0.28879, the token has gained 23.17% in 24 hours, with price approaching its recent high of $0.29762. What makes this move interesting is that it isn’t simply another green candle. After a strong rally, AIN experienced a correction, found support around the $0.19–$0.20 region, and gradually rebuilt its momentum. Buyers stepped back in, pushed price above the $0.23 consolidation area, and now the market is testing the next major psychological resistance at $0.30.
The moving averages are also supporting the bullish structure. MA(7) at $0.24466 is above MA(25) at $0.24564? The short-term averages are converging, while MA(99) remains considerably lower at $0.17938. The latest breakout candle is accompanied by increased trading activity, suggesting renewed buying interest. The $0.30 level is the main battle. A decisive break above $0.29762 would put AIN in a strong position to extend its rally toward $0.31 and potentially explore higher levels. With momentum attracting attention, another expansion in buying volume could accelerate the move.
Long Trading Plan: 📈
Entry Range: $0.2780 – $0.2880
TP1: $0.3100
TP2: $0.3300
TP3: $0.3500
Stop Loss: $0.2660
My bias remains bullish as long as AIN maintains its breakout structure and holds above the entry support region. A healthy retest would offer a better risk-to-reward opportunity than chasing an extended green candle. However, traders should remember that a rapid 23% rally can also invite profit-taking. Losing the $0.2660 region would weaken this particular setup. AIN is approaching a major breakout opportunity. Can the bulls push it above $0.30 and turn this rally into another explosive leg upward?
Keep an eye on $G & $ESPORTS also guys.👀
#gusdt #AINUSDT #ESPORTSUSDT
3
740
·
--
Bullish
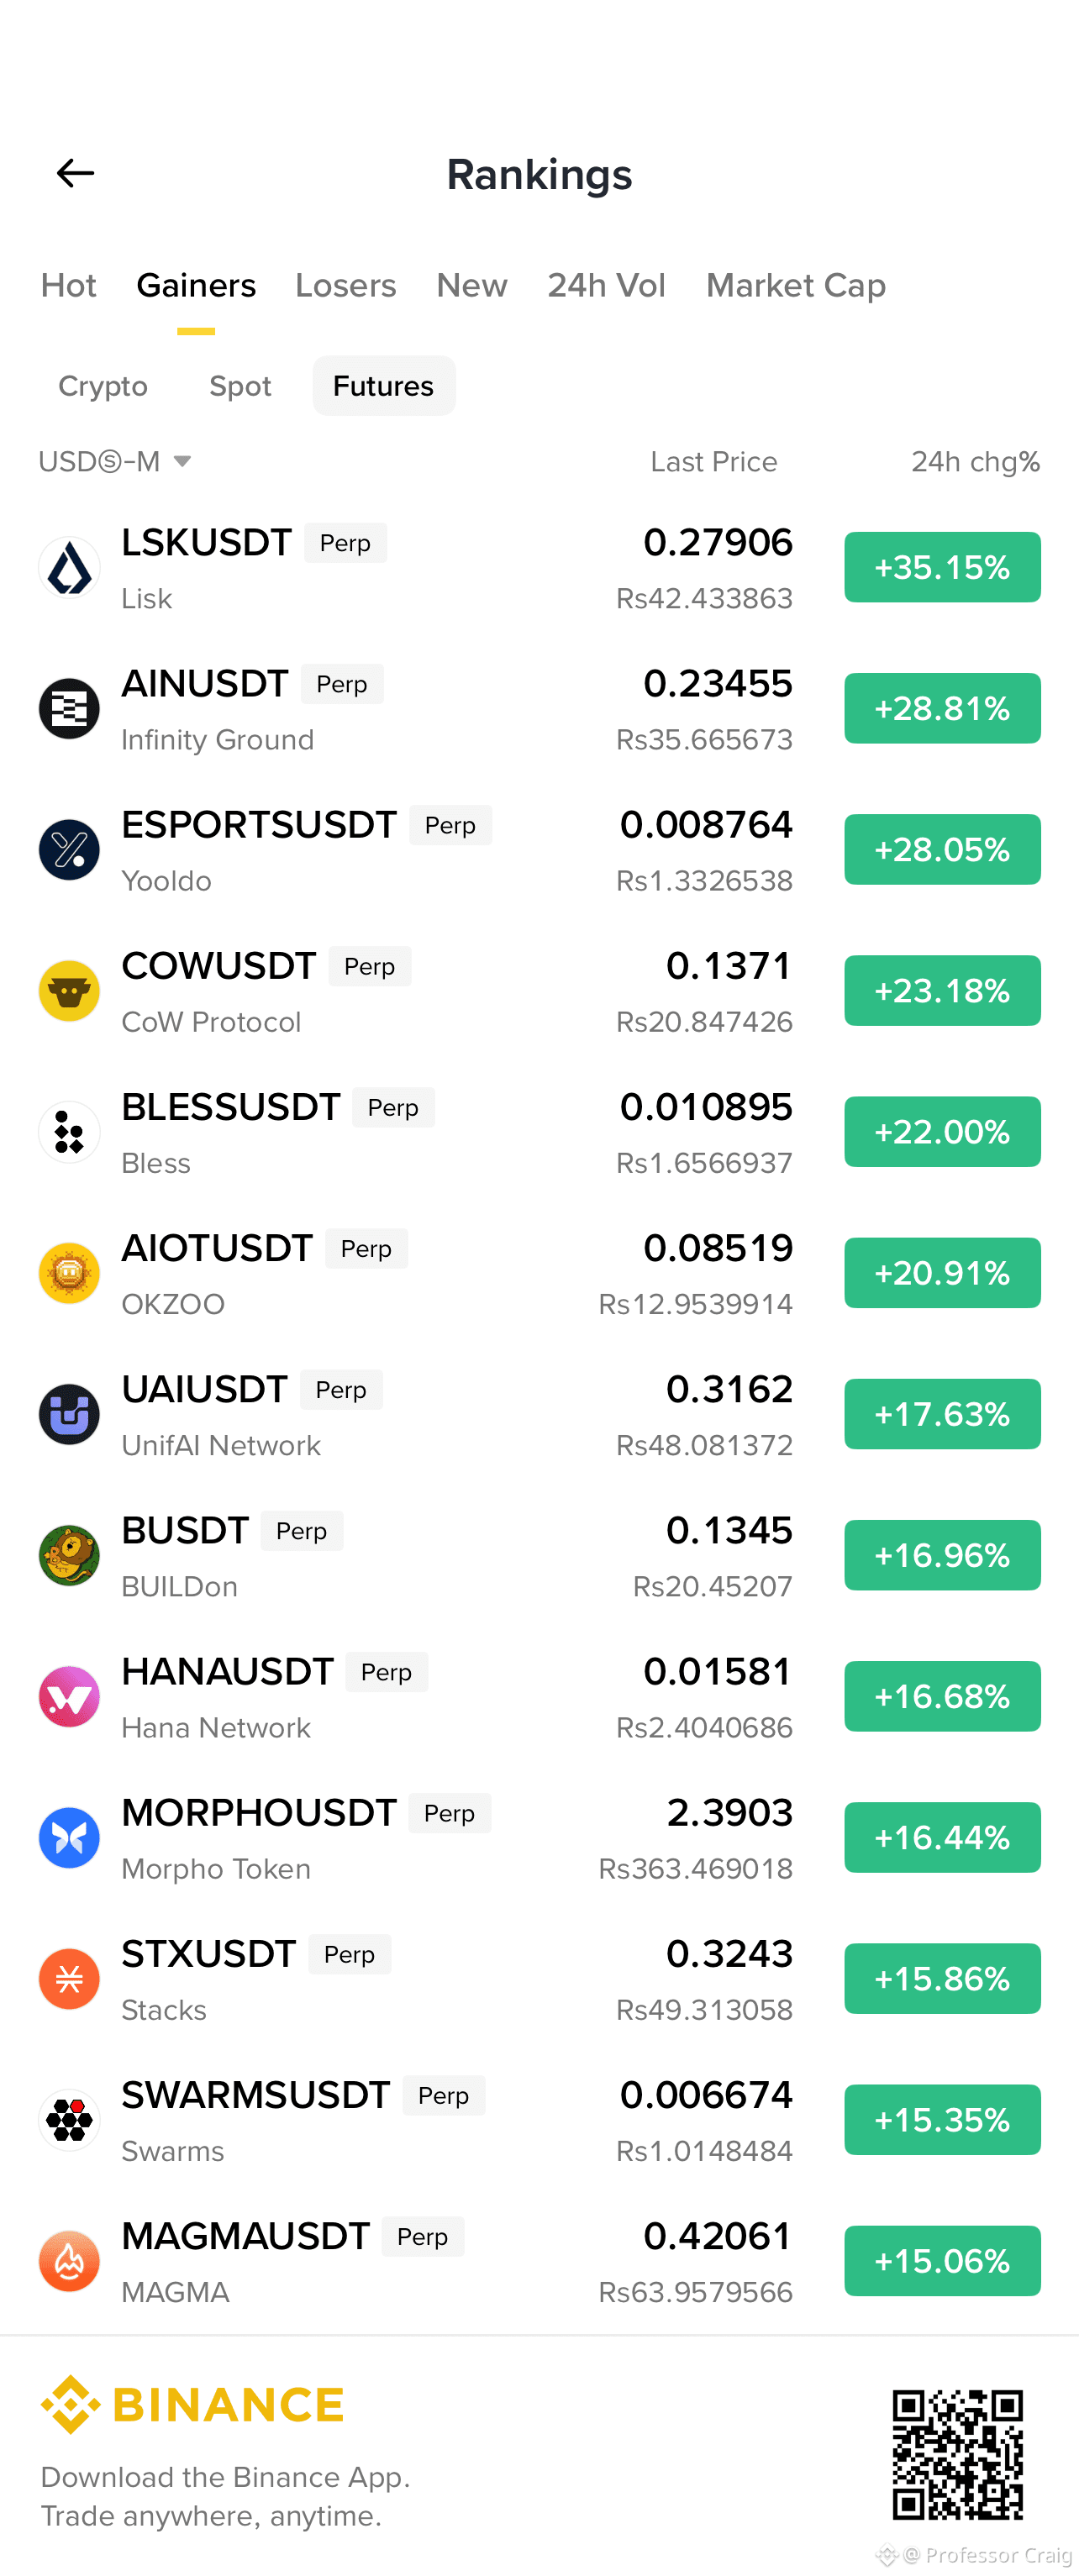
🚨Reviewing the best tokens of today 🚨
1: $AIN standing tall since last 2-3 days and still looking strong and steady.
2: $LSK since yesterday, hype has been preety much working by catching most of the traders attentions.
3: $ESPORTS is actively new on gainers list but has proved to be having upside potential before also so, i think momentum will remain quite longer than most of us are expecting.
Which one is your fav of today guys? Comment down below your thoughts.
{future}(ESPORTSUSDT)
{future}(LSKUSDT)
{future}(AINUSDT)
#esportsusdt #LSKUSDT #AINUSDT
🚨Reviewing the best tokens of today 🚨
1: $AIN standing tall since last 2-3 days and still looking strong and steady.
2: $LSK since yesterday, hype has been preety much working by catching most of the traders attentions.
3: $ESPORTS is actively new on gainers list but has proved to be having upside potential before also so, i think momentum will remain quite longer than most of us are expecting.
Which one is your fav of today guys? Comment down below your thoughts.
#esportsusdt #LSKUSDT #AINUSDT
1: $AIN standing tall since last 2-3 days and still looking strong and steady.
2: $LSK since yesterday, hype has been preety much working by catching most of the traders attentions.
3: $ESPORTS is actively new on gainers list but has proved to be having upside potential before also so, i think momentum will remain quite longer than most of us are expecting.
Which one is your fav of today guys? Comment down below your thoughts.
#esportsusdt #LSKUSDT #AINUSDT
2
649
·
--
Bullish
🚨 $ESPORTS is showing serious bullish momentum, and buyers are clearly taking control!
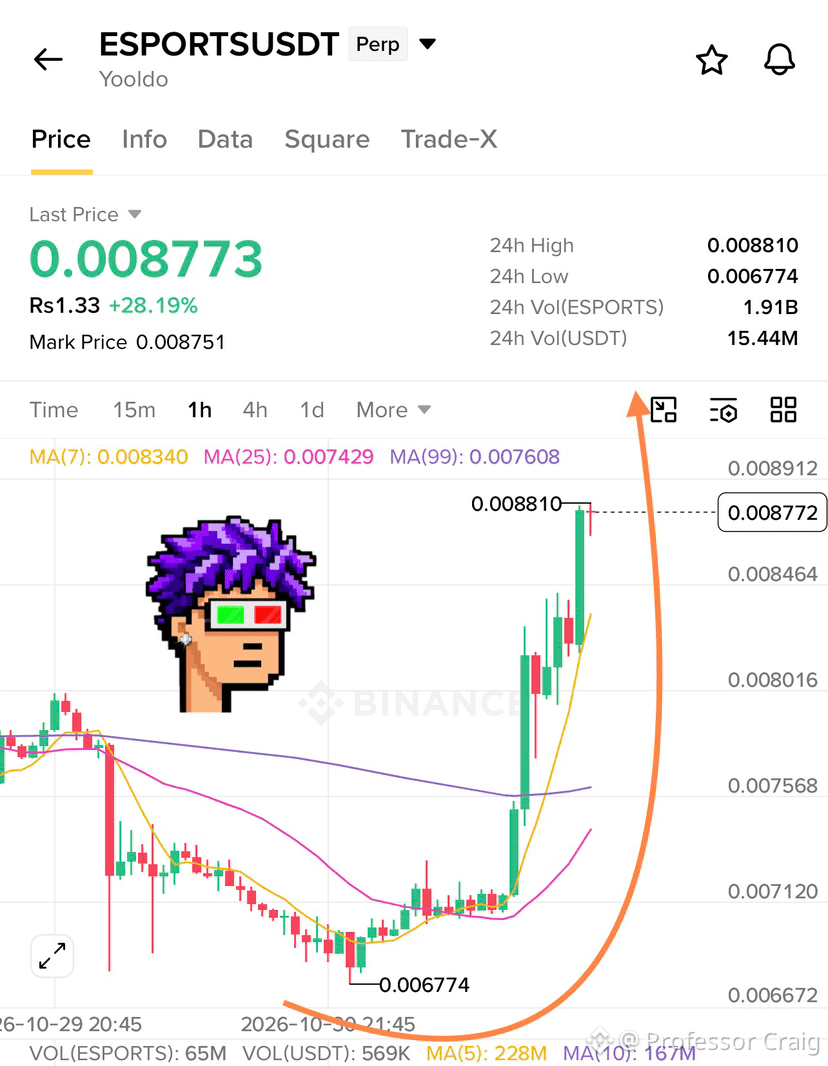
It has delivered an impressive recovery, gaining more than 28% in the last 24 hours and pushing its price toward the $0.008810 resistance zone. What makes this move interesting is not just the percentage gain, but the strength behind the breakout. After spending time consolidating around the $0.0070–$0.0072 region, it finally attracted strong buying pressure. The recent sequence of large green candles shows that buyers have stepped in aggressively, pushing the price above all three major moving averages.
The technical picture is becoming increasingly bullish. The MA(7) is sitting at $0.008340, while the MA(25) and MA(99) are around $0.007429 and $0.007608, respectively. Price is trading comfortably above these averages, suggesting that short-term momentum has shifted in favor of the bulls.
Long Trading Plan:📊
Entry Zone: $0.00840–$0.00860
TP1: $0.00900
TP2: $0.00950
TP3: $0.01000
Stop Loss: $0.00810
Another important factor is the volume. The breakout came with increased trading activity, indicating that this move is attracting market participation rather than being just another low volume price fluctuation. Now, all eyes are on $0.008810. A convincing move above this resistance could open the door for another expansion toward $0.0090 and potentially the $0.0100 psychological level. That would represent another significant milestone for this recovery.
However, after such a strong move, some short-term consolidation or a retest would be healthy. Holding the $0.0083–$0.0085 region would keep the bullish structure intact. My focus is on whether buyers can turn the previous resistance into support. If they manage to do that, I believe this rally still has room to extend.
The momentum is here, volume is picking up, and the chart is finally showing a strong recovery structure.
Can we see ESPORTS break above $0.01 next?
{future}(ESPORTSUSDT)
Keep an eye on $LSK and $AIN too guys.👀
{future}(AINUSDT)
{future}(LSKUSDT)
#craigprofessor #ainusdt #esports #LSKUSDT
🚨 $ESPORTS is showing serious bullish momentum, and buyers are clearly taking control!
It has delivered an impressive recovery, gaining more than 28% in the last 24 hours and pushing its price toward the $0.008810 resistance zone. What makes this move interesting is not just the percentage gain, but the strength behind the breakout. After spending time consolidating around the $0.0070–$0.0072 region, it finally attracted strong buying pressure. The recent sequence of large green candles shows that buyers have stepped in aggressively, pushing the price above all three major moving averages.
The technical picture is becoming increasingly bullish. The MA(7) is sitting at $0.008340, while the MA(25) and MA(99) are around $0.007429 and $0.007608, respectively. Price is trading comfortably above these averages, suggesting that short-term momentum has shifted in favor of the bulls.
Long Trading Plan:📊
Entry Zone: $0.00840–$0.00860
TP1: $0.00900
TP2: $0.00950
TP3: $0.01000
Stop Loss: $0.00810
Another important factor is the volume. The breakout came with increased trading activity, indicating that this move is attracting market participation rather than being just another low volume price fluctuation. Now, all eyes are on $0.008810. A convincing move above this resistance could open the door for another expansion toward $0.0090 and potentially the $0.0100 psychological level. That would represent another significant milestone for this recovery.
However, after such a strong move, some short-term consolidation or a retest would be healthy. Holding the $0.0083–$0.0085 region would keep the bullish structure intact. My focus is on whether buyers can turn the previous resistance into support. If they manage to do that, I believe this rally still has room to extend.
The momentum is here, volume is picking up, and the chart is finally showing a strong recovery structure.
Can we see ESPORTS break above $0.01 next?
Keep an eye on $LSK and $AIN too guys.👀
#craigprofessor #ainusdt #esports #LSKUSDT
It has delivered an impressive recovery, gaining more than 28% in the last 24 hours and pushing its price toward the $0.008810 resistance zone. What makes this move interesting is not just the percentage gain, but the strength behind the breakout. After spending time consolidating around the $0.0070–$0.0072 region, it finally attracted strong buying pressure. The recent sequence of large green candles shows that buyers have stepped in aggressively, pushing the price above all three major moving averages.
The technical picture is becoming increasingly bullish. The MA(7) is sitting at $0.008340, while the MA(25) and MA(99) are around $0.007429 and $0.007608, respectively. Price is trading comfortably above these averages, suggesting that short-term momentum has shifted in favor of the bulls.
Long Trading Plan:📊
Entry Zone: $0.00840–$0.00860
TP1: $0.00900
TP2: $0.00950
TP3: $0.01000
Stop Loss: $0.00810
Another important factor is the volume. The breakout came with increased trading activity, indicating that this move is attracting market participation rather than being just another low volume price fluctuation. Now, all eyes are on $0.008810. A convincing move above this resistance could open the door for another expansion toward $0.0090 and potentially the $0.0100 psychological level. That would represent another significant milestone for this recovery.
However, after such a strong move, some short-term consolidation or a retest would be healthy. Holding the $0.0083–$0.0085 region would keep the bullish structure intact. My focus is on whether buyers can turn the previous resistance into support. If they manage to do that, I believe this rally still has room to extend.
The momentum is here, volume is picking up, and the chart is finally showing a strong recovery structure.
Can we see ESPORTS break above $0.01 next?
Keep an eye on $LSK and $AIN too guys.👀
#craigprofessor #ainusdt #esports #LSKUSDT
2
2
1.1k
·
--
Bullish
🚨 $LSK is exploding! Is another major leg upward coming?
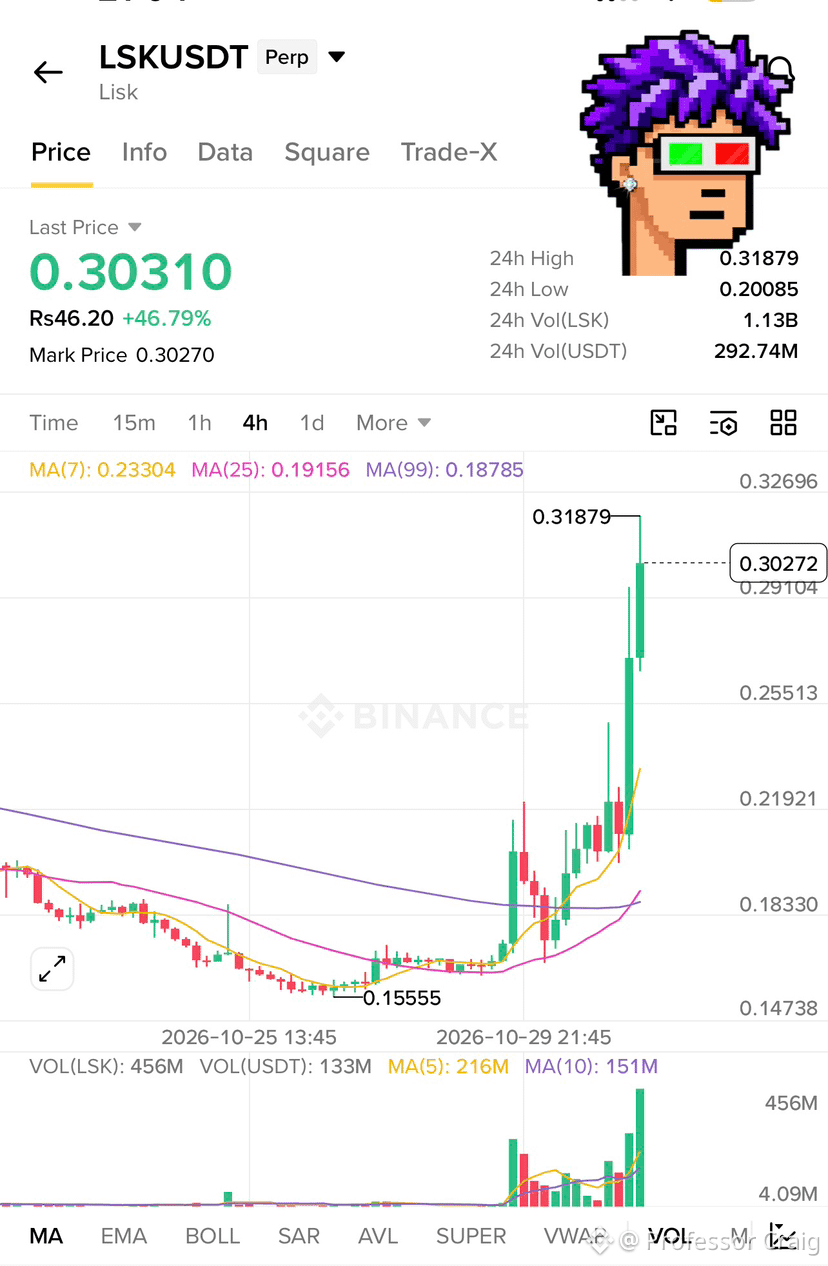
It has delivered one of the strongest bullish moves on its 4H chart, climbing aggressively from the $0.15555 bottom to a recent high of $0.31879. That’s more than a 100% recovery, and the latest price action suggests buyers are taking control. What makes this breakout particularly interesting is the volume behind it. Trading activity has expanded significantly, with 24 hour volume reaching approximately 1.13 billion LSK and $292 million in USDT volume. This is not just a small move driven by a few candles. Participation has increased substantially, showing that traders are paying serious attention to this asset.
Looking at the moving averages, the bullish structure is becoming increasingly clear. MA(7) is sitting at $0.23304, MA(25) at $0.19156, and MA(99) at $0.18785. Price is trading comfortably above all three averages, reflecting a strong shift in momentum. However, after such an aggressive rally, some short term consolidation or profit taking would be completely normal. The important level to watch is the $0.29000 area. Holding above this zone would keep the breakout structure healthy and give buyers an opportunity to challenge the recent high.
Long Trading Plan📈
Entry: $0.28500–$0.30300
TP1: $0.31900
TP2: $0.34000
TP3: $0.36000
Stop Loss: $0.26900
My bias remains bullish while LSK maintains its breakout structure. A convincing move above $0.31879 could attract another wave of momentum traders and open the door toward the $0.34–$0.36 region.
Of course, chasing an already extended candle is not the smartest approach. A controlled entry around the breakout support offers a much better risk to reward opportunity. It has already made an impressive move. The bigger question now is whether buyers have enough strength to push it toward $0.40. What do you think?
🛑 Important Reminder: Watchout $AIN & $ZEC Both are gaining Impresive, Catching attention of whales.
{future}(ZECUSDT)
{future}(AINUSDT)
{future}(LSKUSDT)
#lskusdtanalysis #ainusdt #zecusdt
🚨 $LSK is exploding! Is another major leg upward coming?
It has delivered one of the strongest bullish moves on its 4H chart, climbing aggressively from the $0.15555 bottom to a recent high of $0.31879. That’s more than a 100% recovery, and the latest price action suggests buyers are taking control. What makes this breakout particularly interesting is the volume behind it. Trading activity has expanded significantly, with 24 hour volume reaching approximately 1.13 billion LSK and $292 million in USDT volume. This is not just a small move driven by a few candles. Participation has increased substantially, showing that traders are paying serious attention to this asset.
Looking at the moving averages, the bullish structure is becoming increasingly clear. MA(7) is sitting at $0.23304, MA(25) at $0.19156, and MA(99) at $0.18785. Price is trading comfortably above all three averages, reflecting a strong shift in momentum. However, after such an aggressive rally, some short term consolidation or profit taking would be completely normal. The important level to watch is the $0.29000 area. Holding above this zone would keep the breakout structure healthy and give buyers an opportunity to challenge the recent high.
Long Trading Plan📈
Entry: $0.28500–$0.30300
TP1: $0.31900
TP2: $0.34000
TP3: $0.36000
Stop Loss: $0.26900
My bias remains bullish while LSK maintains its breakout structure. A convincing move above $0.31879 could attract another wave of momentum traders and open the door toward the $0.34–$0.36 region.
Of course, chasing an already extended candle is not the smartest approach. A controlled entry around the breakout support offers a much better risk to reward opportunity. It has already made an impressive move. The bigger question now is whether buyers have enough strength to push it toward $0.40. What do you think?
🛑 Important Reminder: Watchout $AIN & $ZEC Both are gaining Impresive, Catching attention of whales.
#lskusdtanalysis #ainusdt #zecusdt
It has delivered one of the strongest bullish moves on its 4H chart, climbing aggressively from the $0.15555 bottom to a recent high of $0.31879. That’s more than a 100% recovery, and the latest price action suggests buyers are taking control. What makes this breakout particularly interesting is the volume behind it. Trading activity has expanded significantly, with 24 hour volume reaching approximately 1.13 billion LSK and $292 million in USDT volume. This is not just a small move driven by a few candles. Participation has increased substantially, showing that traders are paying serious attention to this asset.
Looking at the moving averages, the bullish structure is becoming increasingly clear. MA(7) is sitting at $0.23304, MA(25) at $0.19156, and MA(99) at $0.18785. Price is trading comfortably above all three averages, reflecting a strong shift in momentum. However, after such an aggressive rally, some short term consolidation or profit taking would be completely normal. The important level to watch is the $0.29000 area. Holding above this zone would keep the breakout structure healthy and give buyers an opportunity to challenge the recent high.
Long Trading Plan📈
Entry: $0.28500–$0.30300
TP1: $0.31900
TP2: $0.34000
TP3: $0.36000
Stop Loss: $0.26900
My bias remains bullish while LSK maintains its breakout structure. A convincing move above $0.31879 could attract another wave of momentum traders and open the door toward the $0.34–$0.36 region.
Of course, chasing an already extended candle is not the smartest approach. A controlled entry around the breakout support offers a much better risk to reward opportunity. It has already made an impressive move. The bigger question now is whether buyers have enough strength to push it toward $0.40. What do you think?
🛑 Important Reminder: Watchout $AIN & $ZEC Both are gaining Impresive, Catching attention of whales.
#lskusdtanalysis #ainusdt #zecusdt
2
628
·
--
Bullish
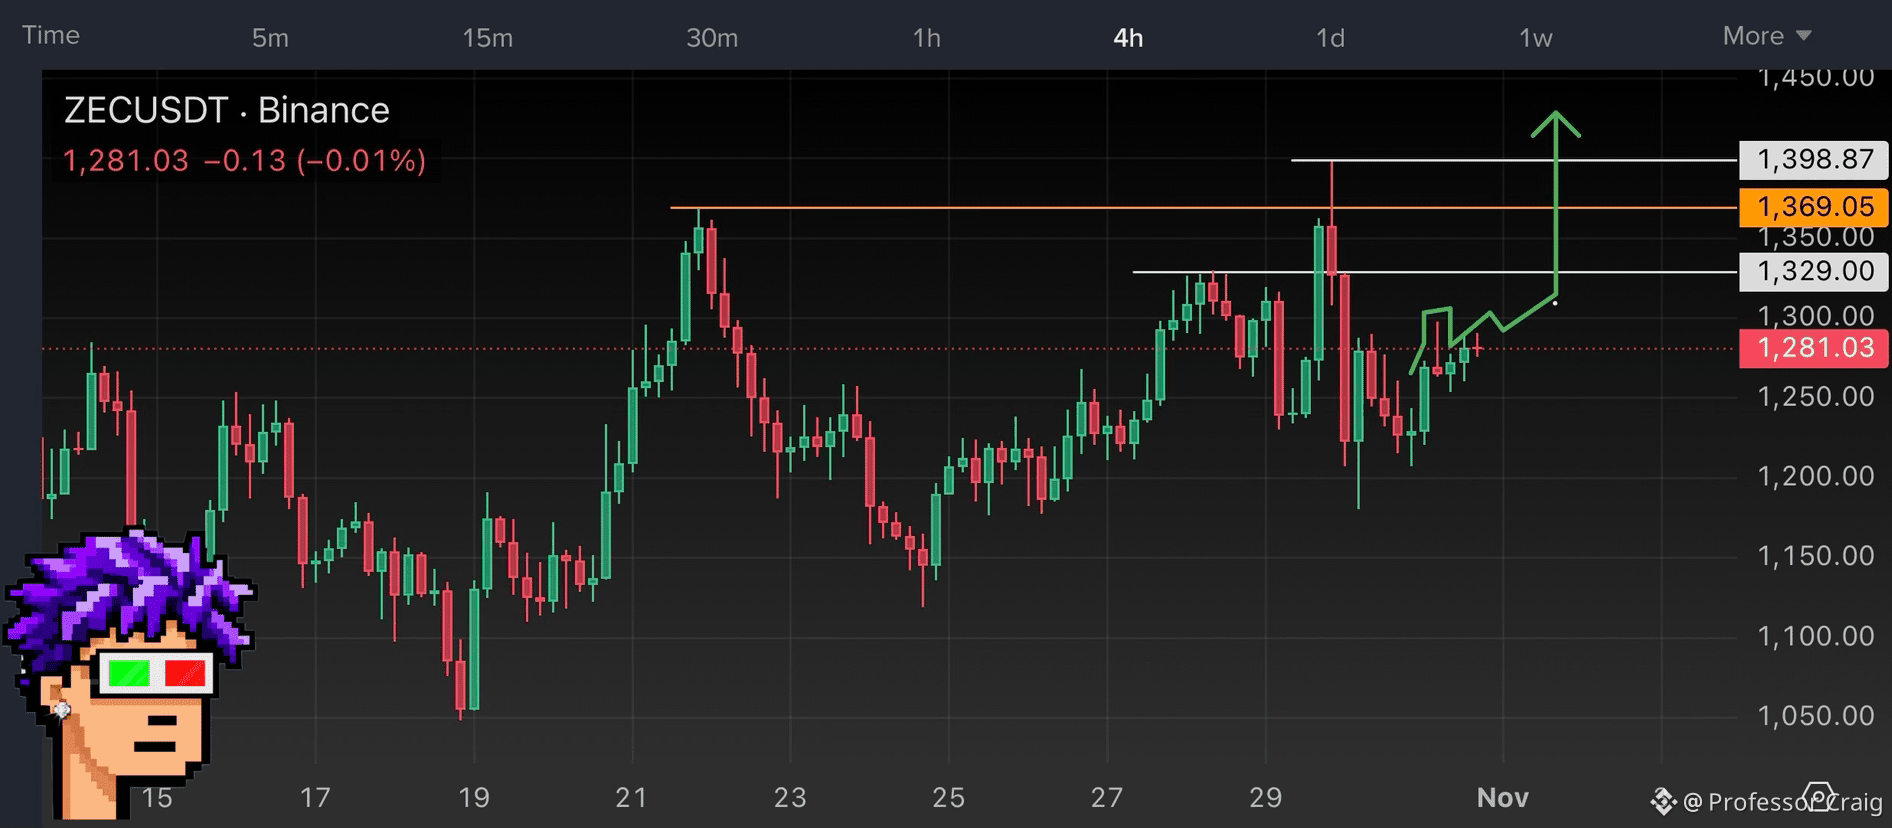
🚨$ZEC moving back to +$1500 Price zone?
Even after continuous Downfall and negative hype towards Zec, it still holds above 1000$ price level which we way more impressive then we thought. Recently lots of news were trying to overshadow or create negative hype for it by comparing $HYPE market cap to Zec Market cap and now its all proven. If we look at the comparision then Zec is far beyond that token in everything.
Whales and Small Traders are still choosing to stick with this token. If we look carefully at the chart, Price has broken the recent resistance of $1370 already and new Resistance for it will be $1400 and after that no thing can stop it from reaching +1500 pricezone.
You can see lots of hype and attention on Top Gainers token but thats temporary, if you want real one which can provide better and faithful reward to your Trade positions then $ZEC should definitly be the first priority for you guys.
People who trusted on my analysis before knows my accuracy, those who haven’t try it today from Zec.
{future}(HYPEUSDT)
{future}(ZECUSDT)
#zecusdtanalysis #ZECUSDT
🚨$ZEC moving back to +$1500 Price zone?
Even after continuous Downfall and negative hype towards Zec, it still holds above 1000$ price level which we way more impressive then we thought. Recently lots of news were trying to overshadow or create negative hype for it by comparing $HYPE market cap to Zec Market cap and now its all proven. If we look at the comparision then Zec is far beyond that token in everything.
Whales and Small Traders are still choosing to stick with this token. If we look carefully at the chart, Price has broken the recent resistance of $1370 already and new Resistance for it will be $1400 and after that no thing can stop it from reaching +1500 pricezone.
You can see lots of hype and attention on Top Gainers token but thats temporary, if you want real one which can provide better and faithful reward to your Trade positions then $ZEC should definitly be the first priority for you guys.
People who trusted on my analysis before knows my accuracy, those who haven’t try it today from Zec.
#zecusdtanalysis #ZECUSDT
Even after continuous Downfall and negative hype towards Zec, it still holds above 1000$ price level which we way more impressive then we thought. Recently lots of news were trying to overshadow or create negative hype for it by comparing $HYPE market cap to Zec Market cap and now its all proven. If we look at the comparision then Zec is far beyond that token in everything.
Whales and Small Traders are still choosing to stick with this token. If we look carefully at the chart, Price has broken the recent resistance of $1370 already and new Resistance for it will be $1400 and after that no thing can stop it from reaching +1500 pricezone.
You can see lots of hype and attention on Top Gainers token but thats temporary, if you want real one which can provide better and faithful reward to your Trade positions then $ZEC should definitly be the first priority for you guys.
People who trusted on my analysis before knows my accuracy, those who haven’t try it today from Zec.
#zecusdtanalysis #ZECUSDT
2
428
·
--
Bullish
⚡️My New Profile Picture for the rest of my Life.
I paid $130 for this Artwork to one of my Client today, do you guys think its worth it? Did i overpaid or underpaid or its okey? Anyways as per me, i loved it so much guys. Pixel art has always been my favourite thing so.😁
Anyways, don’t forget about $AIN 📉 $Q 📈 $LSK 📈 i’ve posted all three of this token analysis revently, don’t forget to check it out guys it might help you some how.
{future}(LSKUSDT)
{future}(QUSDT)
{future}(AINUSDT)
#ainusdt #QUSDT #LSKUSDT #PixelArtwork
⚡️My New Profile Picture for the rest of my Life.
I paid $130 for this Artwork to one of my Client today, do you guys think its worth it? Did i overpaid or underpaid or its okey? Anyways as per me, i loved it so much guys. Pixel art has always been my favourite thing so.😁
Anyways, don’t forget about $AIN 📉 $Q 📈 $LSK 📈 i’ve posted all three of this token analysis revently, don’t forget to check it out guys it might help you some how.
#ainusdt #QUSDT #LSKUSDT #PixelArtwork
I paid $130 for this Artwork to one of my Client today, do you guys think its worth it? Did i overpaid or underpaid or its okey? Anyways as per me, i loved it so much guys. Pixel art has always been my favourite thing so.😁
Anyways, don’t forget about $AIN 📉 $Q 📈 $LSK 📈 i’ve posted all three of this token analysis revently, don’t forget to check it out guys it might help you some how.
#ainusdt #QUSDT #LSKUSDT #PixelArtwork

7
1
1.7k
🚨 $AIN had made alot of questions for every traders right now, and i want to know the opinion of everyone of you guys.
What do you think? Will $AIN rise more from here or huge dump is sure?
{future}(AINUSDT)
🚨 $AIN had made alot of questions for every traders right now, and i want to know the opinion of everyone of you guys.
What do you think? Will $AIN rise more from here or huge dump is sure?
What do you think? Will $AIN rise more from here or huge dump is sure?
Bull🟢
37%
Bear🔴
63%
193 votes • Voting closed
3
3k
·
--
Bullish
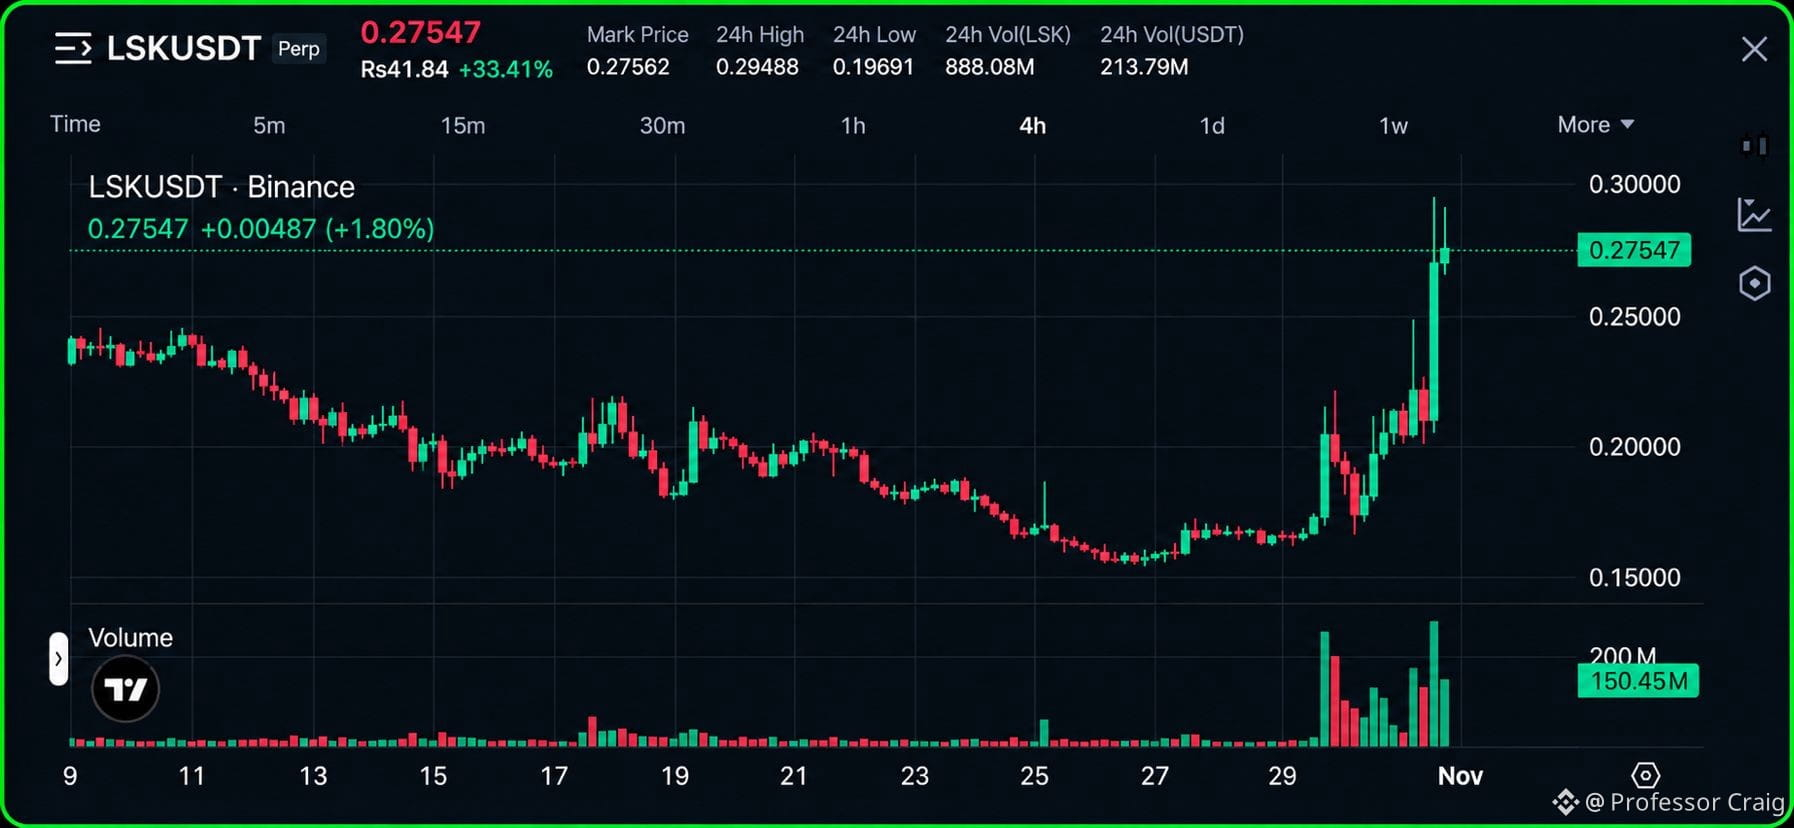
🚨$LSK is waking up after a long period of weakness. Is this the beginning of a much bigger recovery?
It has delivered a strong bullish move, climbing to $0.27547 with a 33.41% gain. What makes this move interesting is the sudden increase in buying volume, showing that traders are paying serious attention to it. Looking at the 4H chart, the price spent several weeks moving downward, falling from the $0.24 area toward $0.15. After building a base around $0.155 to $0.165, buyers started stepping in. The recovery became stronger around October 29, and now we are seeing a powerful breakout above the previous resistance zones.
The most important thing is that this rally is supported by increased volume. That makes the current move worth watching closely. However, the $0.285 to $0.295 area is the next major resistance zone. The previous 24H high is around $0.29488, so a strong move above this level could open the door toward $0.30 and potentially higher.
On the downside, $0.26 is an important area to watch. If it holds during a pullback, buyers could use it as a new support zone. Losing $0.25 would weaken the immediate bullish structure.
Long Trading Plan 📈
Entry Zone: $0.260 to $0.272
TP1: $0.285
TP2: $0.295
TP3: $0.315
Stop Loss: $0.247
My bias remains bullish while the price holds above the breakout area. I would rather see a healthy retest than chase the current green candles after such a strong move. It has already attracted attention with this rally. Now the real question is whether buyers have enough strength to push it through $0.30.
Can we see $0.35 next?
Anyways, we should also be watching at $AIN dump and $Q pump too guys.👀
{future}(QUSDT)
{future}(AINUSDT)
{future}(LSKUSDT)
#lskusdt #QUSDT #AINUSDT
🚨$LSK is waking up after a long period of weakness. Is this the beginning of a much bigger recovery?
It has delivered a strong bullish move, climbing to $0.27547 with a 33.41% gain. What makes this move interesting is the sudden increase in buying volume, showing that traders are paying serious attention to it. Looking at the 4H chart, the price spent several weeks moving downward, falling from the $0.24 area toward $0.15. After building a base around $0.155 to $0.165, buyers started stepping in. The recovery became stronger around October 29, and now we are seeing a powerful breakout above the previous resistance zones.
The most important thing is that this rally is supported by increased volume. That makes the current move worth watching closely. However, the $0.285 to $0.295 area is the next major resistance zone. The previous 24H high is around $0.29488, so a strong move above this level could open the door toward $0.30 and potentially higher.
On the downside, $0.26 is an important area to watch. If it holds during a pullback, buyers could use it as a new support zone. Losing $0.25 would weaken the immediate bullish structure.
Long Trading Plan 📈
Entry Zone: $0.260 to $0.272
TP1: $0.285
TP2: $0.295
TP3: $0.315
Stop Loss: $0.247
My bias remains bullish while the price holds above the breakout area. I would rather see a healthy retest than chase the current green candles after such a strong move. It has already attracted attention with this rally. Now the real question is whether buyers have enough strength to push it through $0.30.
Can we see $0.35 next?
Anyways, we should also be watching at $AIN dump and $Q pump too guys.👀
#lskusdt #QUSDT #AINUSDT
It has delivered a strong bullish move, climbing to $0.27547 with a 33.41% gain. What makes this move interesting is the sudden increase in buying volume, showing that traders are paying serious attention to it. Looking at the 4H chart, the price spent several weeks moving downward, falling from the $0.24 area toward $0.15. After building a base around $0.155 to $0.165, buyers started stepping in. The recovery became stronger around October 29, and now we are seeing a powerful breakout above the previous resistance zones.
The most important thing is that this rally is supported by increased volume. That makes the current move worth watching closely. However, the $0.285 to $0.295 area is the next major resistance zone. The previous 24H high is around $0.29488, so a strong move above this level could open the door toward $0.30 and potentially higher.
On the downside, $0.26 is an important area to watch. If it holds during a pullback, buyers could use it as a new support zone. Losing $0.25 would weaken the immediate bullish structure.
Long Trading Plan 📈
Entry Zone: $0.260 to $0.272
TP1: $0.285
TP2: $0.295
TP3: $0.315
Stop Loss: $0.247
My bias remains bullish while the price holds above the breakout area. I would rather see a healthy retest than chase the current green candles after such a strong move. It has already attracted attention with this rally. Now the real question is whether buyers have enough strength to push it through $0.30.
Can we see $0.35 next?
Anyways, we should also be watching at $AIN dump and $Q pump too guys.👀
#lskusdt #QUSDT #AINUSDT
2
1.4k
·
--
Bearish
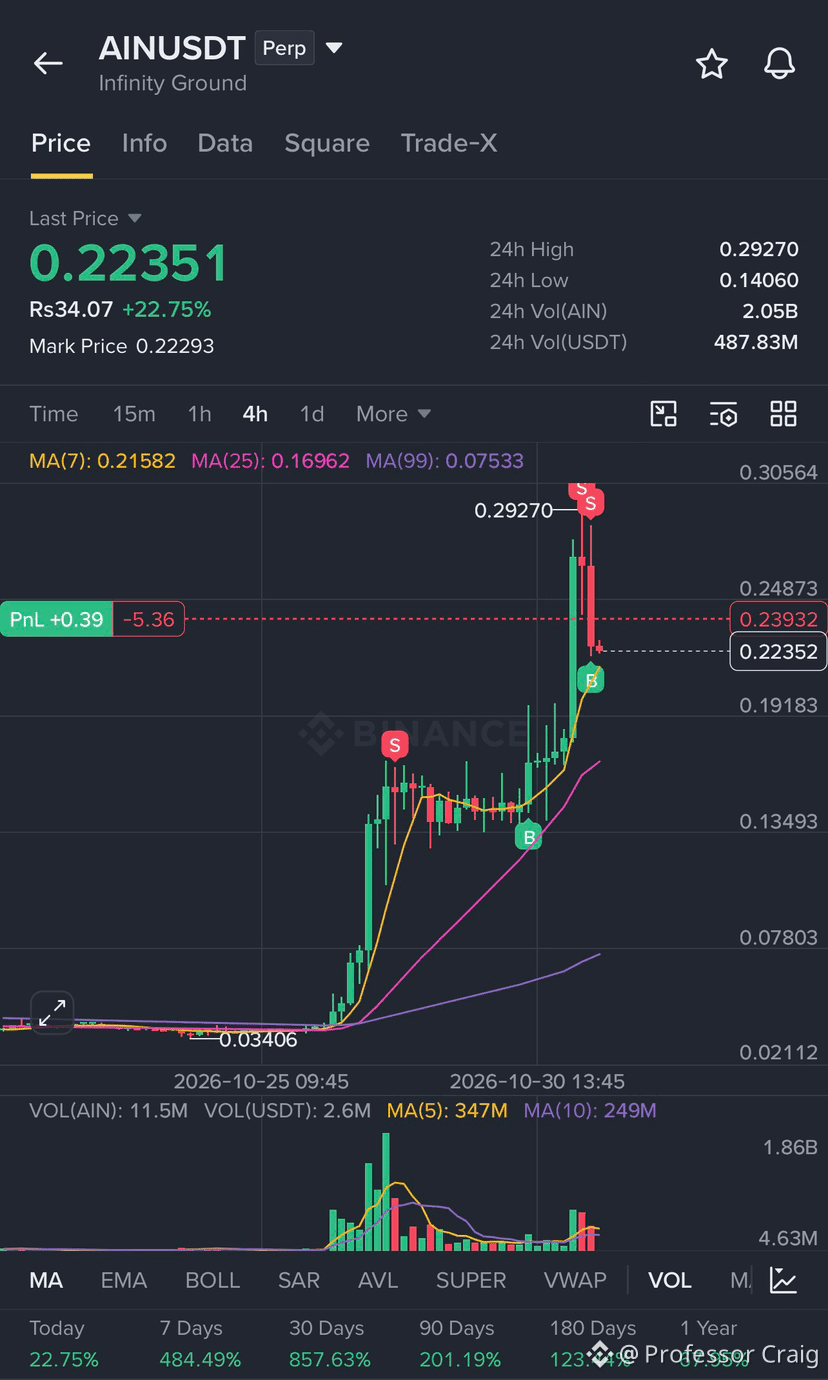
🚨$AIN USDT: Is a Massive Correction Coming?
It has faced a sharp rejection from $0.29270 and is now struggling around $0.2235. If selling pressure continues and support levels fail, a deeper correction toward its previous price zones could follow.
Short Trading Plan
* Entry: $0.2230–$0.2300
* TP1: $0.0790
* TP2: $0.0780
* TP3: $0.0700
* SL: $0.2480
The rally has been massive, but losing bullish momentum could open the door to a much deeper pullback.
Keep watching on $Q and $ZEC as well guys.
{future}(ZECUSDT)
{future}(QUSDT)
{future}(AINUSDT)
#qusdt #ZECUSDT #AINUSDT
🚨$AIN USDT: Is a Massive Correction Coming?
It has faced a sharp rejection from $0.29270 and is now struggling around $0.2235. If selling pressure continues and support levels fail, a deeper correction toward its previous price zones could follow.
Short Trading Plan
* Entry: $0.2230–$0.2300
* TP1: $0.0790
* TP2: $0.0780
* TP3: $0.0700
* SL: $0.2480
The rally has been massive, but losing bullish momentum could open the door to a much deeper pullback.
Keep watching on $Q and $ZEC as well guys.
#qusdt #ZECUSDT #AINUSDT
It has faced a sharp rejection from $0.29270 and is now struggling around $0.2235. If selling pressure continues and support levels fail, a deeper correction toward its previous price zones could follow.
Short Trading Plan
* Entry: $0.2230–$0.2300
* TP1: $0.0790
* TP2: $0.0780
* TP3: $0.0700
* SL: $0.2480
The rally has been massive, but losing bullish momentum could open the door to a much deeper pullback.
Keep watching on $Q and $ZEC as well guys.
#qusdt #ZECUSDT #AINUSDT
1
701
·
--
Bullish
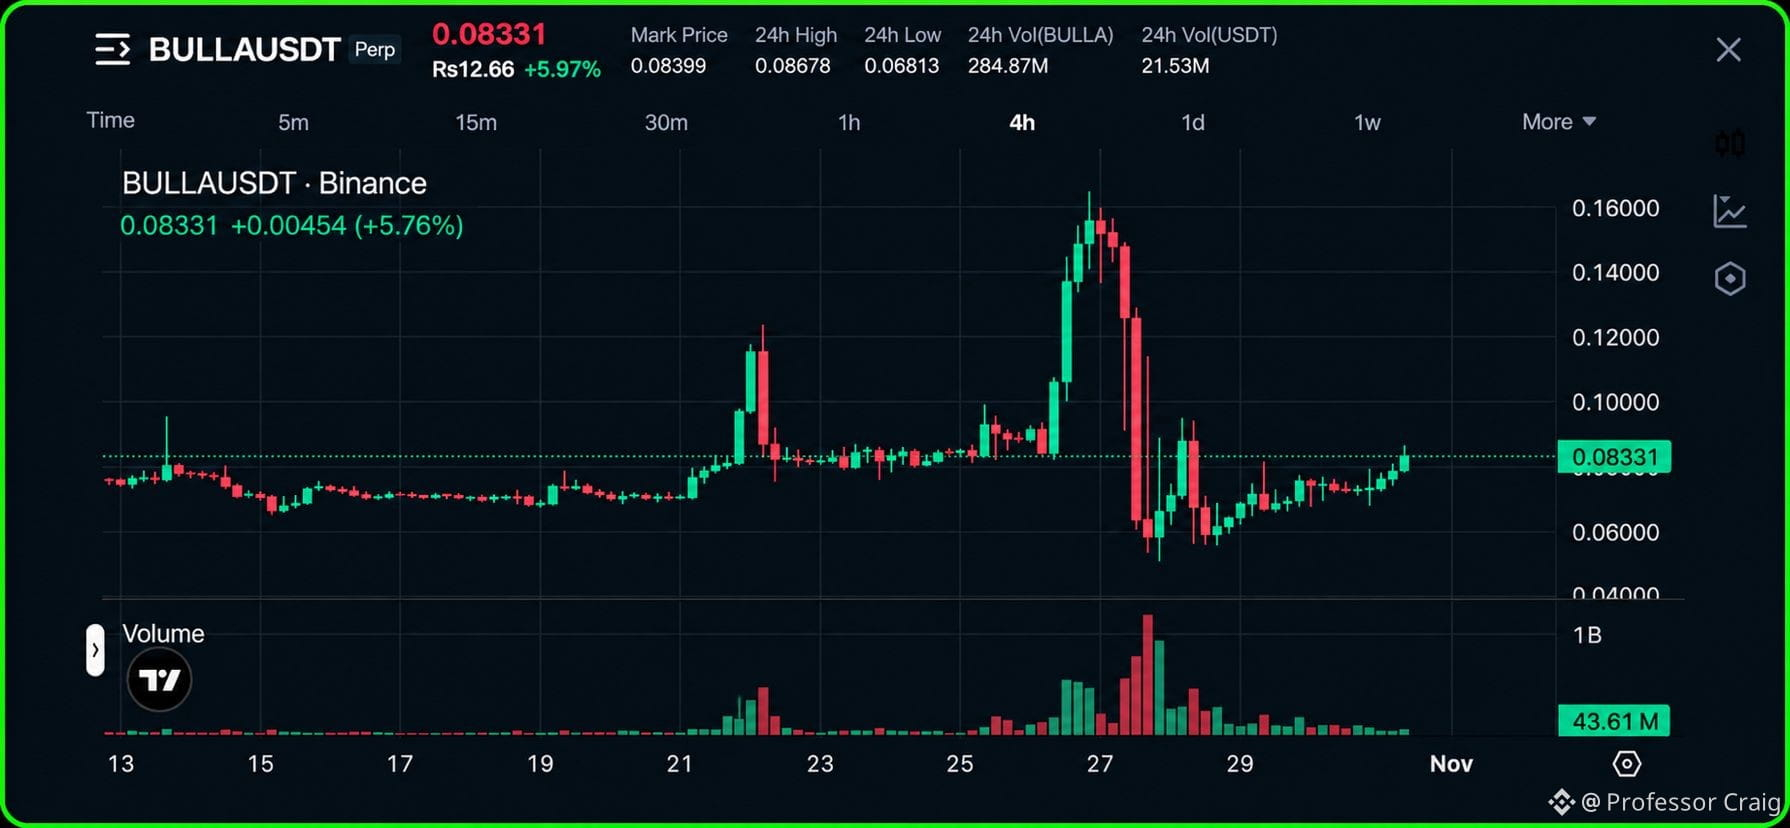
🚨 $BULLA is showing signs of a strong bullish comeback!
After a massive correction from its previous high around $0.16, BULLA has started recovering and is now trading near $0.0833 on the 4H timeframe. What’s interesting is that buyers are gradually regaining control after the sharp sell-off, with price building a recovery structure above the $0.065–$0.070 support zone.
The next important battle is around $0.088–$0.095. A clean breakout above this area could open the door toward $0.100 and potentially $0.120. Volume will be particularly important here because stronger buying activity could accelerate the next upward move.
Long Trading Plan
Entry: $0.0800–$0.0835
TP1: $0.0880
TP2: $0.0950
TP3: $0.1030
Stop Loss: $0.0745
It still has room to recover if buyers maintain control. I’m watching the $0.095 resistance closely because reclaiming that level could significantly strengthen the bullish outlook.
The recovery is getting interesting. Can BULLA make another serious run toward $0.12?
Keep an eyewatch on $AIN and $Q both are on every Traders watchlist.
{future}(QUSDT)
{future}(AINUSDT)
{future}(BULLAUSDT)
🚨 $BULLA is showing signs of a strong bullish comeback!
After a massive correction from its previous high around $0.16, BULLA has started recovering and is now trading near $0.0833 on the 4H timeframe. What’s interesting is that buyers are gradually regaining control after the sharp sell-off, with price building a recovery structure above the $0.065–$0.070 support zone.
The next important battle is around $0.088–$0.095. A clean breakout above this area could open the door toward $0.100 and potentially $0.120. Volume will be particularly important here because stronger buying activity could accelerate the next upward move.
Long Trading Plan
Entry: $0.0800–$0.0835
TP1: $0.0880
TP2: $0.0950
TP3: $0.1030
Stop Loss: $0.0745
It still has room to recover if buyers maintain control. I’m watching the $0.095 resistance closely because reclaiming that level could significantly strengthen the bullish outlook.
The recovery is getting interesting. Can BULLA make another serious run toward $0.12?
Keep an eyewatch on $AIN and $Q both are on every Traders watchlist.
After a massive correction from its previous high around $0.16, BULLA has started recovering and is now trading near $0.0833 on the 4H timeframe. What’s interesting is that buyers are gradually regaining control after the sharp sell-off, with price building a recovery structure above the $0.065–$0.070 support zone.
The next important battle is around $0.088–$0.095. A clean breakout above this area could open the door toward $0.100 and potentially $0.120. Volume will be particularly important here because stronger buying activity could accelerate the next upward move.
Long Trading Plan
Entry: $0.0800–$0.0835
TP1: $0.0880
TP2: $0.0950
TP3: $0.1030
Stop Loss: $0.0745
It still has room to recover if buyers maintain control. I’m watching the $0.095 resistance closely because reclaiming that level could significantly strengthen the bullish outlook.
The recovery is getting interesting. Can BULLA make another serious run toward $0.12?
Keep an eyewatch on $AIN and $Q both are on every Traders watchlist.
1
995
Log in to explore more content
Join global crypto users on Binance Square
⚡️ Get latest and useful information about crypto.
💬 Trusted by the world’s largest crypto exchange.
👍 Discover real insights from verified creators.
Email / Phone number
Trending Topics
BinanceWithdrawalScamWarning
13,313 views
415 Discussing
Binance Warns Users of Withdrawal Scams as Services Resume: It Will Never Charge Fees, Sell Queue Spots or Ask You to Move Funds to a “Vault”
Binance News
·10 Likes
·5k views
USMidtermElections
563,367 views
2,980 Discussing
USOctoberNFP-AreRateCutsStillPossible
22,266 views
397 Discussing