
Duy Thái
39 Posts

Duy Thái
Report
Block User
High-Frequency Trader
5.5 Years
93 Following
1.8K+ Followers
4.1K+ Liked
Posts
·
--
#OSMO/USDT ANALYSIS
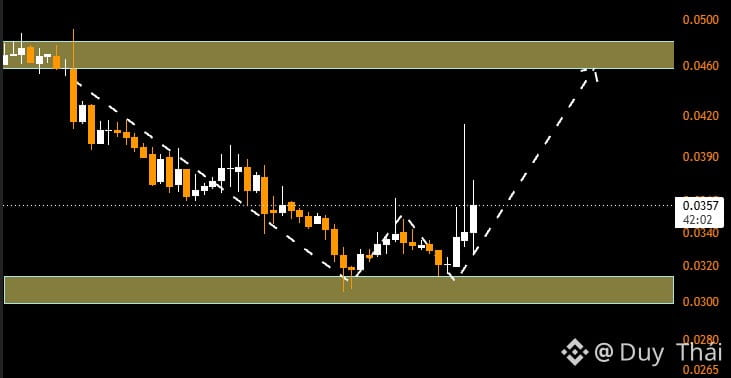
OSMO is showing signs of recovery after successfully testing the $0.030–$0.032 support zone. Buying pressure is beginning to emerge, helping the price rebound and form a short-term recovery.
If OSMO holds the current support zone and breaks through the $0.036–$0.038 resistance, the price could continue toward the $0.046–$0.048 zone.
Conversely, if it loses the $0.030 level, the recovery scenario will weaken, and selling pressure could return.
#OSMO/USDT ANALYSIS
OSMO is showing signs of recovery after successfully testing the $0.030–$0.032 support zone. Buying pressure is beginning to emerge, helping the price rebound and form a short-term recovery.
If OSMO holds the current support zone and breaks through the $0.036–$0.038 resistance, the price could continue toward the $0.046–$0.048 zone.
Conversely, if it loses the $0.030 level, the recovery scenario will weaken, and selling pressure could return.
OSMO is showing signs of recovery after successfully testing the $0.030–$0.032 support zone. Buying pressure is beginning to emerge, helping the price rebound and form a short-term recovery.
If OSMO holds the current support zone and breaks through the $0.036–$0.038 resistance, the price could continue toward the $0.046–$0.048 zone.
Conversely, if it loses the $0.030 level, the recovery scenario will weaken, and selling pressure could return.
171
·
--
#Total TOTAL MARKET CAP ANALYSIS
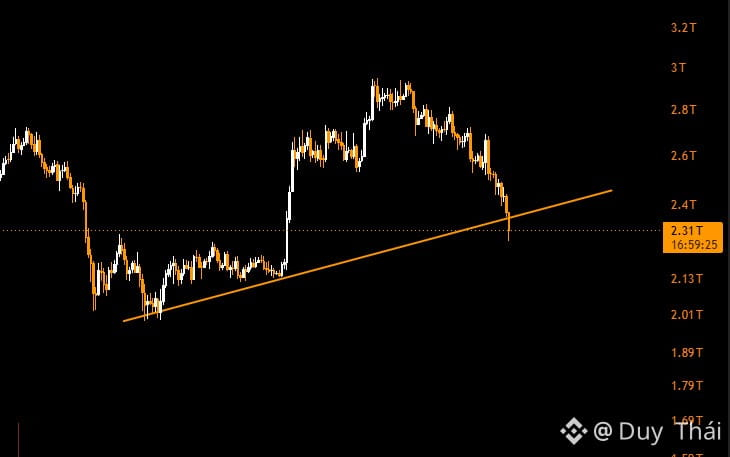
The total crypto market capitalization is currently under strong selling pressure after losing its upward support trendline around $2.35T.
This is a negative signal, indicating that capital flows are showing signs of weakening and the risk of a market-wide correction is increasing.
If TOTAL cannot quickly reclaim the $2.35T level, market capitalization could continue declining toward the $2.13T–$2.01T area.
Conversely, reclaiming the lost support level would be a signal to watch when assessing the potential for a recovery.
#Total TOTAL MARKET CAP ANALYSIS
The total crypto market capitalization is currently under strong selling pressure after losing its upward support trendline around $2.35T.
This is a negative signal, indicating that capital flows are showing signs of weakening and the risk of a market-wide correction is increasing.
If TOTAL cannot quickly reclaim the $2.35T level, market capitalization could continue declining toward the $2.13T–$2.01T area.
Conversely, reclaiming the lost support level would be a signal to watch when assessing the potential for a recovery.
The total crypto market capitalization is currently under strong selling pressure after losing its upward support trendline around $2.35T.
This is a negative signal, indicating that capital flows are showing signs of weakening and the risk of a market-wide correction is increasing.
If TOTAL cannot quickly reclaim the $2.35T level, market capitalization could continue declining toward the $2.13T–$2.01T area.
Conversely, reclaiming the lost support level would be a signal to watch when assessing the potential for a recovery.
1
937
·
--
#BTC/USDT ANALYSIS
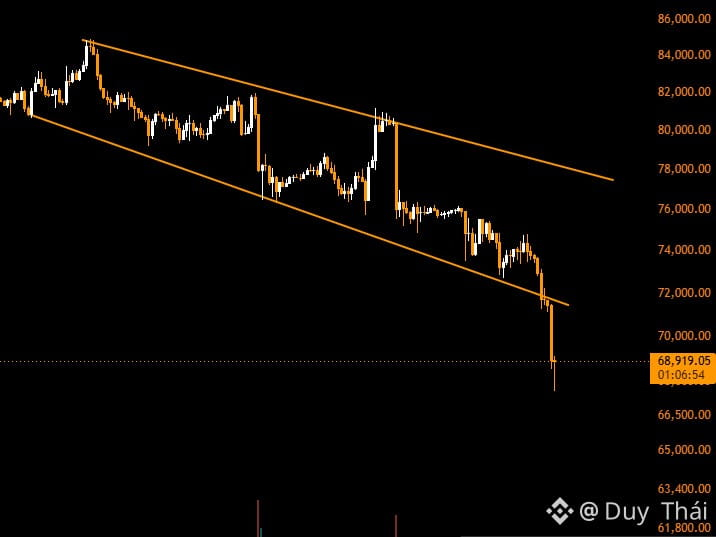
Bitcoin has now broken below the support line of the descending price channel, indicating increasing selling pressure and a market structure that continues to lean bearish.
At the same time, the $71,000–$72,000 support zone may now turn into resistance, potentially limiting price recoveries.
If BTC cannot reclaim this resistance zone, we could see another downward move toward the $66,500–$65,000 area.
Conversely, if the price quickly reclaims the $72,000 level, a false breakout scenario should be considered.
#BTC/USDT ANALYSIS
Bitcoin has now broken below the support line of the descending price channel, indicating increasing selling pressure and a market structure that continues to lean bearish.
At the same time, the $71,000–$72,000 support zone may now turn into resistance, potentially limiting price recoveries.
If BTC cannot reclaim this resistance zone, we could see another downward move toward the $66,500–$65,000 area.
Conversely, if the price quickly reclaims the $72,000 level, a false breakout scenario should be considered.
Bitcoin has now broken below the support line of the descending price channel, indicating increasing selling pressure and a market structure that continues to lean bearish.
At the same time, the $71,000–$72,000 support zone may now turn into resistance, potentially limiting price recoveries.
If BTC cannot reclaim this resistance zone, we could see another downward move toward the $66,500–$65,000 area.
Conversely, if the price quickly reclaims the $72,000 level, a false breakout scenario should be considered.
1
118
Log in to explore more content
Join global crypto users on Binance Square
⚡️ Get latest and useful information about crypto.
💬 Trusted by the world’s largest crypto exchange.
👍 Discover real insights from verified creators.
Email / Phone number
Trending Topics
WhatWillDriveCryptoandStocks’NextRebound?
50,006 views
692 Discussing
Bitcoin Slips Below $70,000 as Dollar Index Hits 19-Month High
Binance News
·16 Likes
·35.8k views
Anthropic’s6xIPODemandSignalsPotentialRecordRaise
15,919 views
337 Discussing
USCryptoETFsLose$1.48BInFiveDays
95 views
2 Discussing