
DK短线复刻
1.8k Posts

DK短线复刻
 Square Verified+
Report
Block User
交易不是孤注一掷,而是长期的占有概率优势。X@DKFK1688

黑马 Holder
High-Frequency Trader
9.1 Years
1.4K+ Following
62.8K+ Followers
61.3K+ Liked
Posts
All
Quotes
PINNED
·
--
Follow and reply to claim your red envelope🎁
Follow and reply to claim your red envelope🎁

652
8
37
830
PINNED

·
--
🐋 Open interest increased by 65.14% over $TLM 1 hours, as funds flow into the futures market.
Rising prices and rising open interest suggest bullish buyers are taking the initiative; falling prices and rising open interest suggest bears are active. When prices stay flat but open interest rises, something big is often brewing.
🐋 Open interest increased by 65.14% over $TLM 1 hours, as funds flow into the futures market.
Rising prices and rising open interest suggest bullish buyers are taking the initiative; falling prices and rising open interest suggest bears are active. When prices stay flat but open interest rises, something big is often brewing.
Rising prices and rising open interest suggest bullish buyers are taking the initiative; falling prices and rising open interest suggest bears are active. When prices stay flat but open interest rises, something big is often brewing.
1
127

·
--
$BTC reports 64986.99 (24h -1.12%) | Trending on Square: Personal opinion
Heated debate is one thing; market action is another.
#BTC
$BTC reports 64986.99 (24h -1.12%) | Trending on Square: Personal opinion
Heated debate is one thing; market action is another.
#BTC
Heated debate is one thing; market action is another.
#BTC
341
·
--
Fed’s Schmid: Demand has always been one of the factors affecting inflation—what does this mean for the market?
This is more about understanding what’s happening in the market, with limited relevance to current price movements.
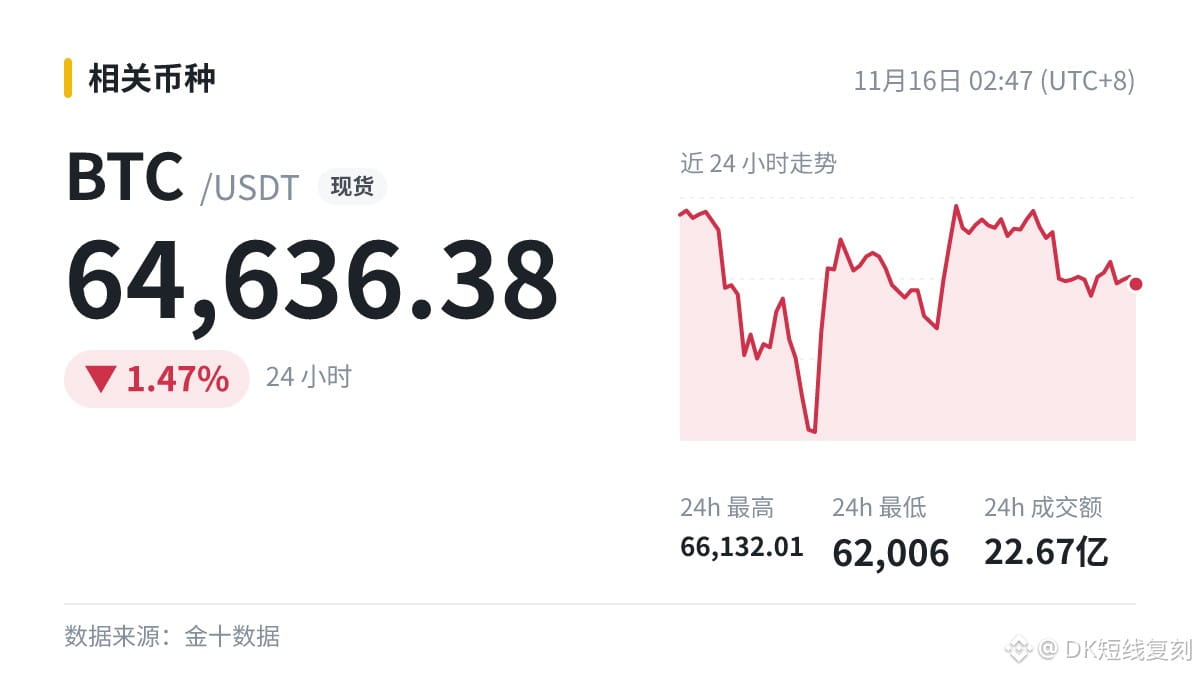
Market watch: $BTC Current price 64636.38 (24h -1.47%)
Fed’s Schmid: Demand has always been one of the factors affecting inflation—what does this mean for the market?
This is more about understanding what’s happening in the market, with limited relevance to current price movements.
Market watch: $BTC Current price 64636.38 (24h -1.47%)
This is more about understanding what’s happening in the market, with limited relevance to current price movements.
Market watch: $BTC Current price 64636.38 (24h -1.47%)
329
·
--
$BTW 5 minutes -3.61%🌧️
A mild pullback; it hasn’t broken down for now.
Current price: 0.556. When the sell-off is moving fast, don’t rush to call the bottom. What’s your instinct?
$BTW 5 minutes -3.61%🌧️
A mild pullback; it hasn’t broken down for now.
Current price: 0.556. When the sell-off is moving fast, don’t rush to call the bottom. What’s your instinct?
A mild pullback; it hasn’t broken down for now.
Current price: 0.556. When the sell-off is moving fast, don’t rush to call the bottom. What’s your instinct?
463
·
--
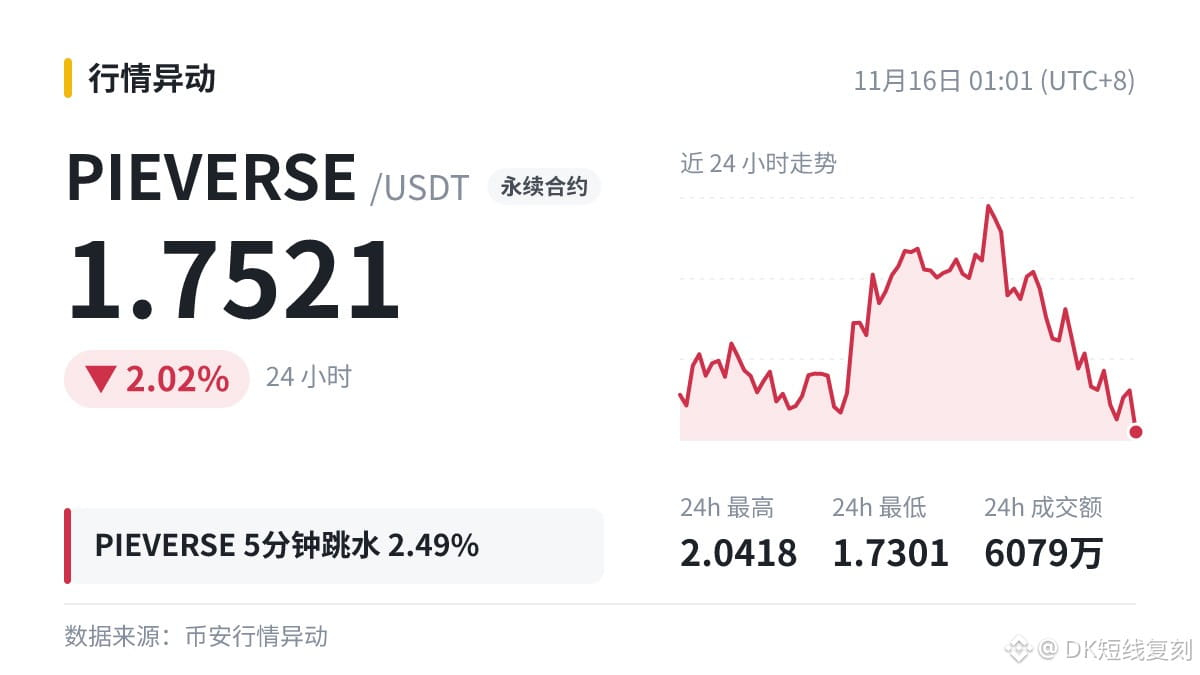
$PIEVERSE 5 Rapid plunge on the minute timeframe, down 2.49%, with the current price at 1.7521.
Support below is around the 24h low of 1.7301. A break below could open up further downside; if the rebound fails to reclaim the starting point of the decline, the weak structure remains intact.
Are you following along or staying on the sidelines?
$PIEVERSE 5 Rapid plunge on the minute timeframe, down 2.49%, with the current price at 1.7521.
Support below is around the 24h low of 1.7301. A break below could open up further downside; if the rebound fails to reclaim the starting point of the decline, the weak structure remains intact.
Are you following along or staying on the sidelines?
Support below is around the 24h low of 1.7301. A break below could open up further downside; if the rebound fails to reclaim the starting point of the decline, the weak structure remains intact.
Are you following along or staying on the sidelines?
1
674
·
--
🐋 Whale watchers, take note:
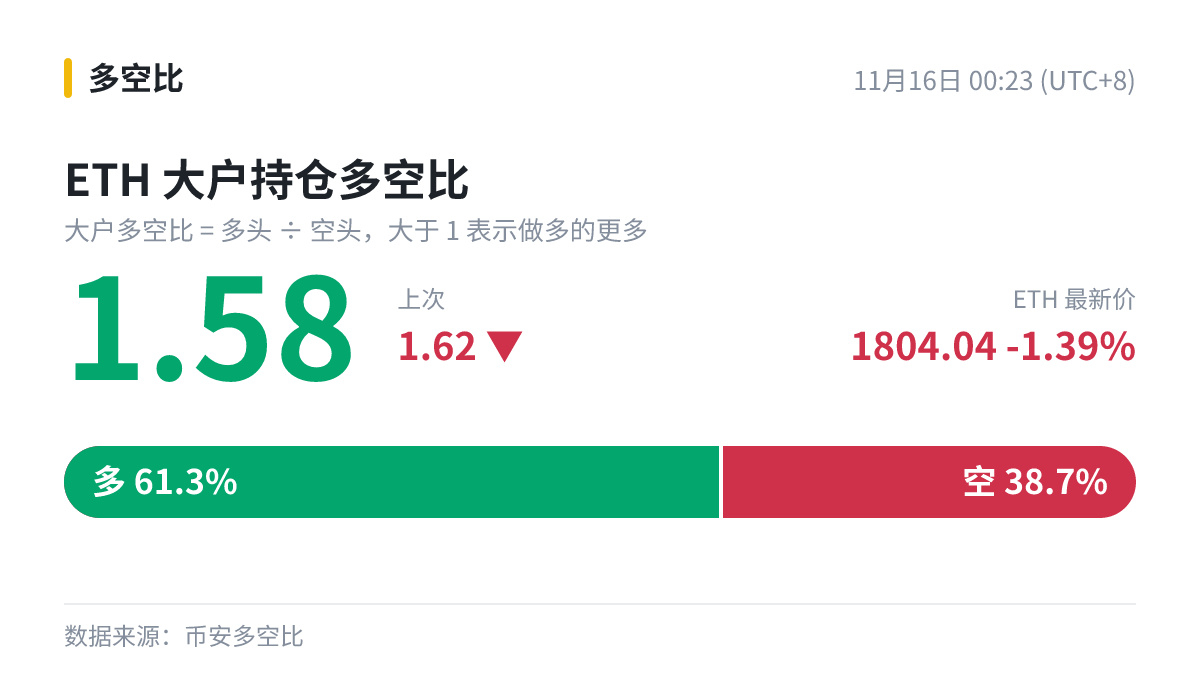
$ETH Large traders’ long/short position ratio: 1.58 (1 hour ago: 1.62).
Large traders’ positions: mostly long (61.3% long). Changes in large traders’ positions often lead price movements by half a step, so keep an eye on them.
🐋 Whale watchers, take note:
$ETH Large traders’ long/short position ratio: 1.58 (1 hour ago: 1.62).
Large traders’ positions: mostly long (61.3% long). Changes in large traders’ positions often lead price movements by half a step, so keep an eye on them.
$ETH Large traders’ long/short position ratio: 1.58 (1 hour ago: 1.62).
Large traders’ positions: mostly long (61.3% long). Changes in large traders’ positions often lead price movements by half a step, so keep an eye on them.
1
417
·
--
Unusual activity: $H 15 minutes +9.06%, trading at 0.01873.
Such a sharp rise—those who got in early may be getting out.
Unusual activity: $H 15 minutes +9.06%, trading at 0.01873.
Such a sharp rise—those who got in early may be getting out.
Such a sharp rise—those who got in early may be getting out.
351
·
--
Trending: League of Legends is getting a major upgrade
$SAND 24h traded 2.11 million; don't buy just because it's trending.
#SAND
Trending: League of Legends is getting a major upgrade
$SAND 24h traded 2.11 million; don't buy just because it's trending.
#SAND
$SAND 24h traded 2.11 million; don't buy just because it's trending.
#SAND
275
·
--
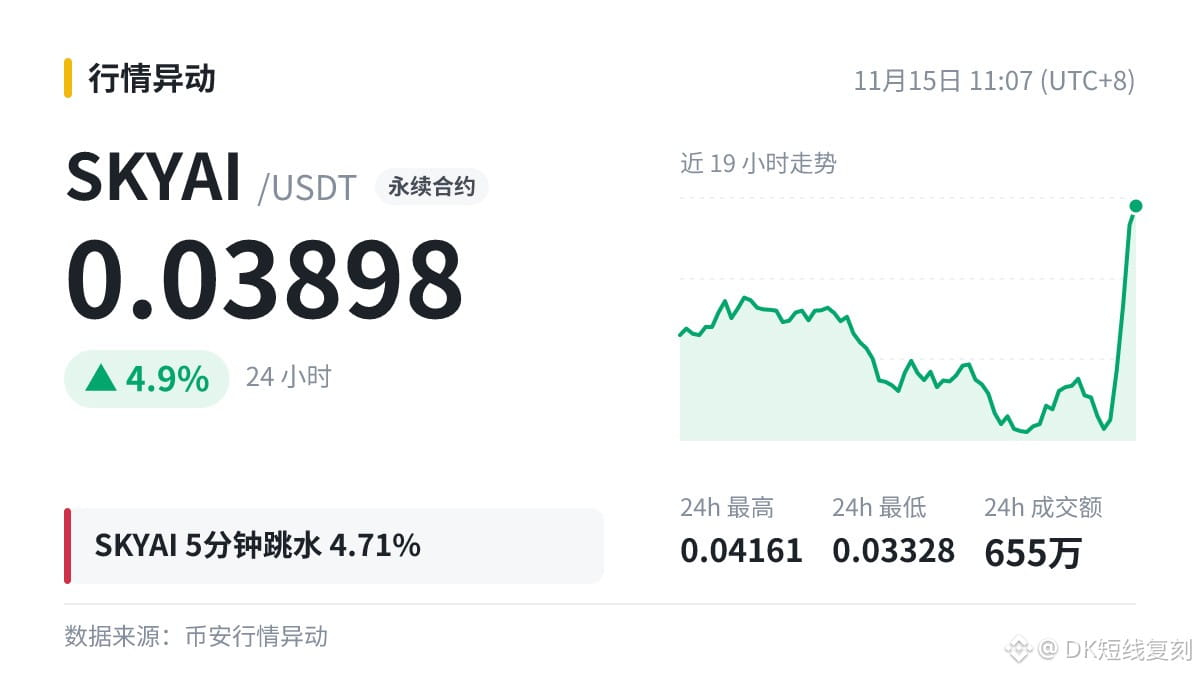
Market update: $SKYAI plunged 4.71% in 5 minutes, up 11.5% over 1h, with 24h volume at 6.55 million.
Futures traders, watch the funding rate—holding on too long can be costly.
Market update: $SKYAI plunged 4.71% in 5 minutes, up 11.5% over 1h, with 24h volume at 6.55 million.
Futures traders, watch the funding rate—holding on too long can be costly.
Futures traders, watch the funding rate—holding on too long can be costly.
253
·
--
Today's self-check: What good habits can you share?
Reduce your position before and after important data releases.
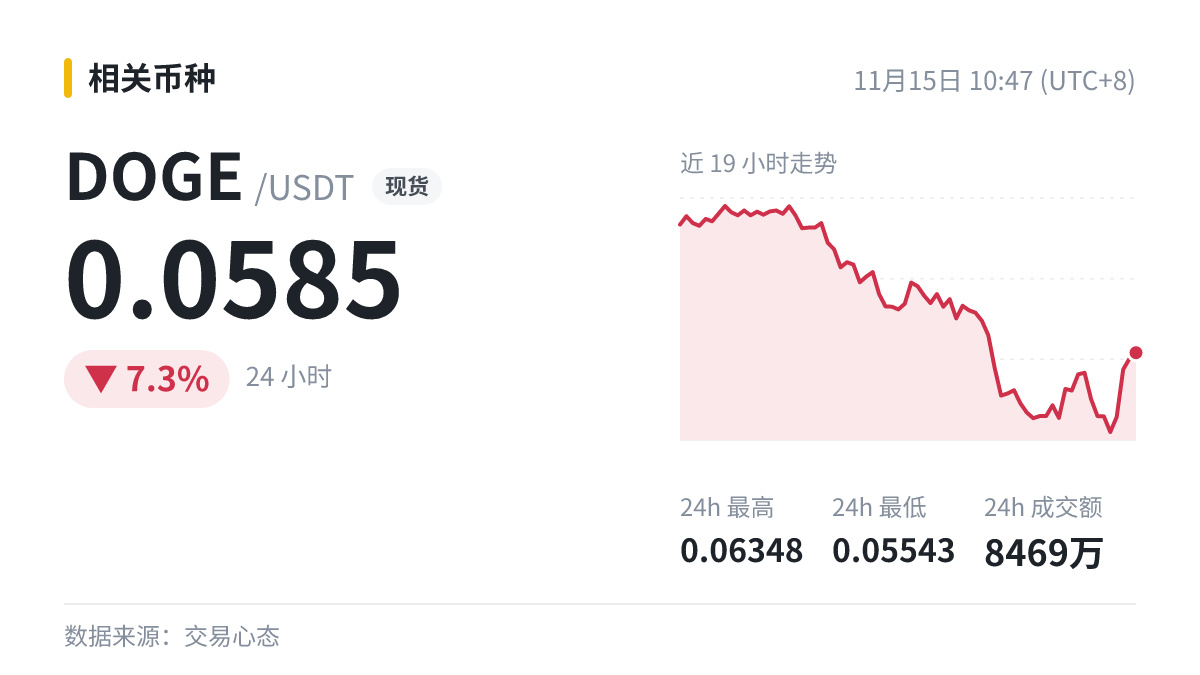
$DOGE is now 0.0585 (24h -7.3%)
#DOGE
Today's self-check: What good habits can you share?
Reduce your position before and after important data releases.
$DOGE is now 0.0585 (24h -7.3%)
#DOGE
Reduce your position before and after important data releases.
$DOGE is now 0.0585 (24h -7.3%)
#DOGE
473
·
--
Let’s look at a few numbers: $EVAA 15 minutes +6.15%, 1h +11.67%, 4h +8.54%, 24h +46.53%.
Current price: 1.589; 24h trading volume: $315 million.
The cumulative 24h gain is substantial, and volatility may increase noticeably. Leave a comment and share your thoughts—you might come up with a new perspective.
Let’s look at a few numbers: $EVAA 15 minutes +6.15%, 1h +11.67%, 4h +8.54%, 24h +46.53%.
Current price: 1.589; 24h trading volume: $315 million.
The cumulative 24h gain is substantial, and volatility may increase noticeably. Leave a comment and share your thoughts—you might come up with a new perspective.
Current price: 1.589; 24h trading volume: $315 million.
The cumulative 24h gain is substantial, and volatility may increase noticeably. Leave a comment and share your thoughts—you might come up with a new perspective.
189
·
--
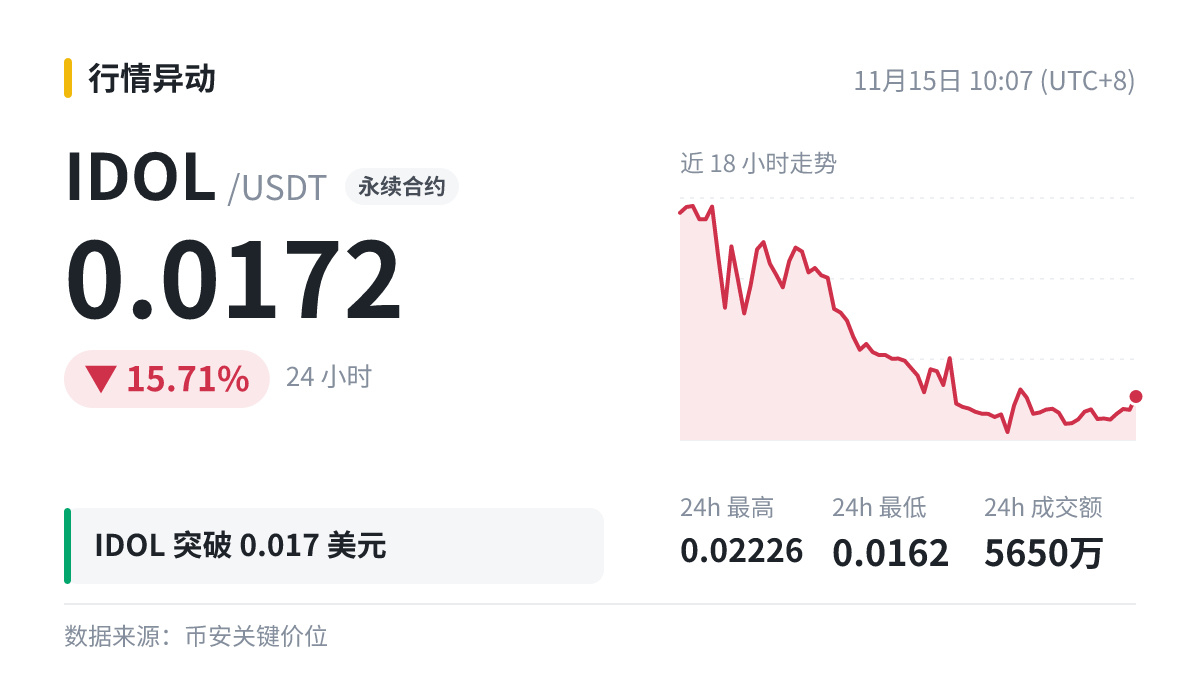
$IDOL breaks through the 0.017 level.
Let’s use this number to break down whole-number levels.
Support and resistance are more like zones than precise, single-point levels; it’s normal for prices to test the area back and forth.
Breaking through a level only means one side has the upper hand at that moment. How much further the price can go depends on where the next level is and whether capital can keep up.
With leveraged trading, first consider whether you can withstand the worst-case outcome, then look at what the signals are saying.
$IDOL breaks through the 0.017 level.
Let’s use this number to break down whole-number levels.
Support and resistance are more like zones than precise, single-point levels; it’s normal for prices to test the area back and forth.
Breaking through a level only means one side has the upper hand at that moment. How much further the price can go depends on where the next level is and whether capital can keep up.
With leveraged trading, first consider whether you can withstand the worst-case outcome, then look at what the signals are saying.
Let’s use this number to break down whole-number levels.
Support and resistance are more like zones than precise, single-point levels; it’s normal for prices to test the area back and forth.
Breaking through a level only means one side has the upper hand at that moment. How much further the price can go depends on where the next level is and whether capital can keep up.
With leveraged trading, first consider whether you can withstand the worst-case outcome, then look at what the signals are saying.
1
306
·
--
📣 Three-line summary
① Glassnode: Stablecoin supply is shrinking rapidly, with monthly outflows reaching their highest level since 2022
② Source: Odaily Planet Daily, slightly bullish
③ $BTC is currently at 62299.76, 24h -8.89%
Is this news more bullish or bearish?
📣 Three-line summary
① Glassnode: Stablecoin supply is shrinking rapidly, with monthly outflows reaching their highest level since 2022
② Source: Odaily Planet Daily, slightly bullish
③ $BTC is currently at 62299.76, 24h -8.89%
Is this news more bullish or bearish?
① Glassnode: Stablecoin supply is shrinking rapidly, with monthly outflows reaching their highest level since 2022
② Source: Odaily Planet Daily, slightly bullish
③ $BTC is currently at 62299.76, 24h -8.89%
Is this news more bullish or bearish?
1
697
·
--
$KOMA 5 minutes -2.69%, at 0.01273, 24h +1.92%.
It has dropped, but don't rush to act just yet.
$KOMA 5 minutes -2.69%, at 0.01273, 24h +1.92%.
It has dropped, but don't rush to act just yet.
It has dropped, but don't rush to act just yet.
1
787
·
--
Most people think the Cancun upgrade and blobs are simple, but this is where it’s easy to get things wrong:
Blob data cannot be read by the EVM; contracts can only access a versioned hash derived from the blob’s KZG commitment.
Layer 2 networks only need to ensure that anyone can download transaction data to verify the results during the period when verification is needed. The mainnet does not need to store this data permanently.
When comparing fees across Layer 2 networks, remember to distinguish between the Layer 2 network’s own execution fees and the cost of submitting data to mainnet. Both can fluctuate.
Layer 2 networks pay blob fees to submit blob data to mainnet, and these fees are also settled in $ETH . Currently, 1731.78.
Most people think the Cancun upgrade and blobs are simple, but this is where it’s easy to get things wrong:
Blob data cannot be read by the EVM; contracts can only access a versioned hash derived from the blob’s KZG commitment.
Layer 2 networks only need to ensure that anyone can download transaction data to verify the results during the period when verification is needed. The mainnet does not need to store this data permanently.
When comparing fees across Layer 2 networks, remember to distinguish between the Layer 2 network’s own execution fees and the cost of submitting data to mainnet. Both can fluctuate.
Layer 2 networks pay blob fees to submit blob data to mainnet, and these fees are also settled in $ETH . Currently, 1731.78.
Blob data cannot be read by the EVM; contracts can only access a versioned hash derived from the blob’s KZG commitment.
Layer 2 networks only need to ensure that anyone can download transaction data to verify the results during the period when verification is needed. The mainnet does not need to store this data permanently.
When comparing fees across Layer 2 networks, remember to distinguish between the Layer 2 network’s own execution fees and the cost of submitting data to mainnet. Both can fluctuate.
Layer 2 networks pay blob fees to submit blob data to mainnet, and these fees are also settled in $ETH . Currently, 1731.78.
1
927
·
--
Longs got wiped out again.
💣 $KAVA 1-hour drop of 7.2%, current price 0.02655 (24h -60.99%).
To see if it stabilizes, watch the candlestick chart—not how much it’s fallen. How high do you think the rebound can go?
#KAVA
Longs got wiped out again.
💣 $KAVA 1-hour drop of 7.2%, current price 0.02655 (24h -60.99%).
To see if it stabilizes, watch the candlestick chart—not how much it’s fallen. How high do you think the rebound can go?
#KAVA
💣 $KAVA 1-hour drop of 7.2%, current price 0.02655 (24h -60.99%).
To see if it stabilizes, watch the candlestick chart—not how much it’s fallen. How high do you think the rebound can go?
#KAVA
1
603
Log in to explore more content
Join global crypto users on Binance Square
⚡️ Get latest and useful information about crypto.
💬 Trusted by the world’s largest crypto exchange.
👍 Discover real insights from verified creators.
Email / Phone number
Trending Topics
CryptoSelloffTriggersMultipleWhaleLiquidations
169,455 views
1,728 Discussing
Crypto Liquidations Top $2B in 24 Hours as 329,000 Traders Are Wiped Out
Binance News
·39 Likes
·52.3k views
USSpotXRPETFsSeeLargestWeeklyOutflowIn8Months
153,290 views
1,522 Discussing
WillFOMCMinutesReinforceRateHikeExpectations?
44,325 views
718 Discussing