

无秋⁶⁶⁶
 Square Verified+
📌技术分析&交易心理 | 🎈推特@mackeybht | 🌍公众号:无秋Web3.0

Top traders by profit in 30D

Top 30D Traders by Volume
Open Trade

BNB Holder
High-Frequency Trader
5.6 Years
216 Following
51.3K+ Followers
45.6K+ Liked
2 Badges
Posts
Portfolio
All
Quotes
Videos
Live


·
--
🎙️ Good night⁶⁶⁶, when will the downtrend end, and how much do you know about liquidations?

End
03 h 54 m 13 s
2.7k
0
无秋⁶⁶⁶
·
--
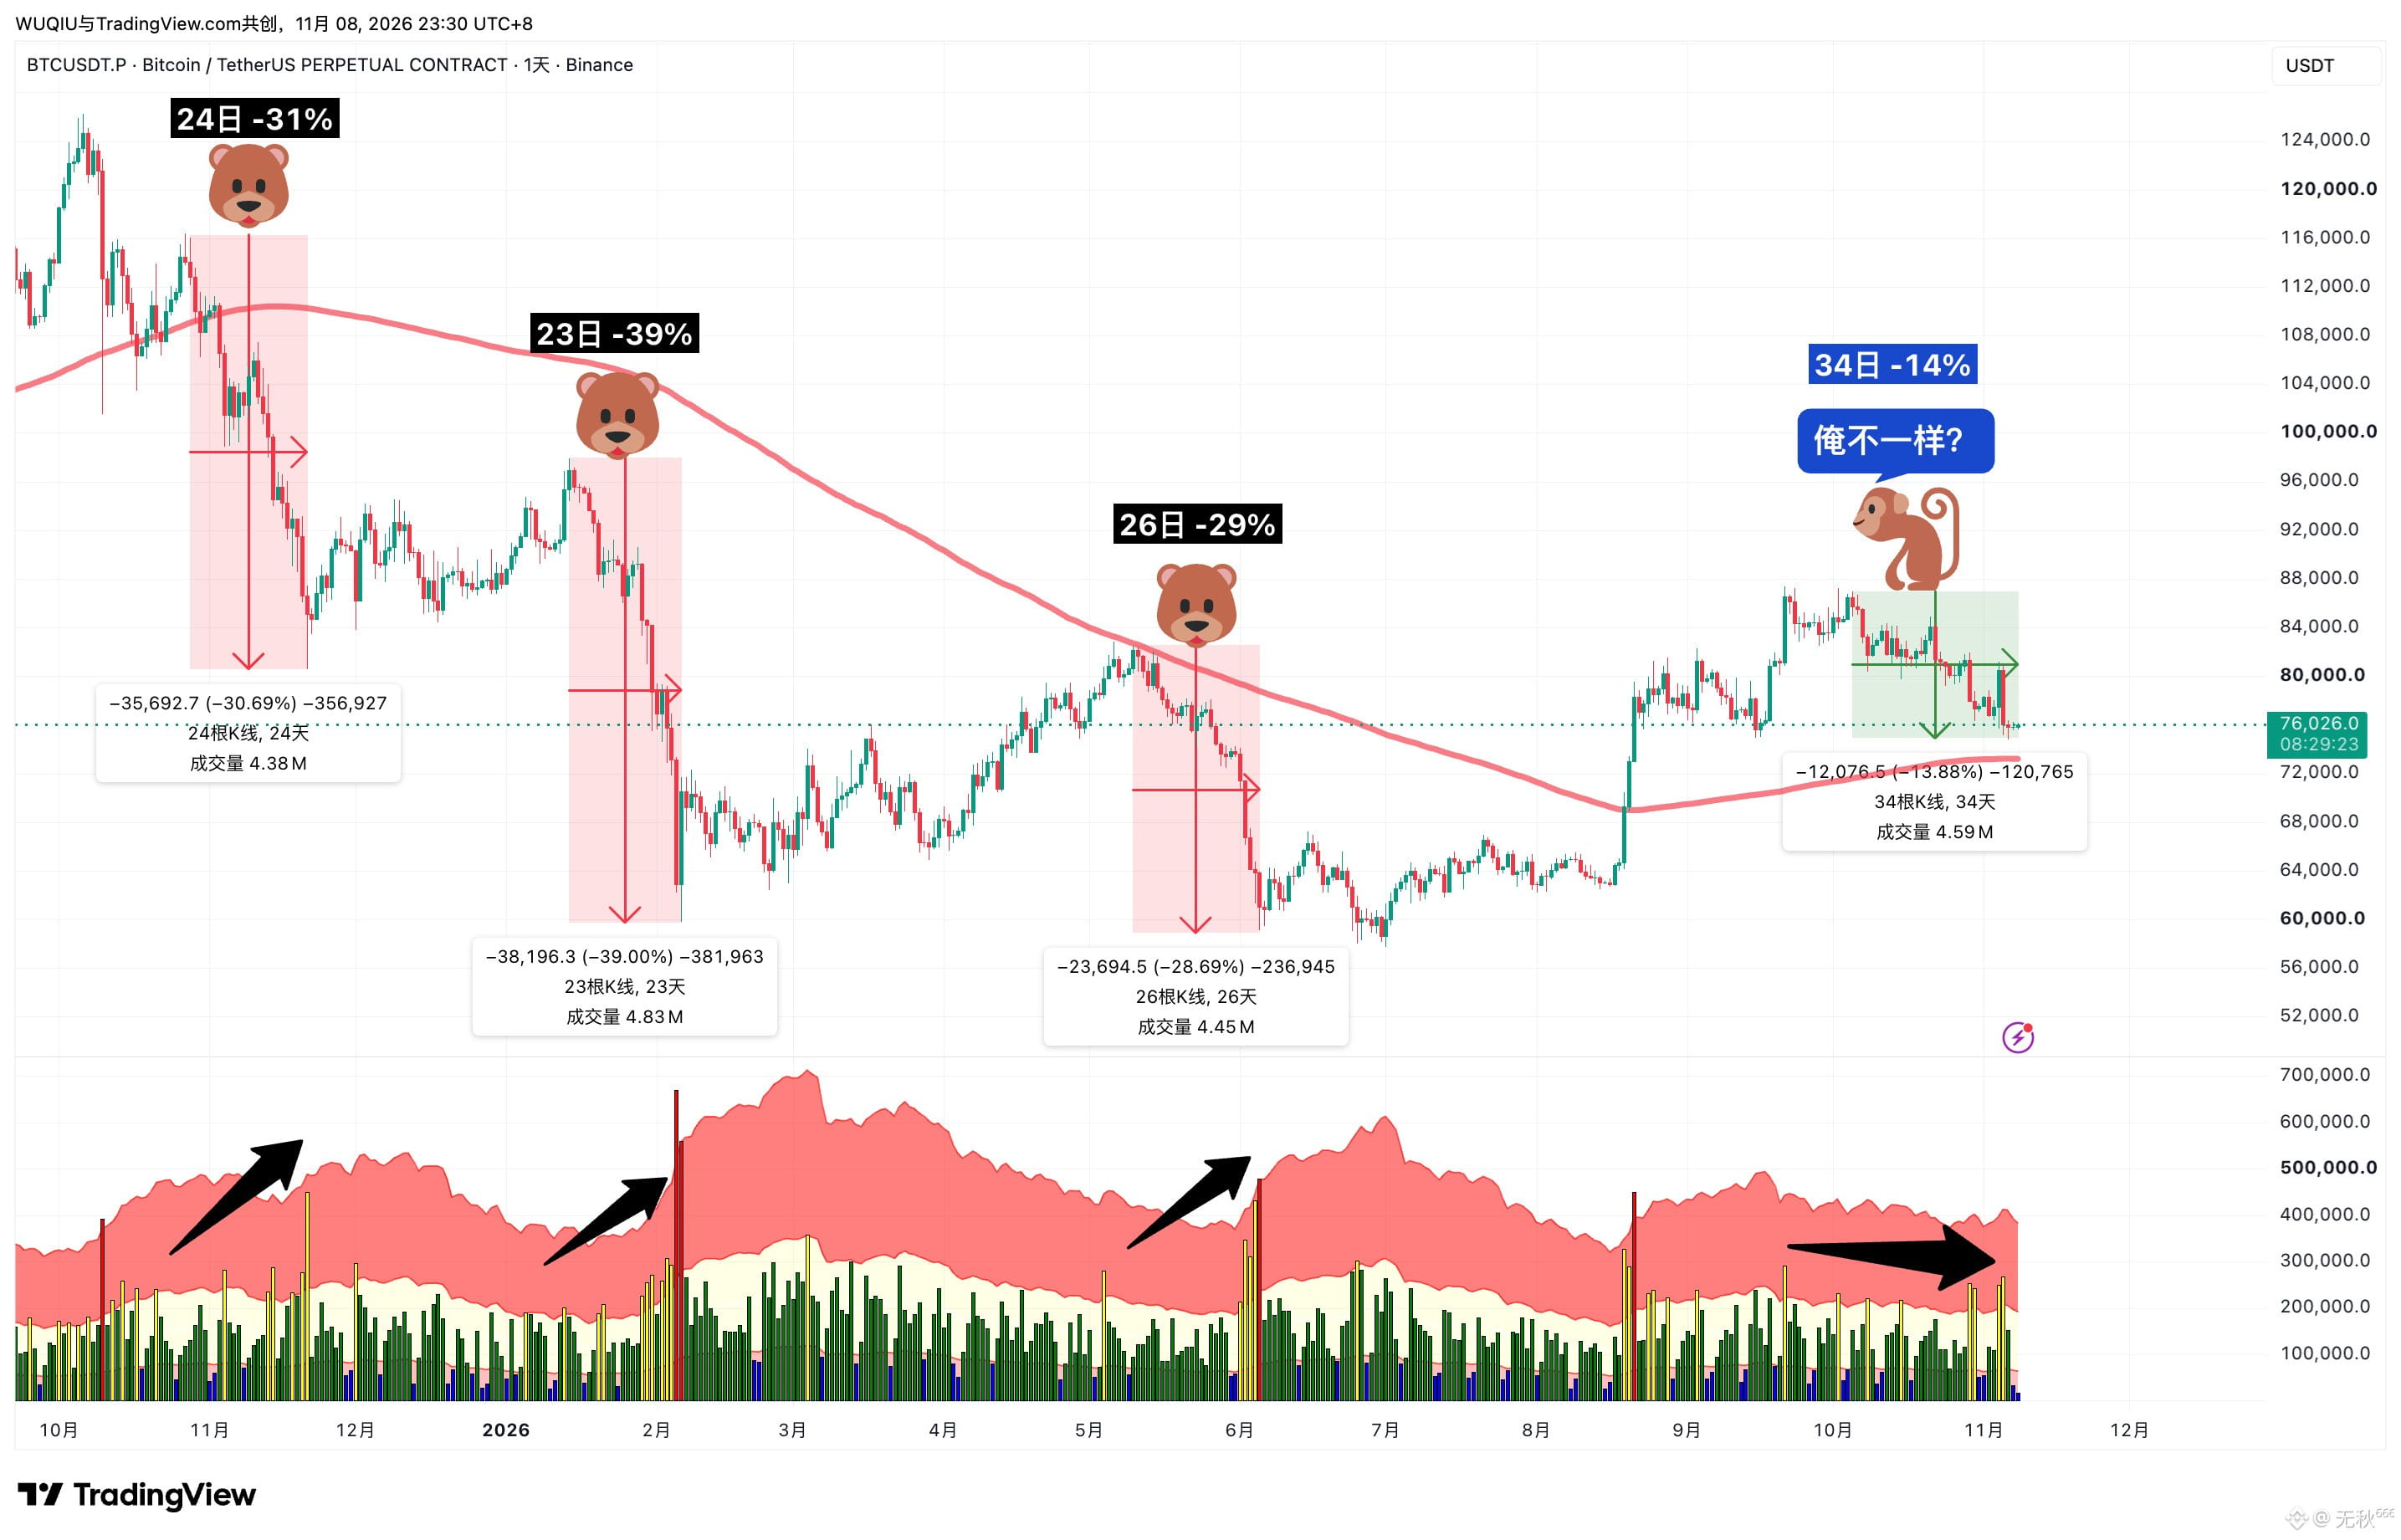
Pessimistic views are pretty normal right now
There’s too much noise
Even many people who want to buy spot are afraid to do so
It was the same last time
Those who missed the rally keep missing out
Those waiting to build positions have already started doing so according to plan
The bottom of a major trend isn’t for short-term gamblers
No charlatan can predict market direction with so-called technical analysis
If you’ve already started building a position
Make sure your liquidation price is extremely low and your position is absolutely safe
The best way to respect the market
Is not to take on a position you can’t afford
Remember:
A favorable entry point
A safe liquidation price
Absolute patience
What lets you navigate the market has never been technical analysis or entry points—it’s your position management.
We all understand the principles
What we lack is discipline
#加密美股齐跌,下轮反弹的驱动力在哪? #对冲基金CME比特币净空头降89%
There’s too much noise
Even many people who want to buy spot are afraid to do so
It was the same last time
Those who missed the rally keep missing out
Those waiting to build positions have already started doing so according to plan
The bottom of a major trend isn’t for short-term gamblers
No charlatan can predict market direction with so-called technical analysis
If you’ve already started building a position
Make sure your liquidation price is extremely low and your position is absolutely safe
The best way to respect the market
Is not to take on a position you can’t afford
Remember:
A favorable entry point
A safe liquidation price
Absolute patience
What lets you navigate the market has never been technical analysis or entry points—it’s your position management.
We all understand the principles
What we lack is discipline
#加密美股齐跌,下轮反弹的驱动力在哪? #对冲基金CME比特币净空头降89%


无秋⁶⁶⁶
·
--
🌕 One more thing to add to what I said earlier: some folks have messaged me privately asking what to do if a trade based on BTC’s daily MA200 fails:
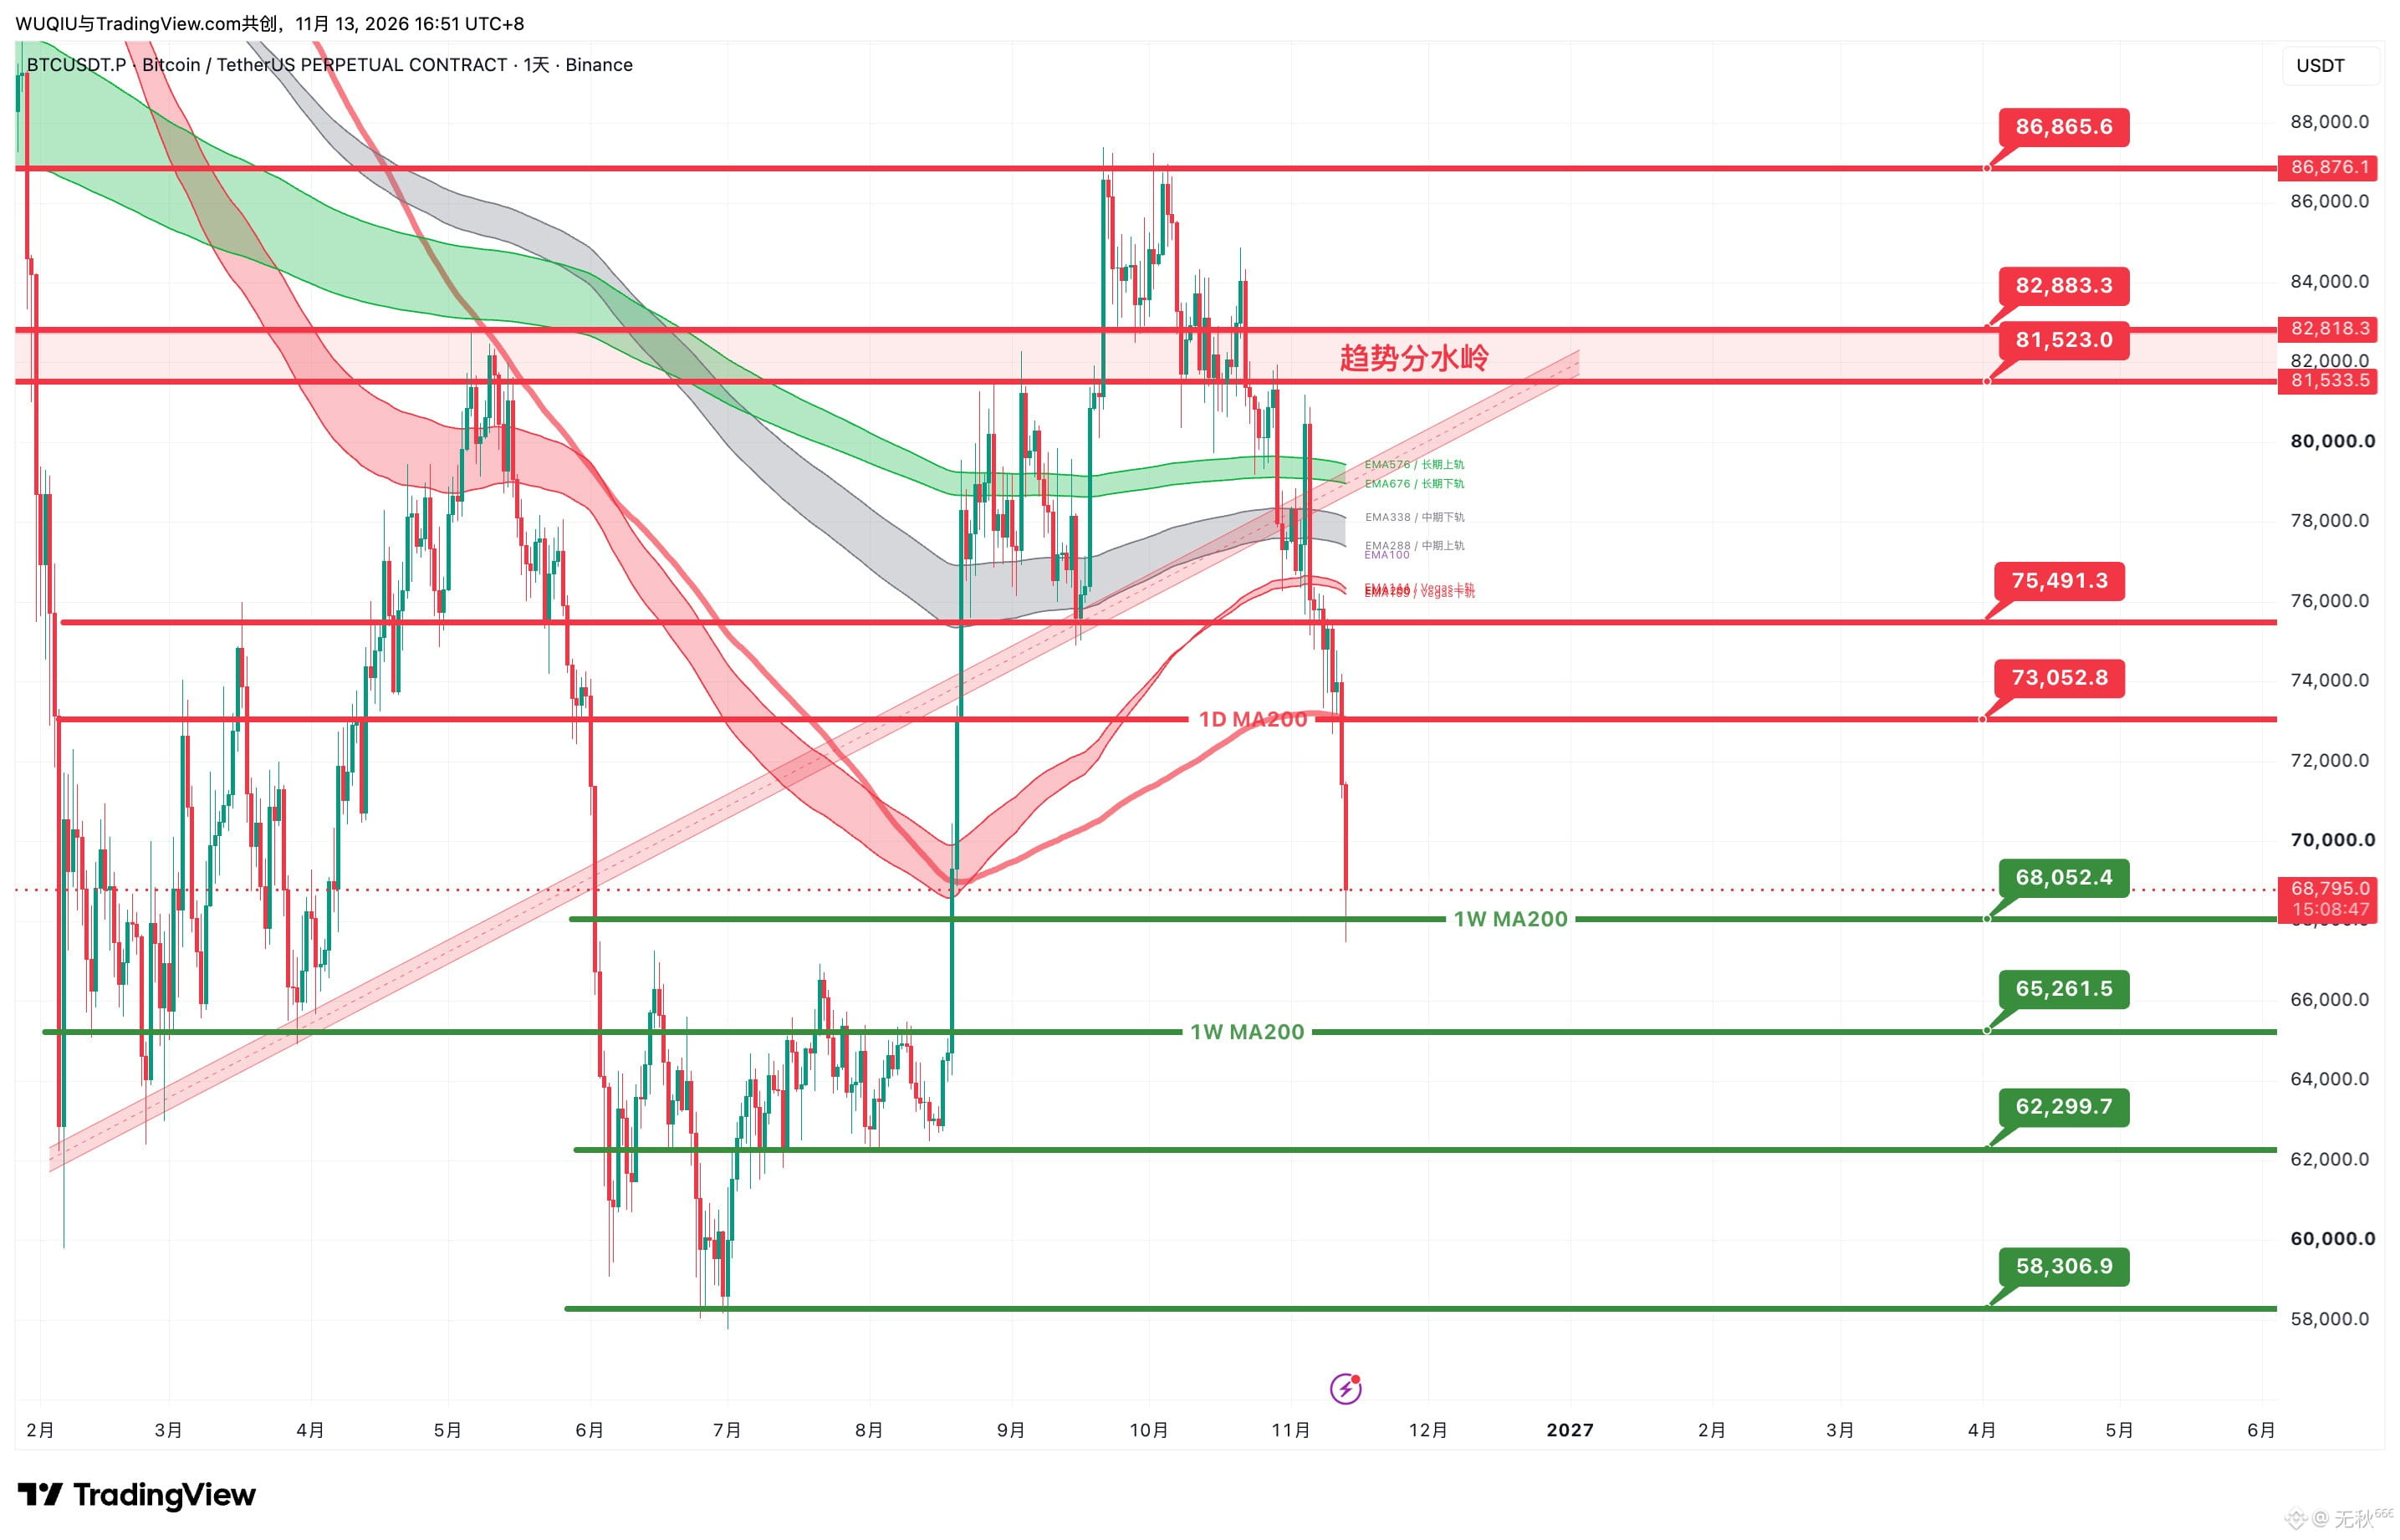
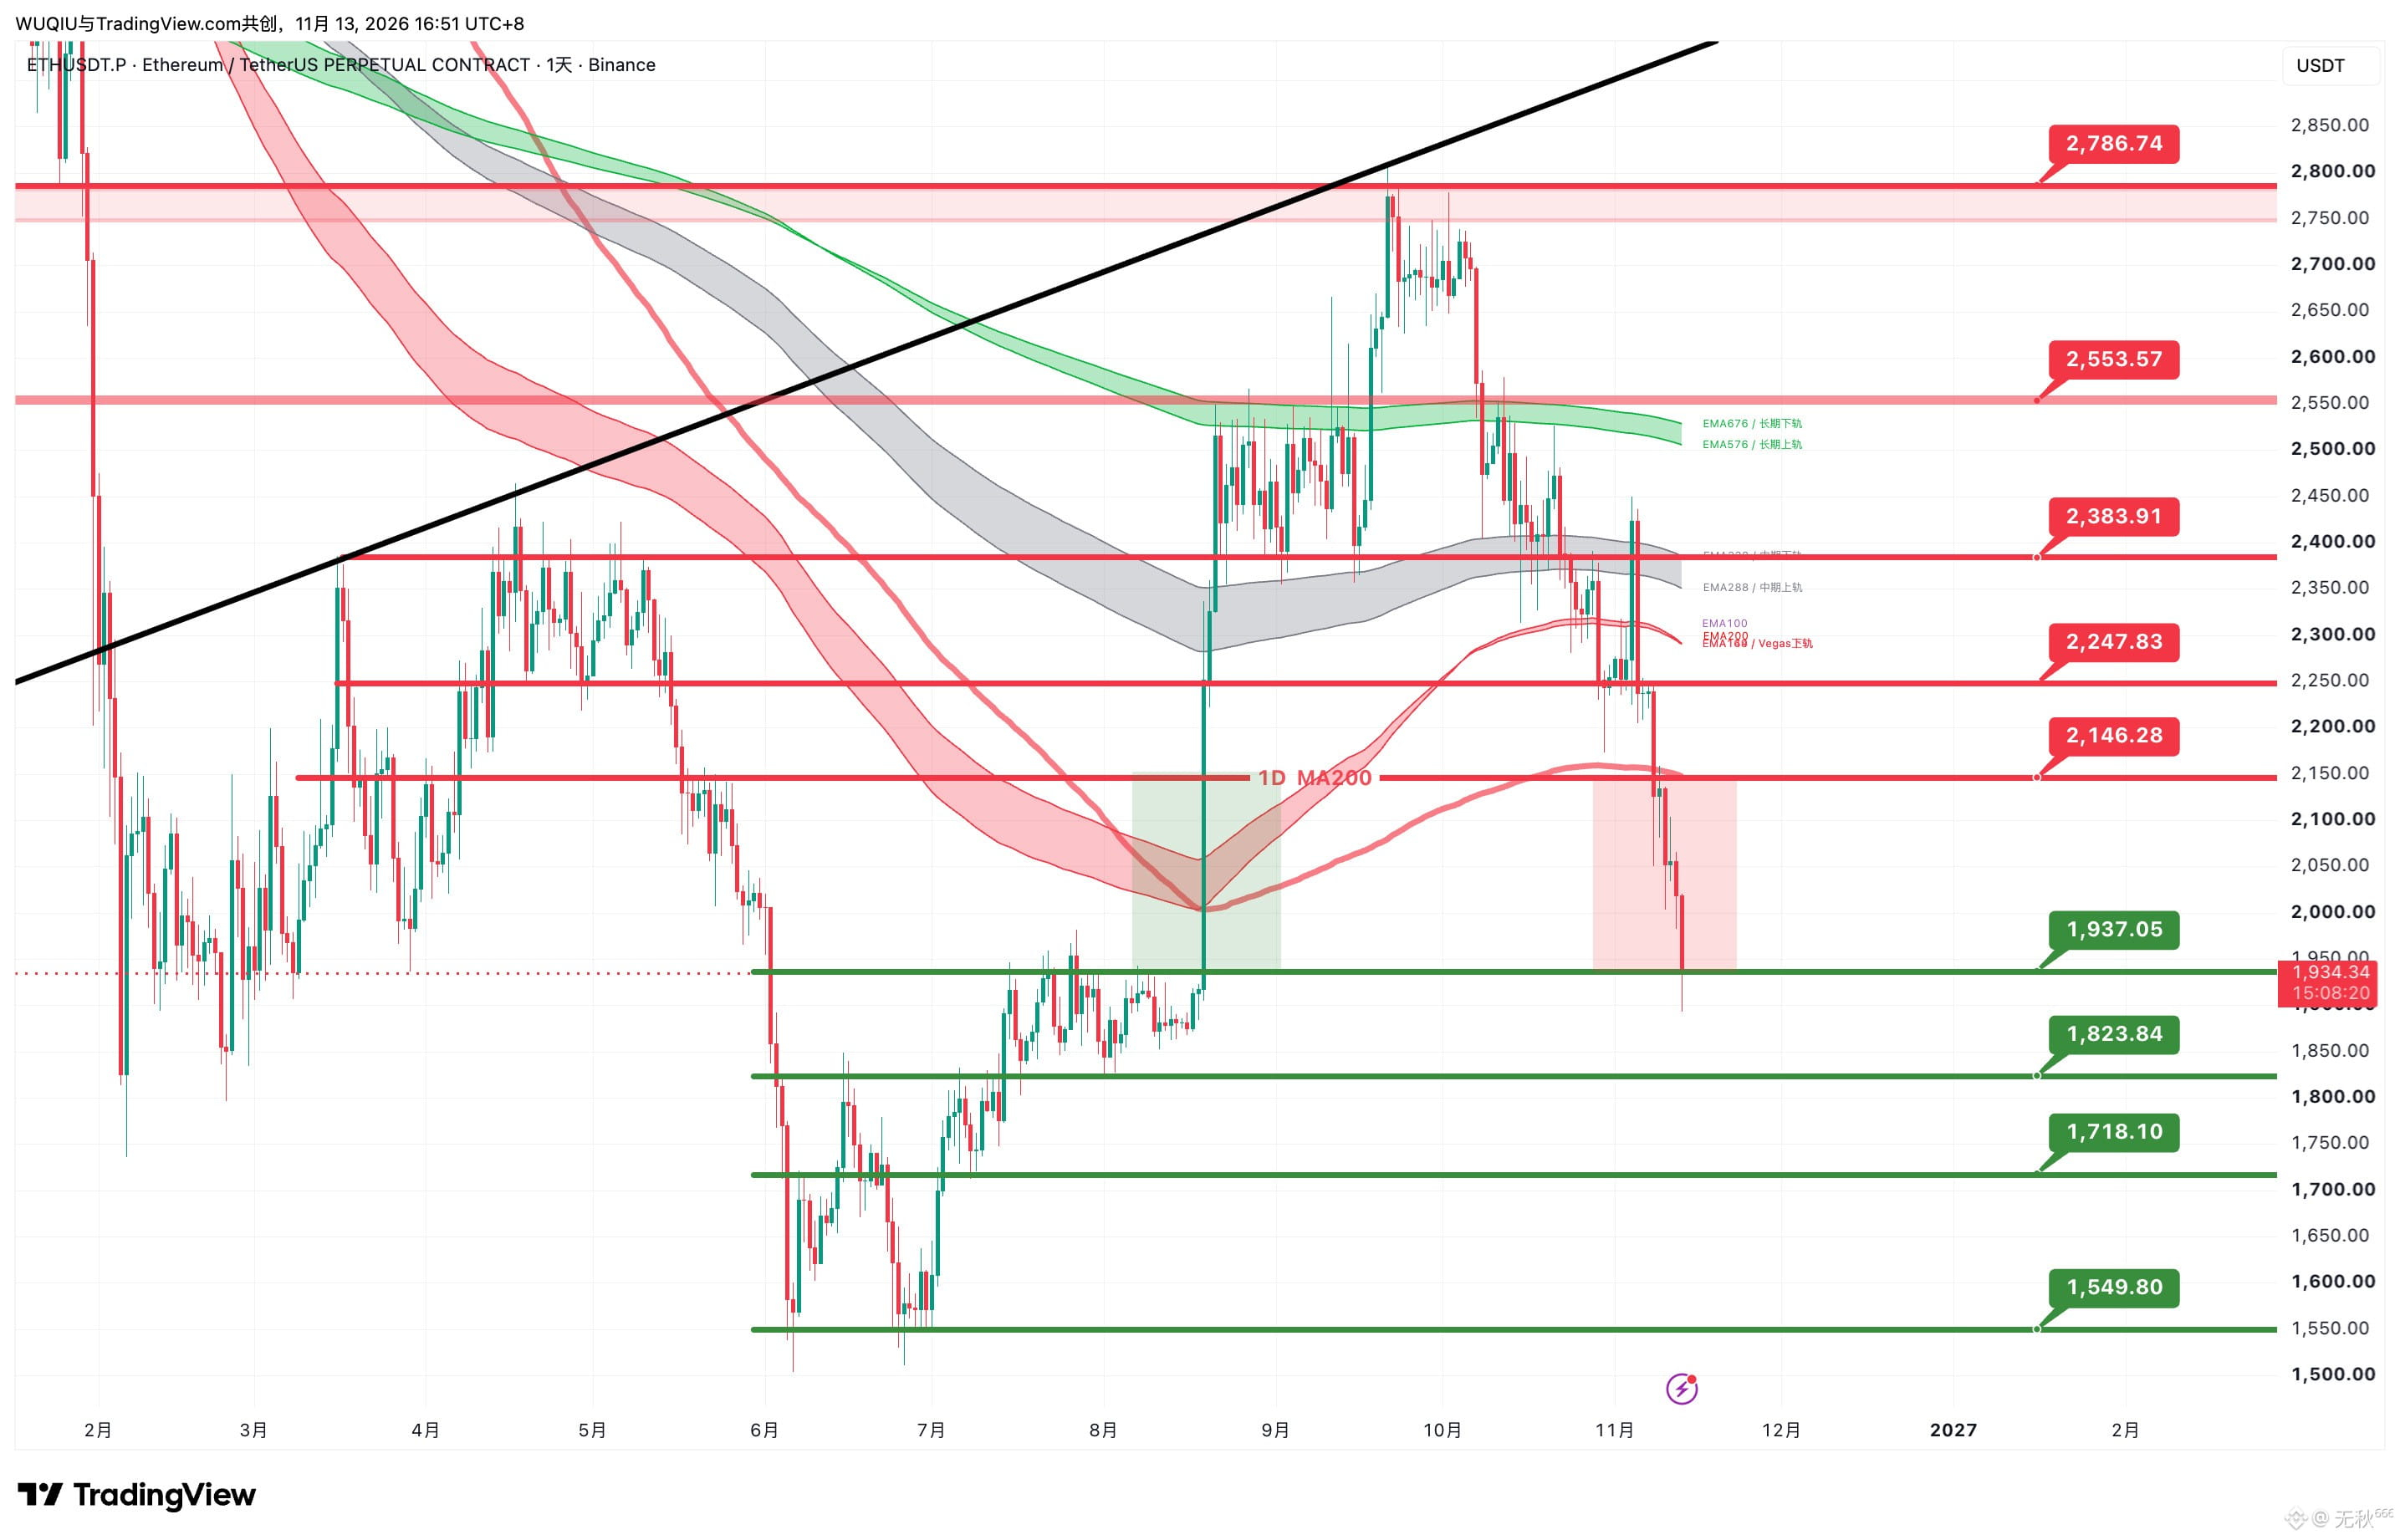
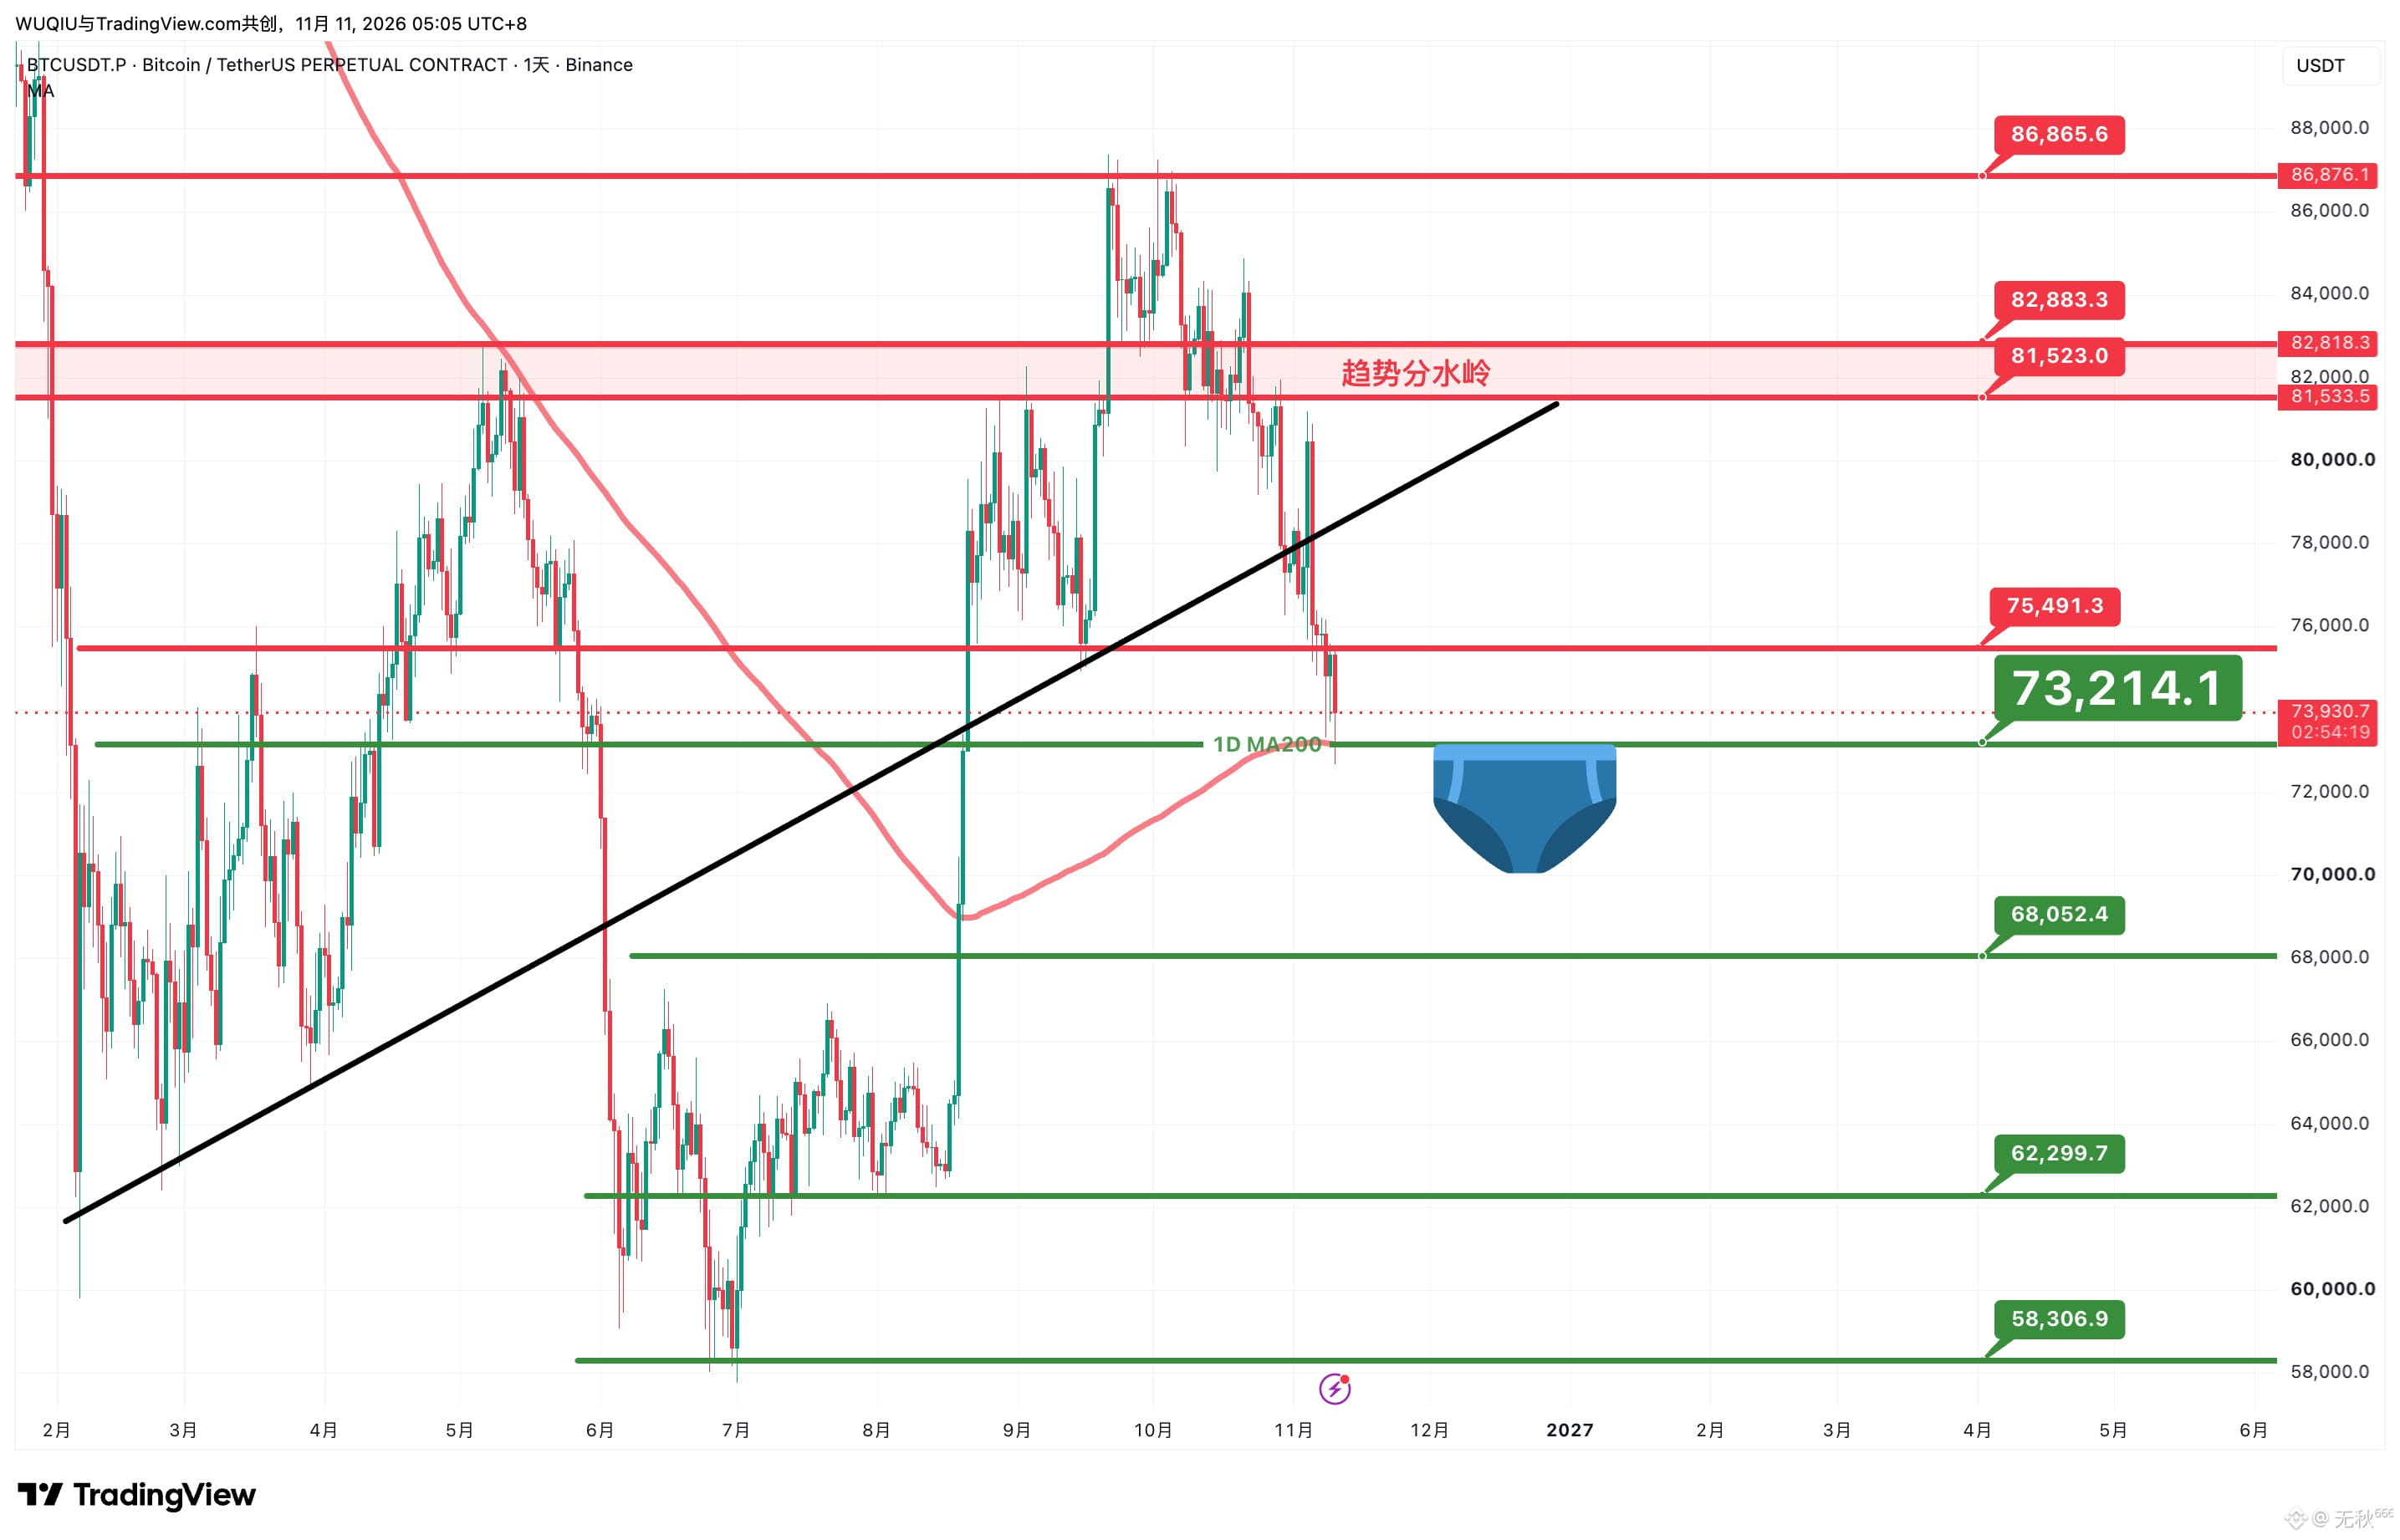
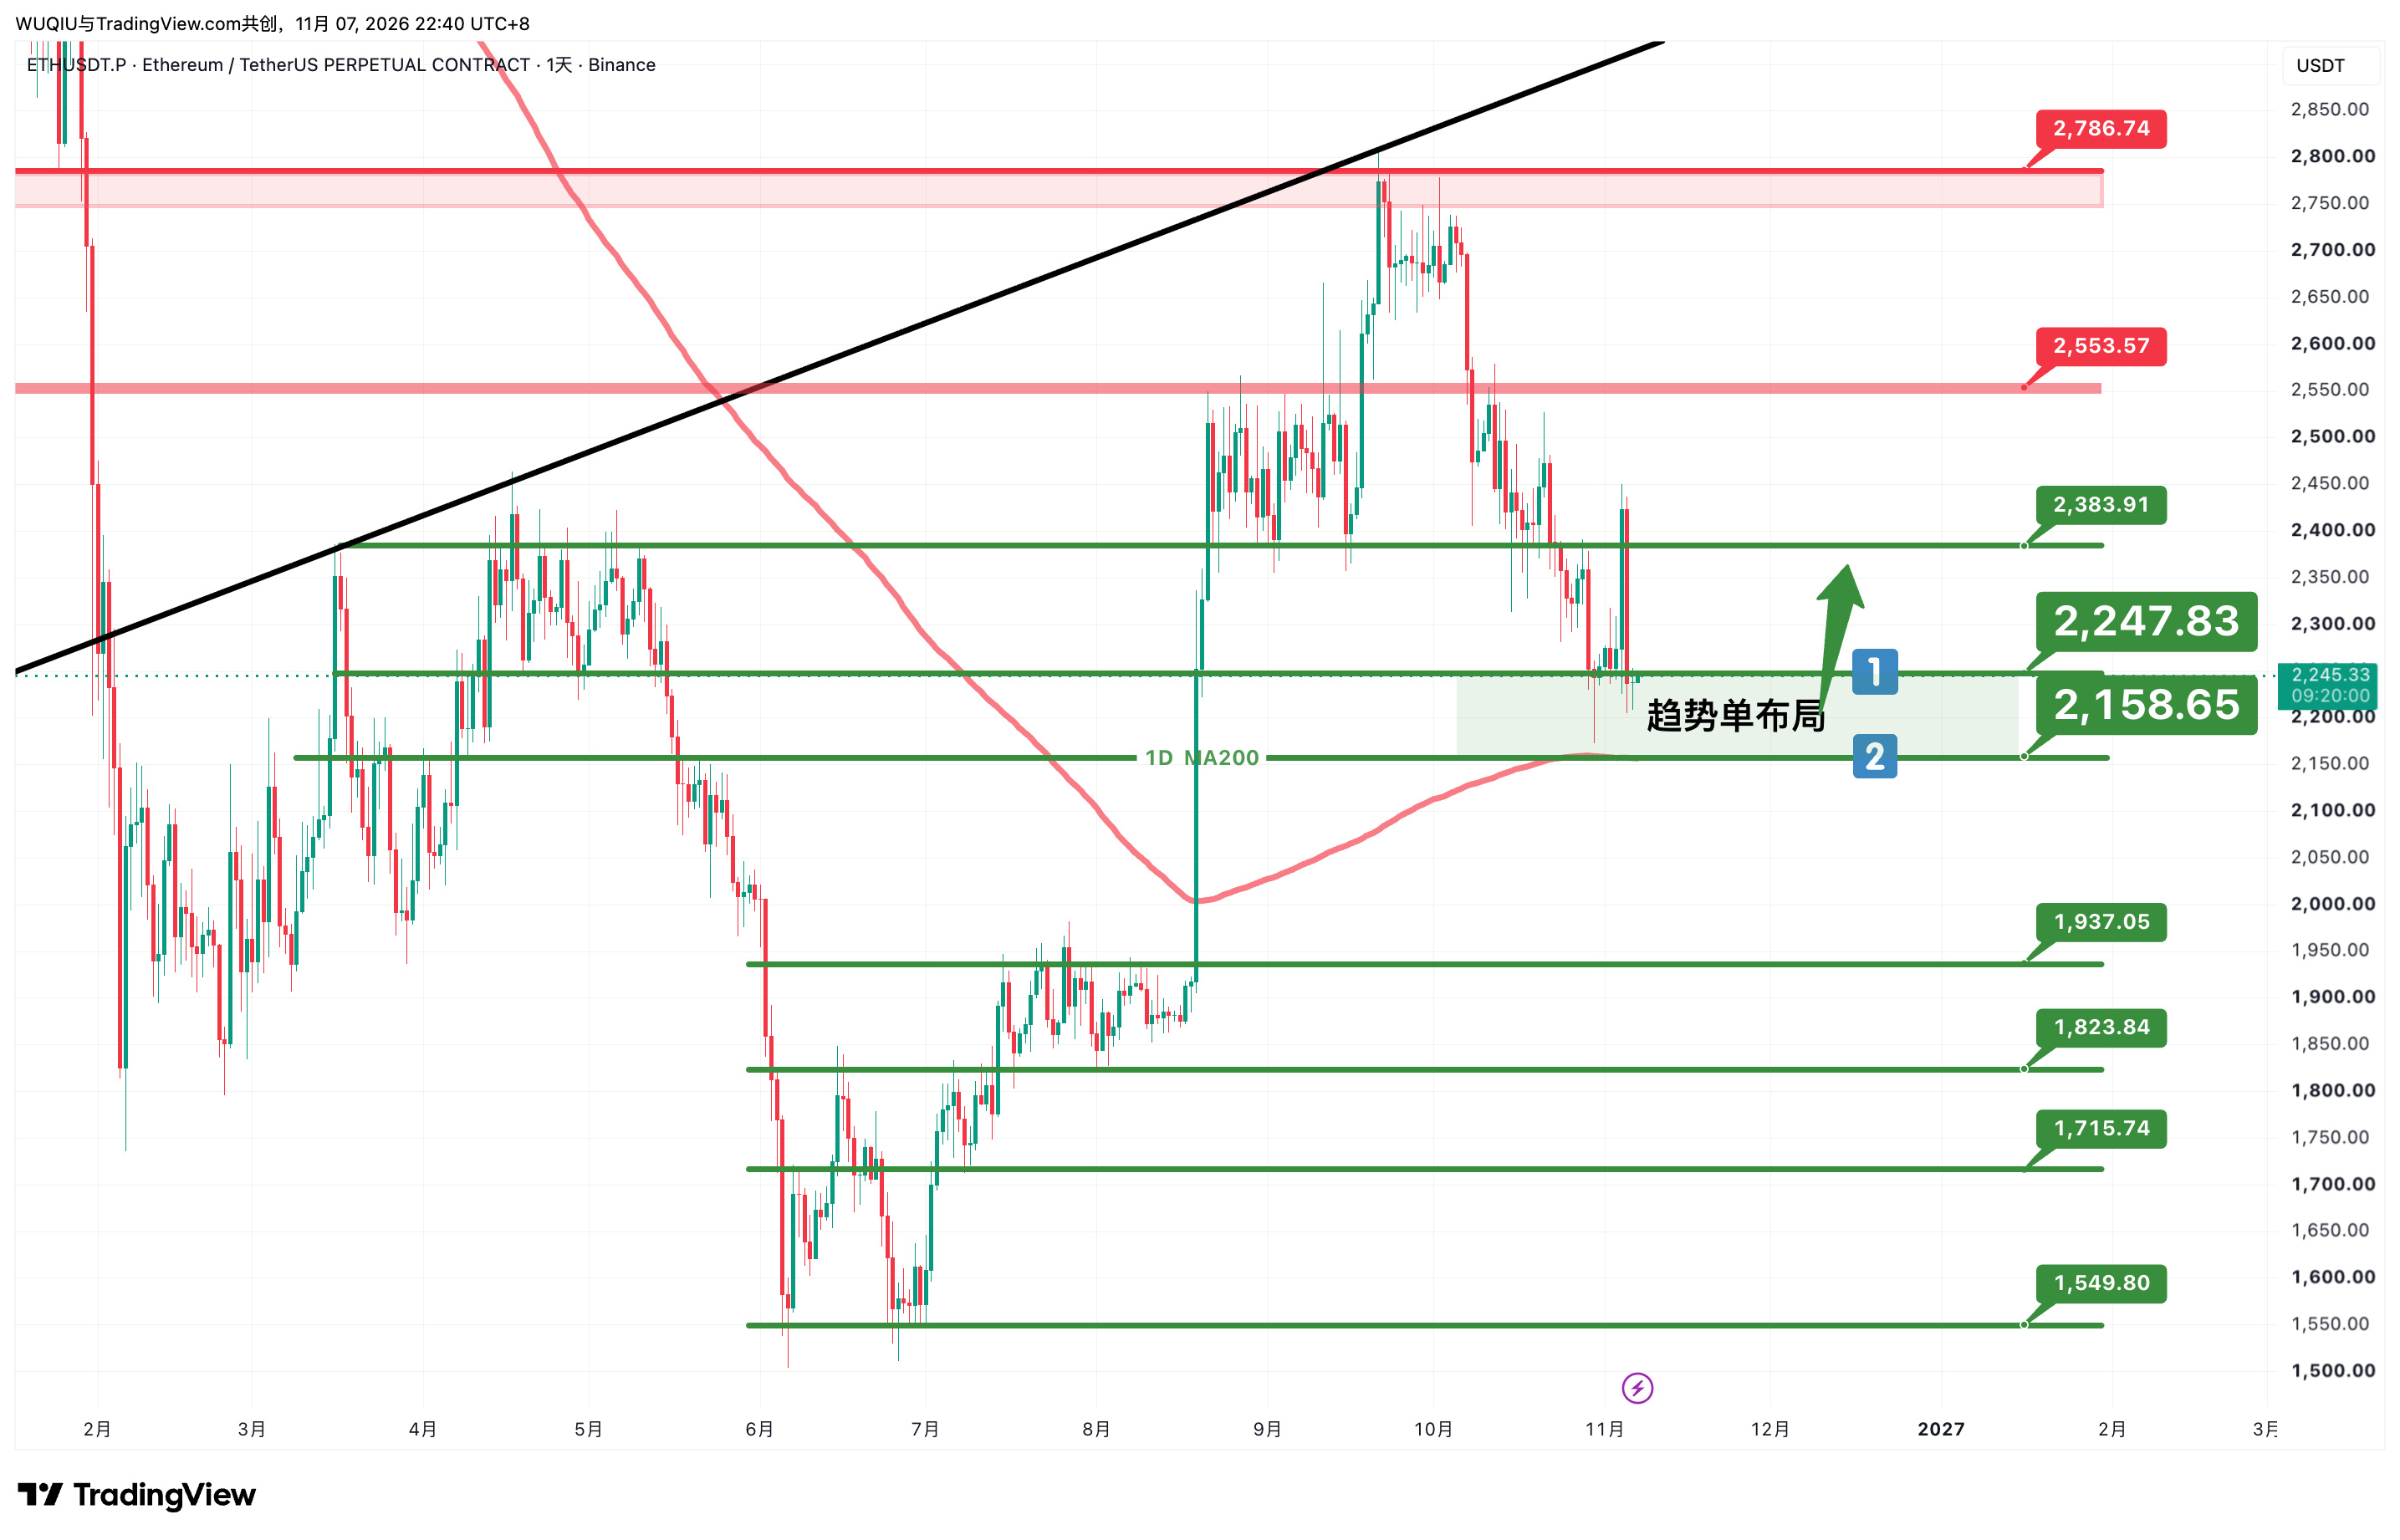
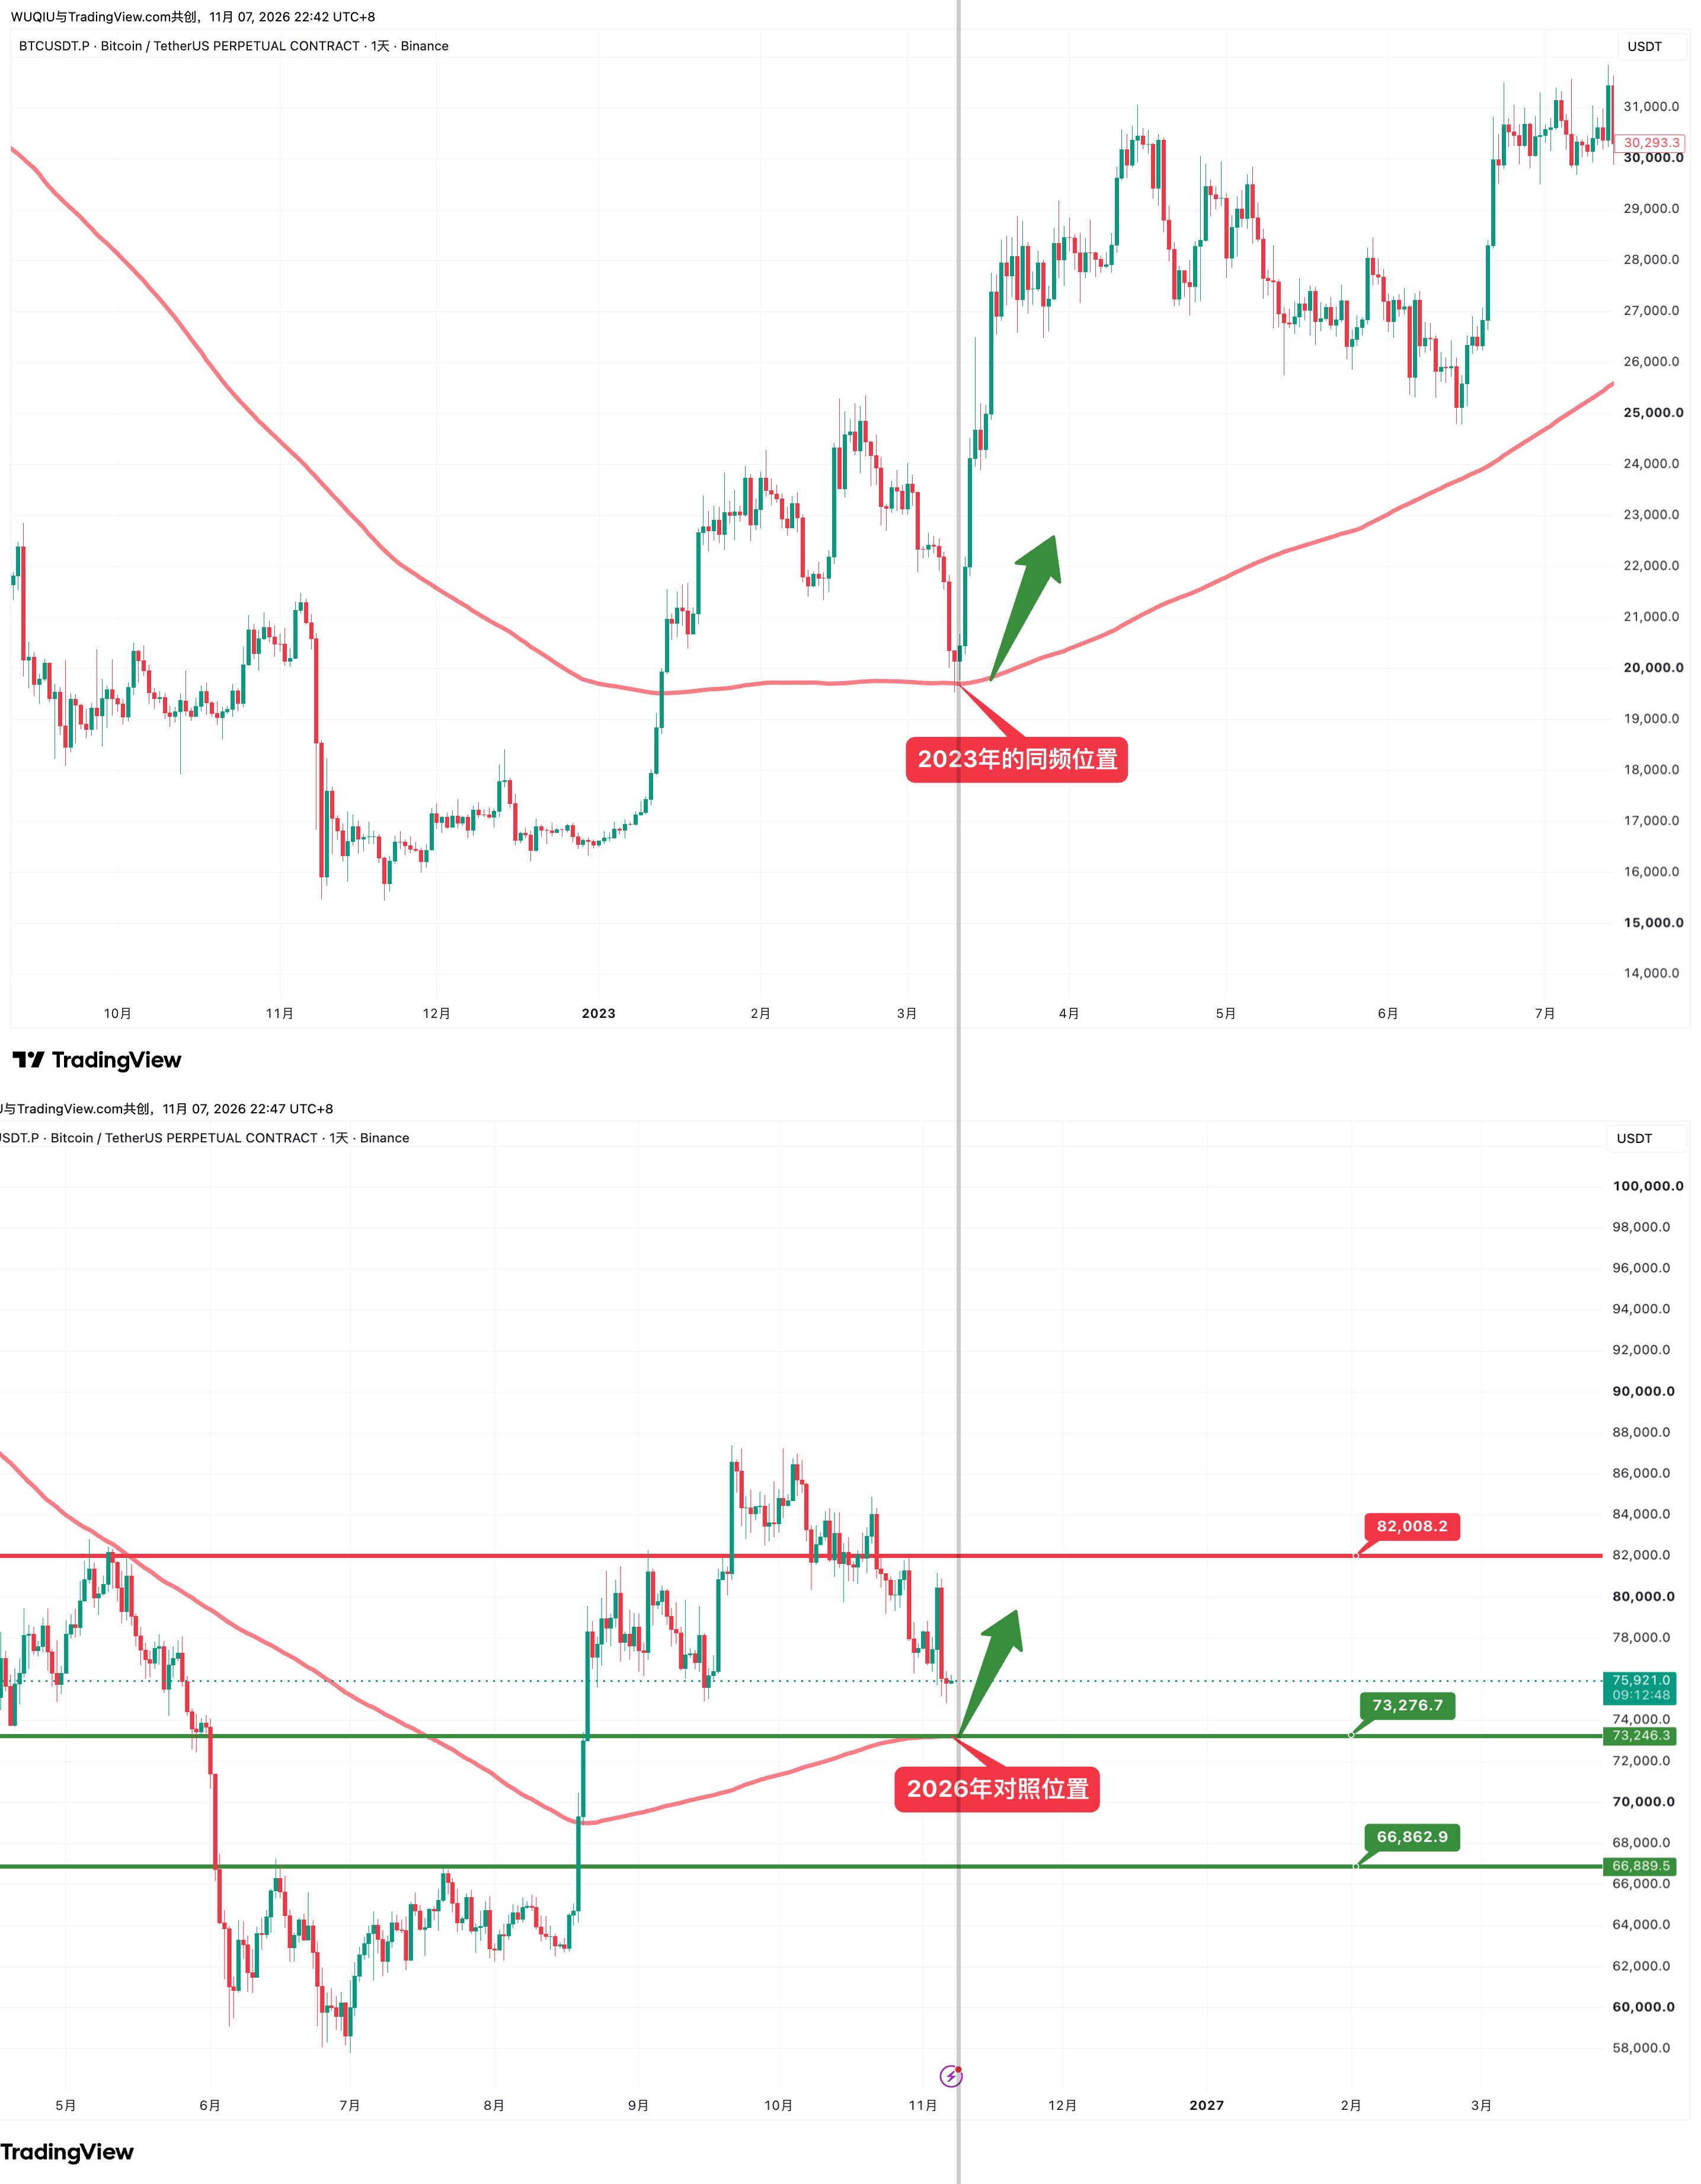
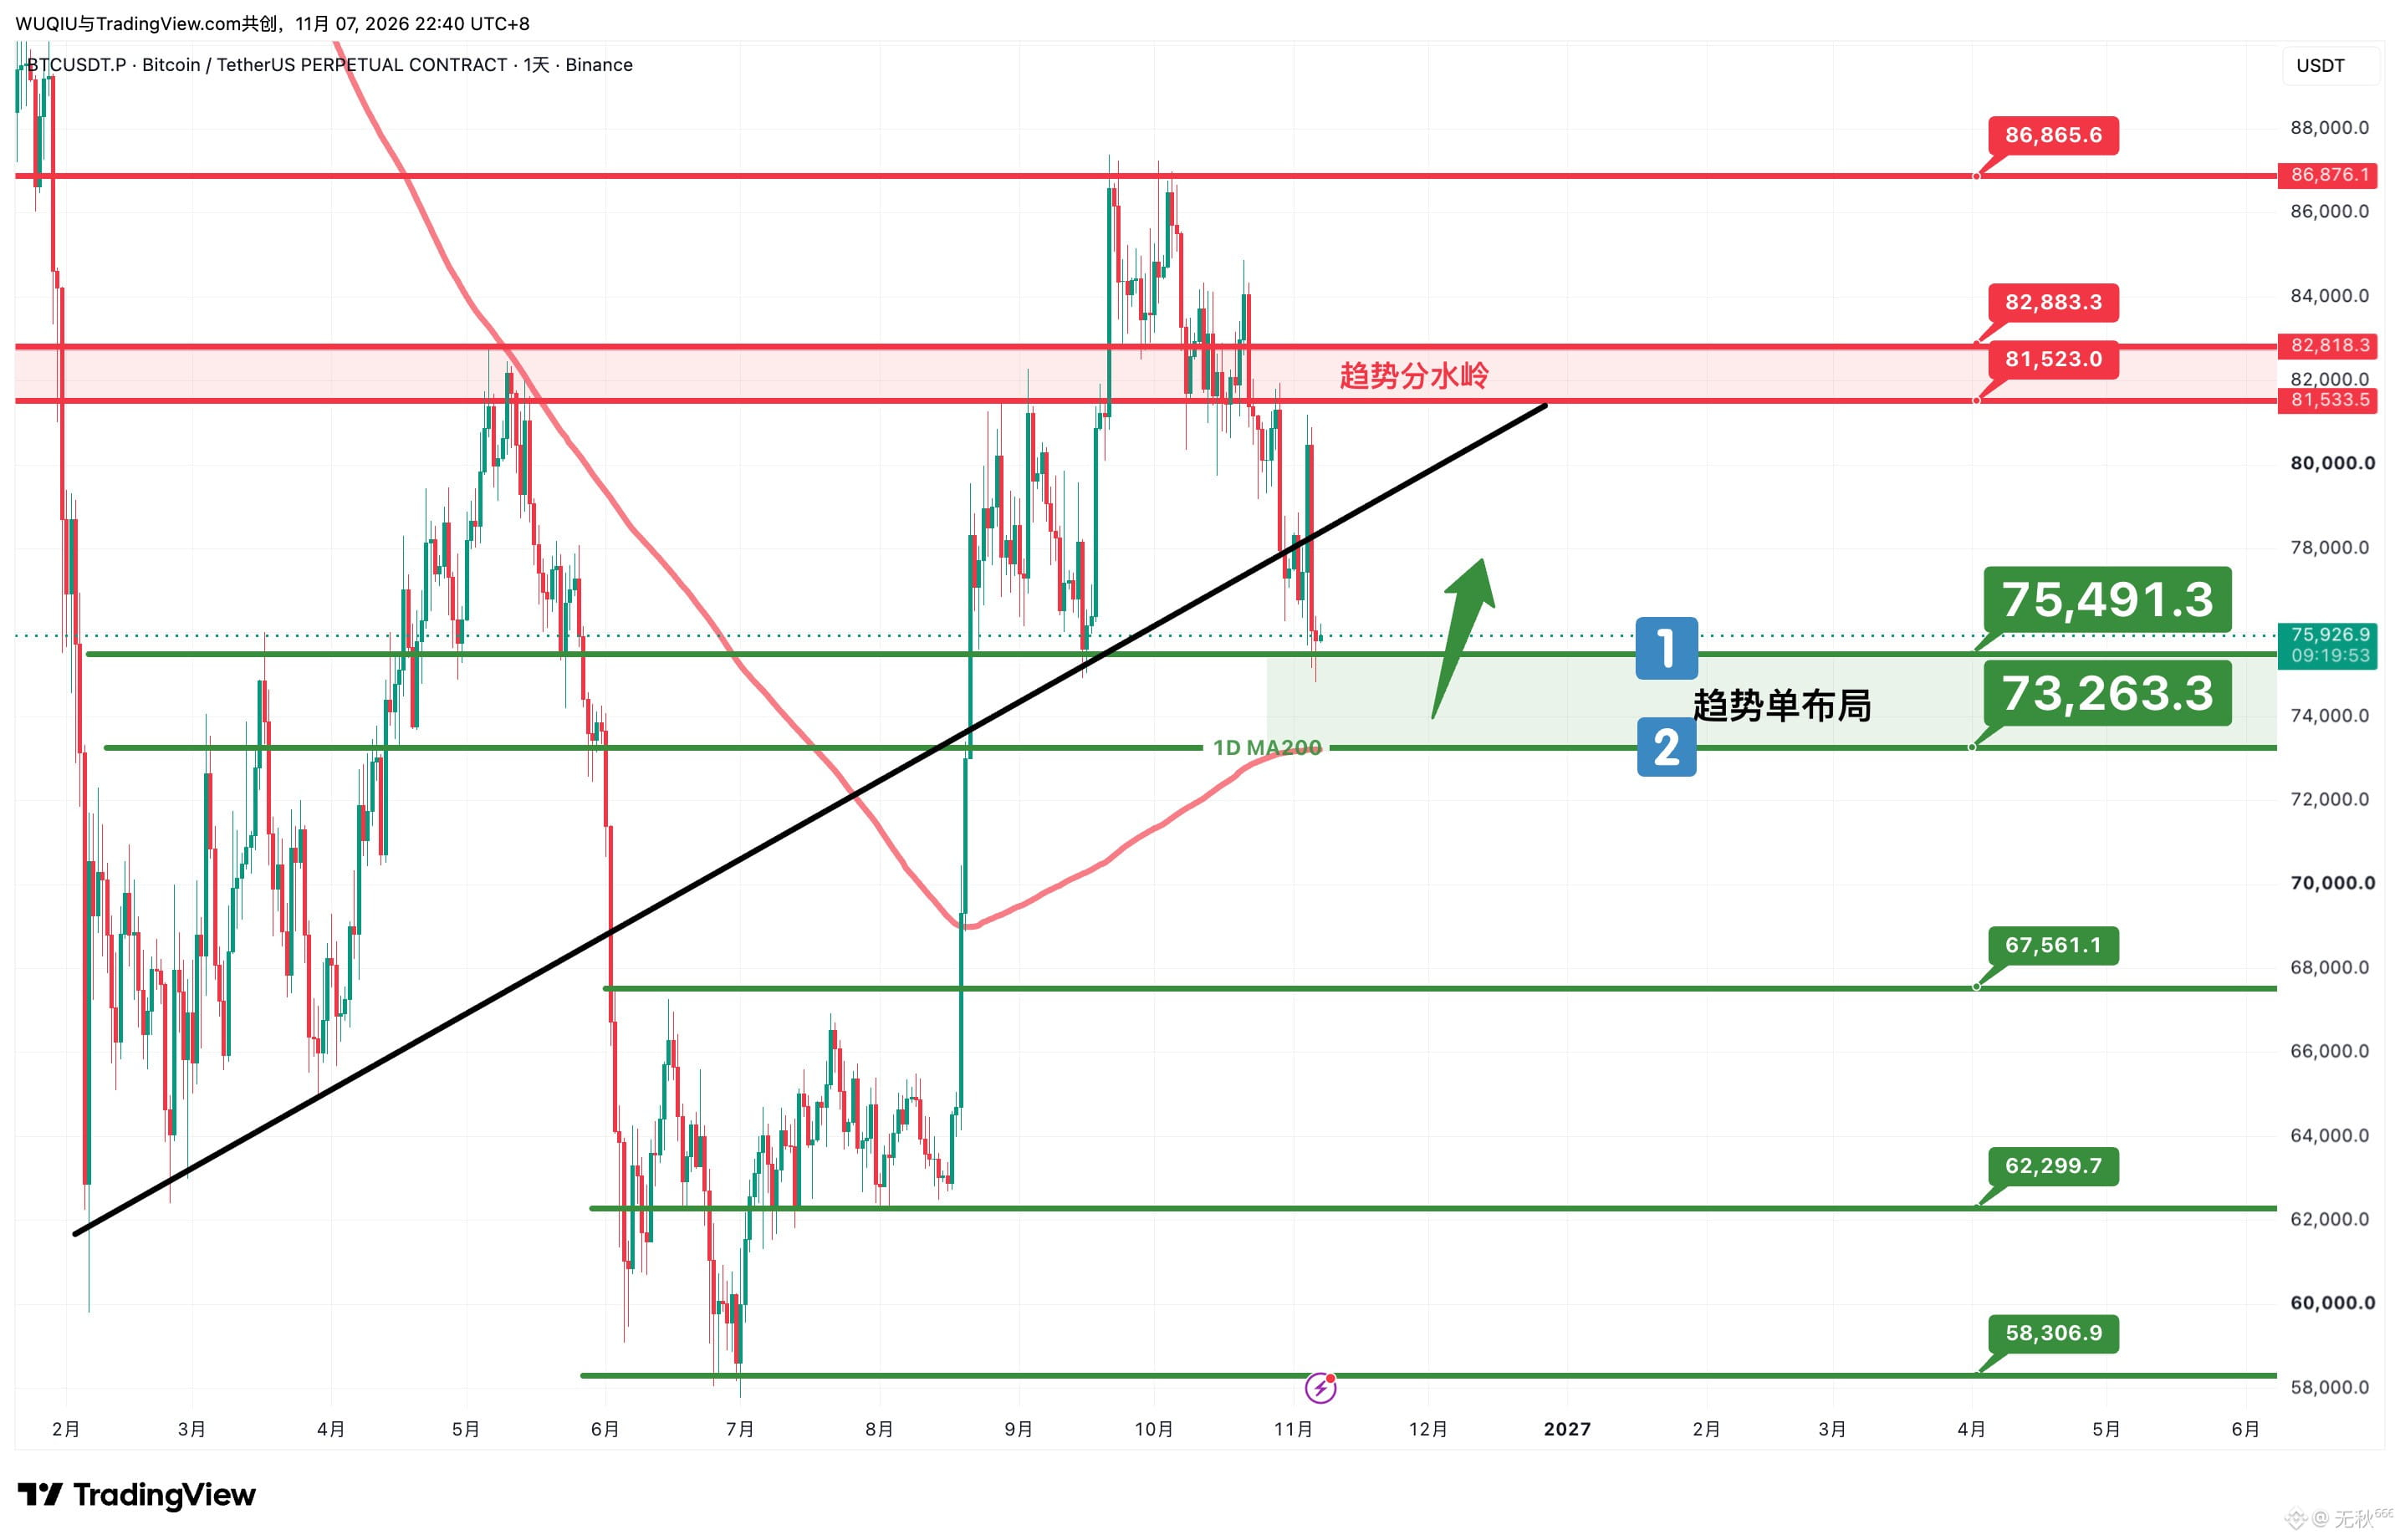
Answer: If you’re using a stop-loss and a long trade based on BTC’s daily MA200 (around 73200–73280) gets stopped out, the next major time-frame level to consider trading around is the weekly MA200, at approximately 67759–68060. The corresponding ETH price would be around 1923–1935. This would be an extremely bearish scenario. Just keep those levels in mind; there’s no need to worry too much, especially if you’re holding spot.
If you choose to trade BTC or ETH perpetuals this time around, be sure to place your stop-loss below level 2 for BTC or ETH! (For example, you could set a stop around 72500 for BTC and 2080 for ETH. Adjust the stop distance according to your position size.) For spot, it’s up to you—you don’t necessarily need a stop-loss.
As long as BTC hasn’t broken below its daily MA200, don’t overthink things for now. If it really does break below, take your stop and wait at the next major time-frame level for another trade. The worst-case loss is just one stop-out, and it’s a stop worth taking.
Of course, if you’re a right-side trader, as I mentioned earlier, you can wait for a downside wick to dip below BTC’s daily MA200 and then recover. Go long only after a bullish 1H candle closes and completely engulfs the previous bearish candle. You’ll give up some potential profit, but gain more confirmation.
All of the above assumes the scenario where we get a downward spike next week followed by a quick rebound. If there’s no spike down to BTC’s daily MA200 support, many of those who already entered a starter position at level 1 (around 75490) won’t get a chance to add at level 2. In that case, just hold the position from level 1 and trade the swing (aiming to take profit at 77800–78300). Whatever you do, don’t add to a position that’s already in profit or immediately add the rest of your intended position.
#美国拟收紧数据中心监管,AI扩张或面临新约束 #BTC走势分析
Answer: If you’re using a stop-loss and a long trade based on BTC’s daily MA200 (around 73200–73280) gets stopped out, the next major time-frame level to consider trading around is the weekly MA200, at approximately 67759–68060. The corresponding ETH price would be around 1923–1935. This would be an extremely bearish scenario. Just keep those levels in mind; there’s no need to worry too much, especially if you’re holding spot.
If you choose to trade BTC or ETH perpetuals this time around, be sure to place your stop-loss below level 2 for BTC or ETH! (For example, you could set a stop around 72500 for BTC and 2080 for ETH. Adjust the stop distance according to your position size.) For spot, it’s up to you—you don’t necessarily need a stop-loss.
As long as BTC hasn’t broken below its daily MA200, don’t overthink things for now. If it really does break below, take your stop and wait at the next major time-frame level for another trade. The worst-case loss is just one stop-out, and it’s a stop worth taking.
Of course, if you’re a right-side trader, as I mentioned earlier, you can wait for a downside wick to dip below BTC’s daily MA200 and then recover. Go long only after a bullish 1H candle closes and completely engulfs the previous bearish candle. You’ll give up some potential profit, but gain more confirmation.
All of the above assumes the scenario where we get a downward spike next week followed by a quick rebound. If there’s no spike down to BTC’s daily MA200 support, many of those who already entered a starter position at level 1 (around 75490) won’t get a chance to add at level 2. In that case, just hold the position from level 1 and trade the swing (aiming to take profit at 77800–78300). Whatever you do, don’t add to a position that’s already in profit or immediately add the rest of your intended position.
#美国拟收紧数据中心监管,AI扩张或面临新约束 #BTC走势分析
无秋⁶⁶⁶
·
--
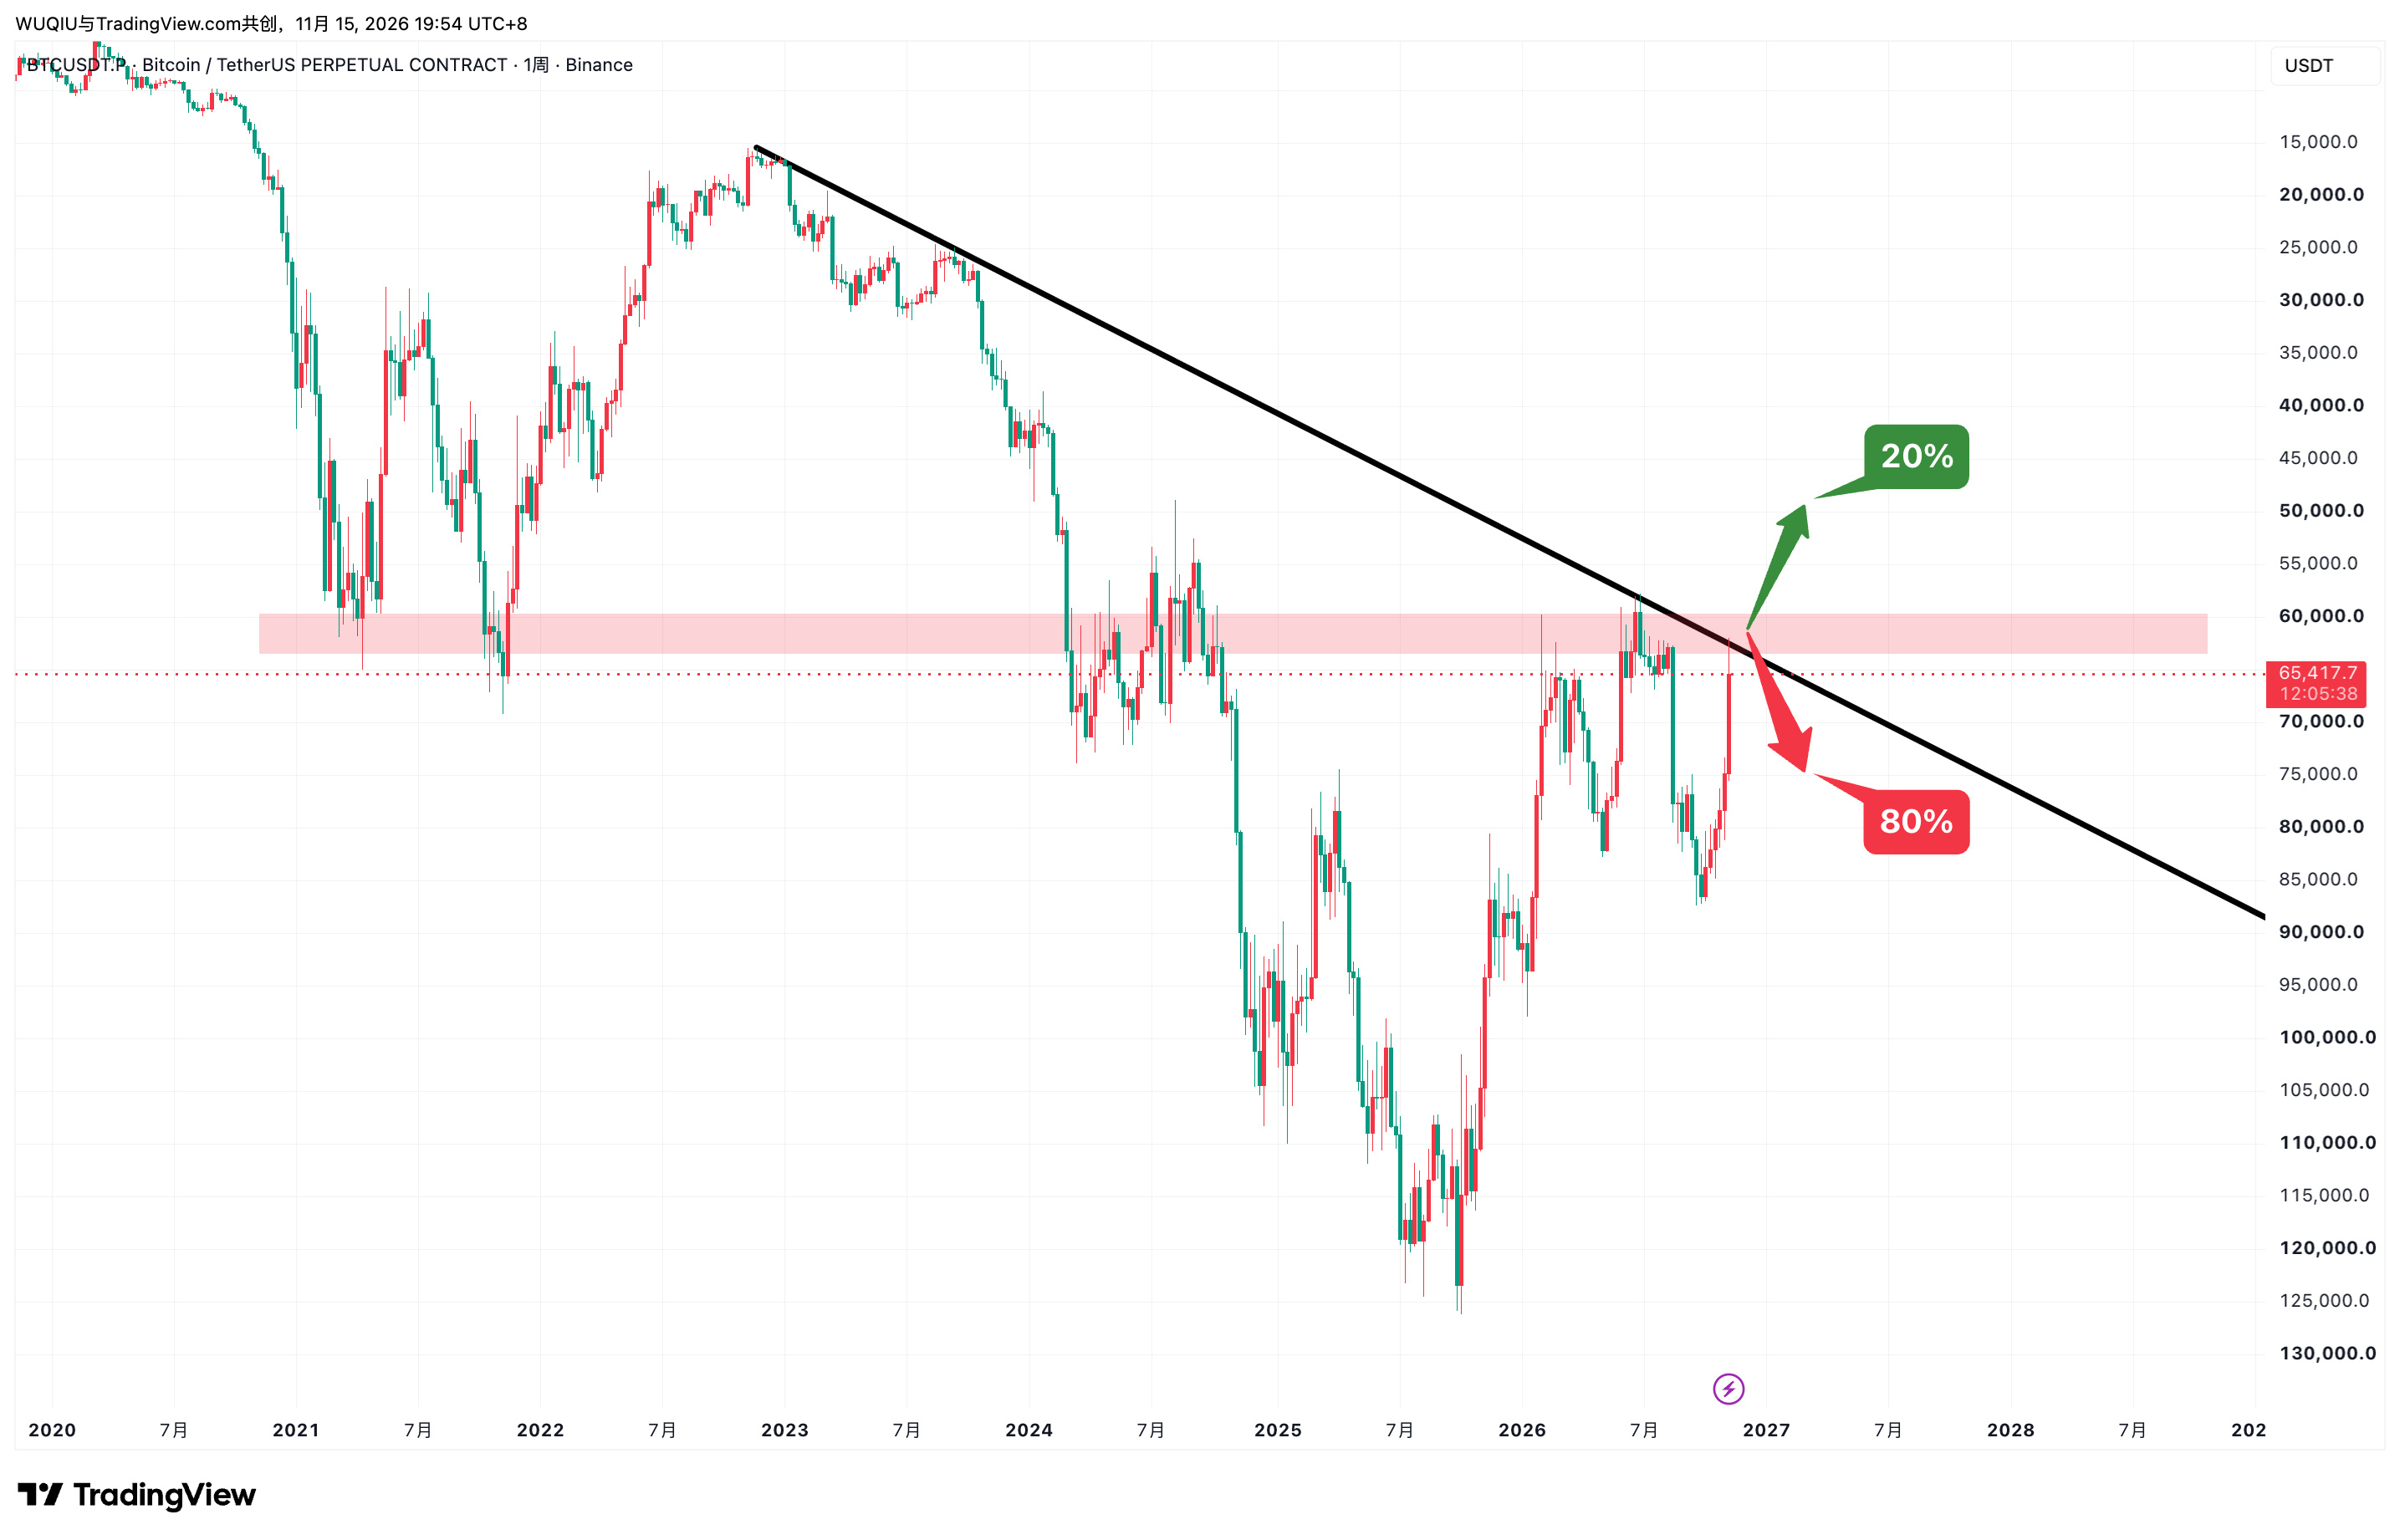
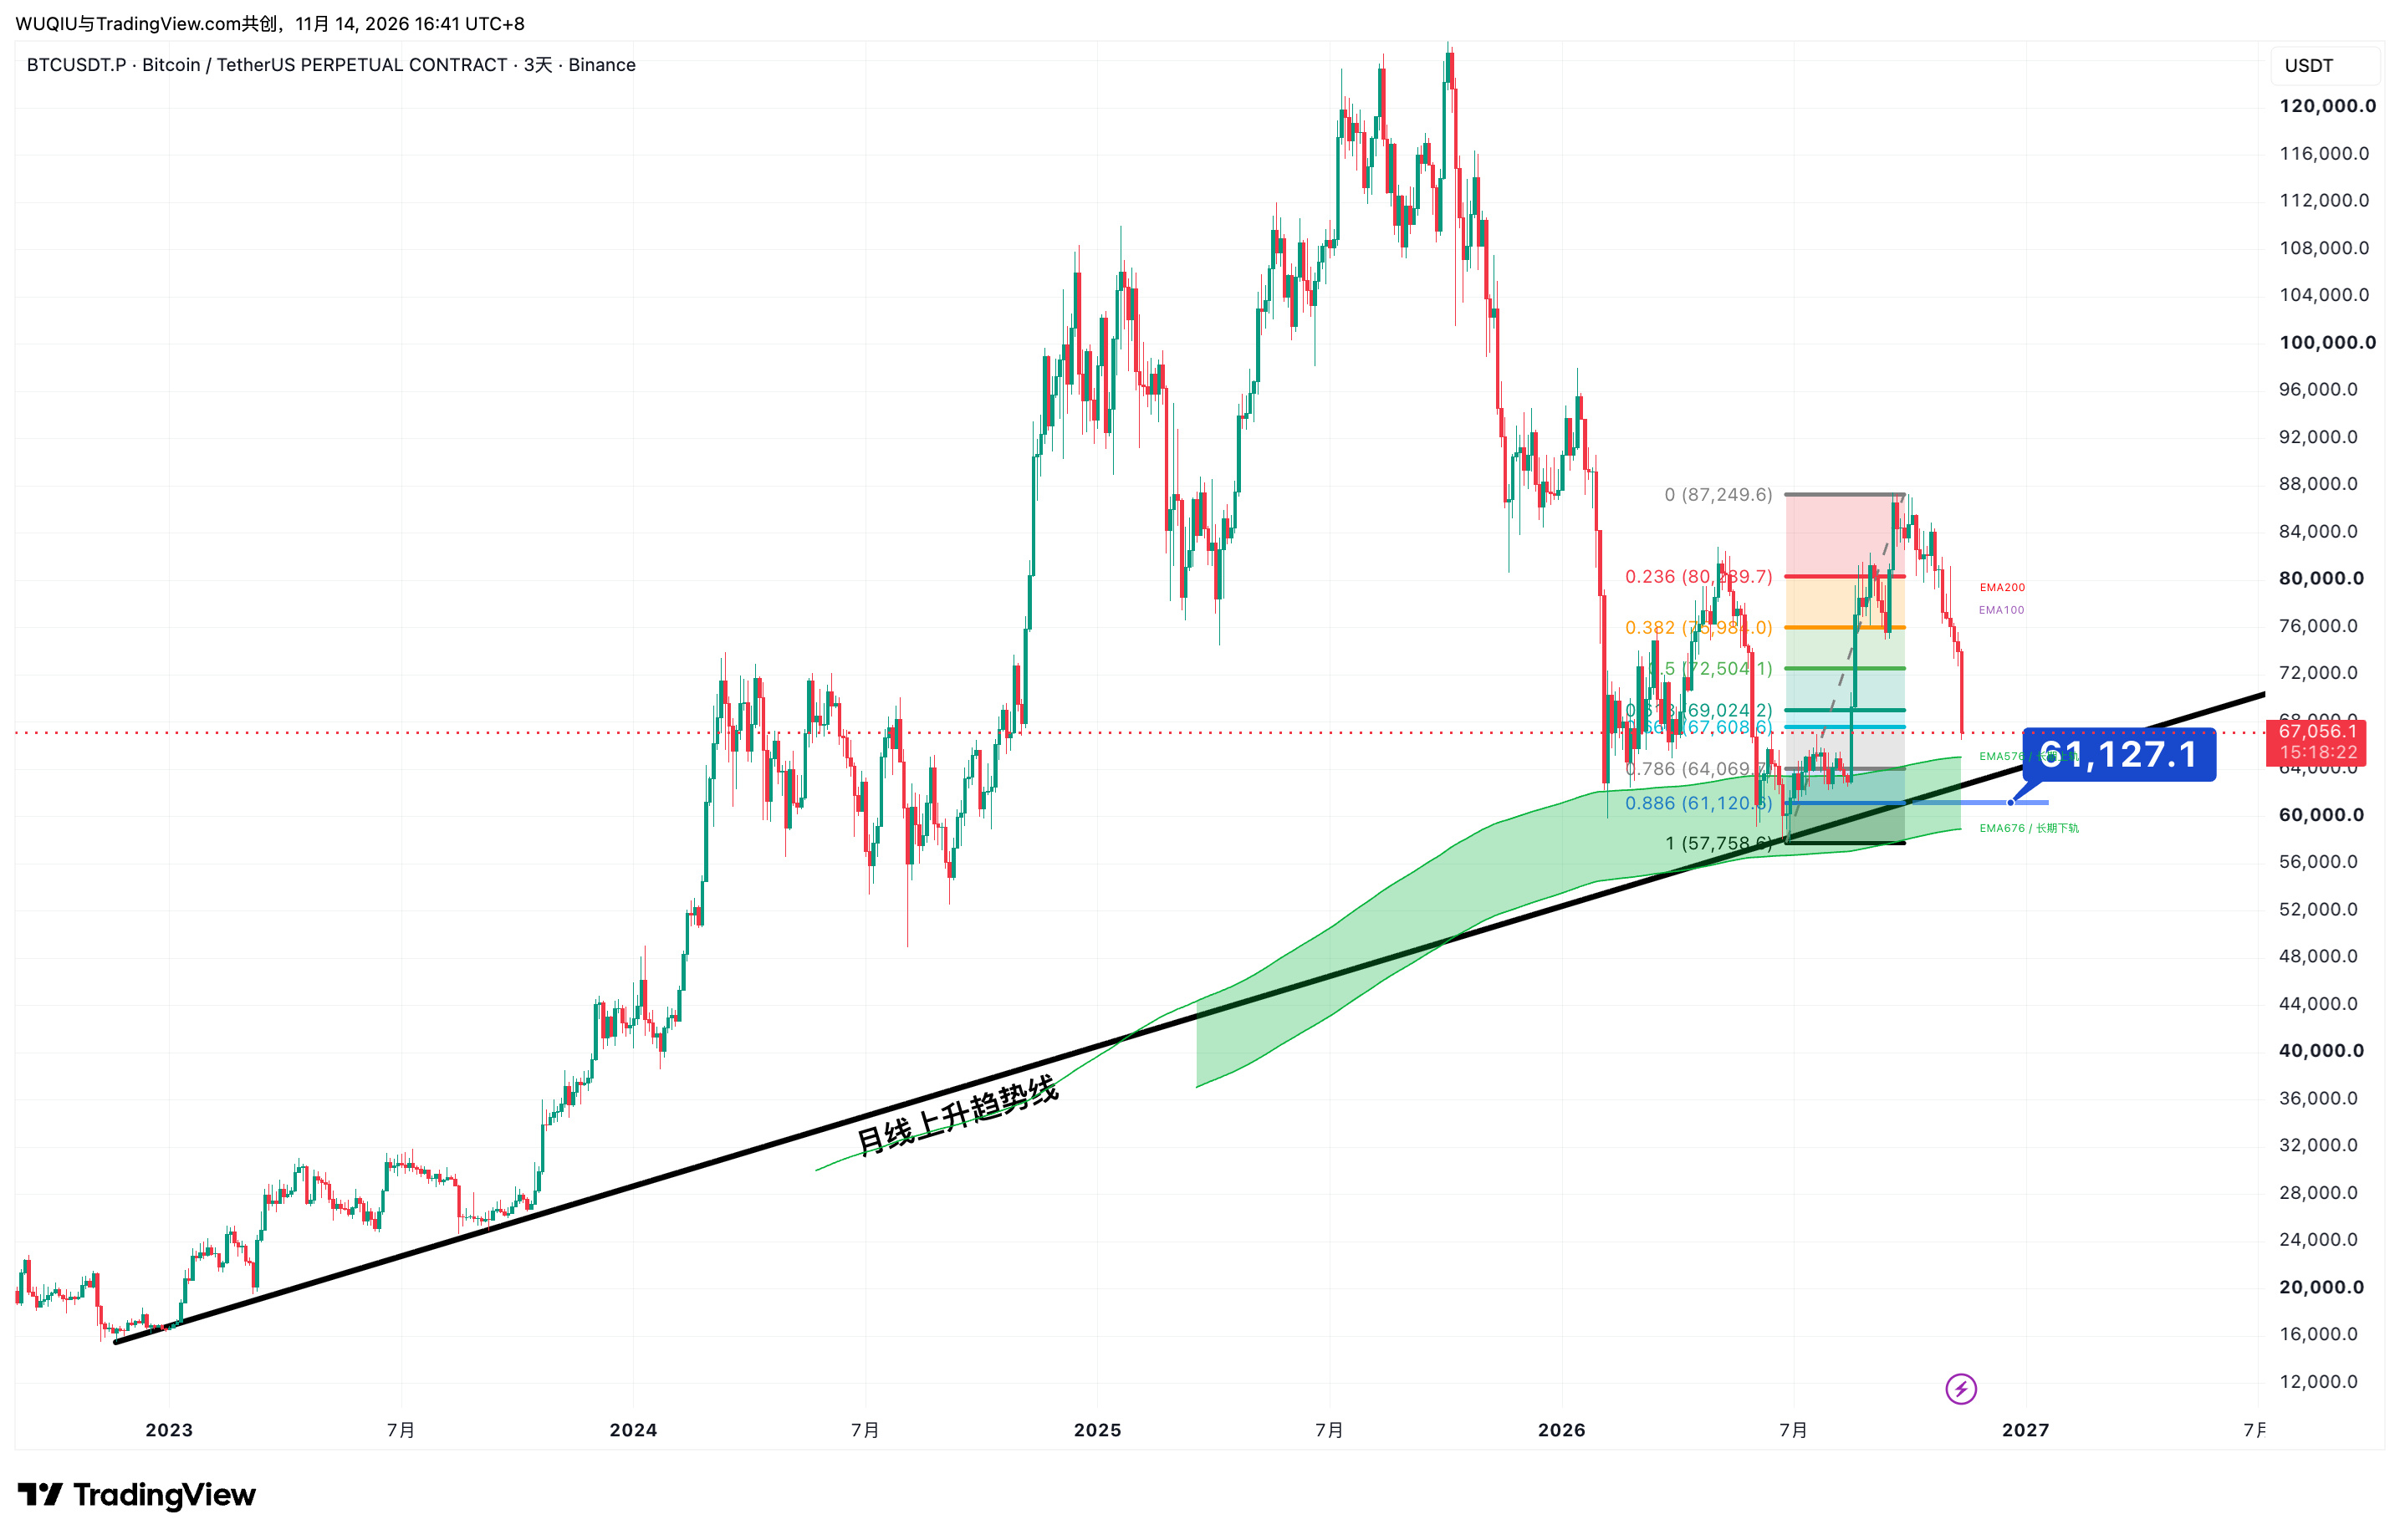
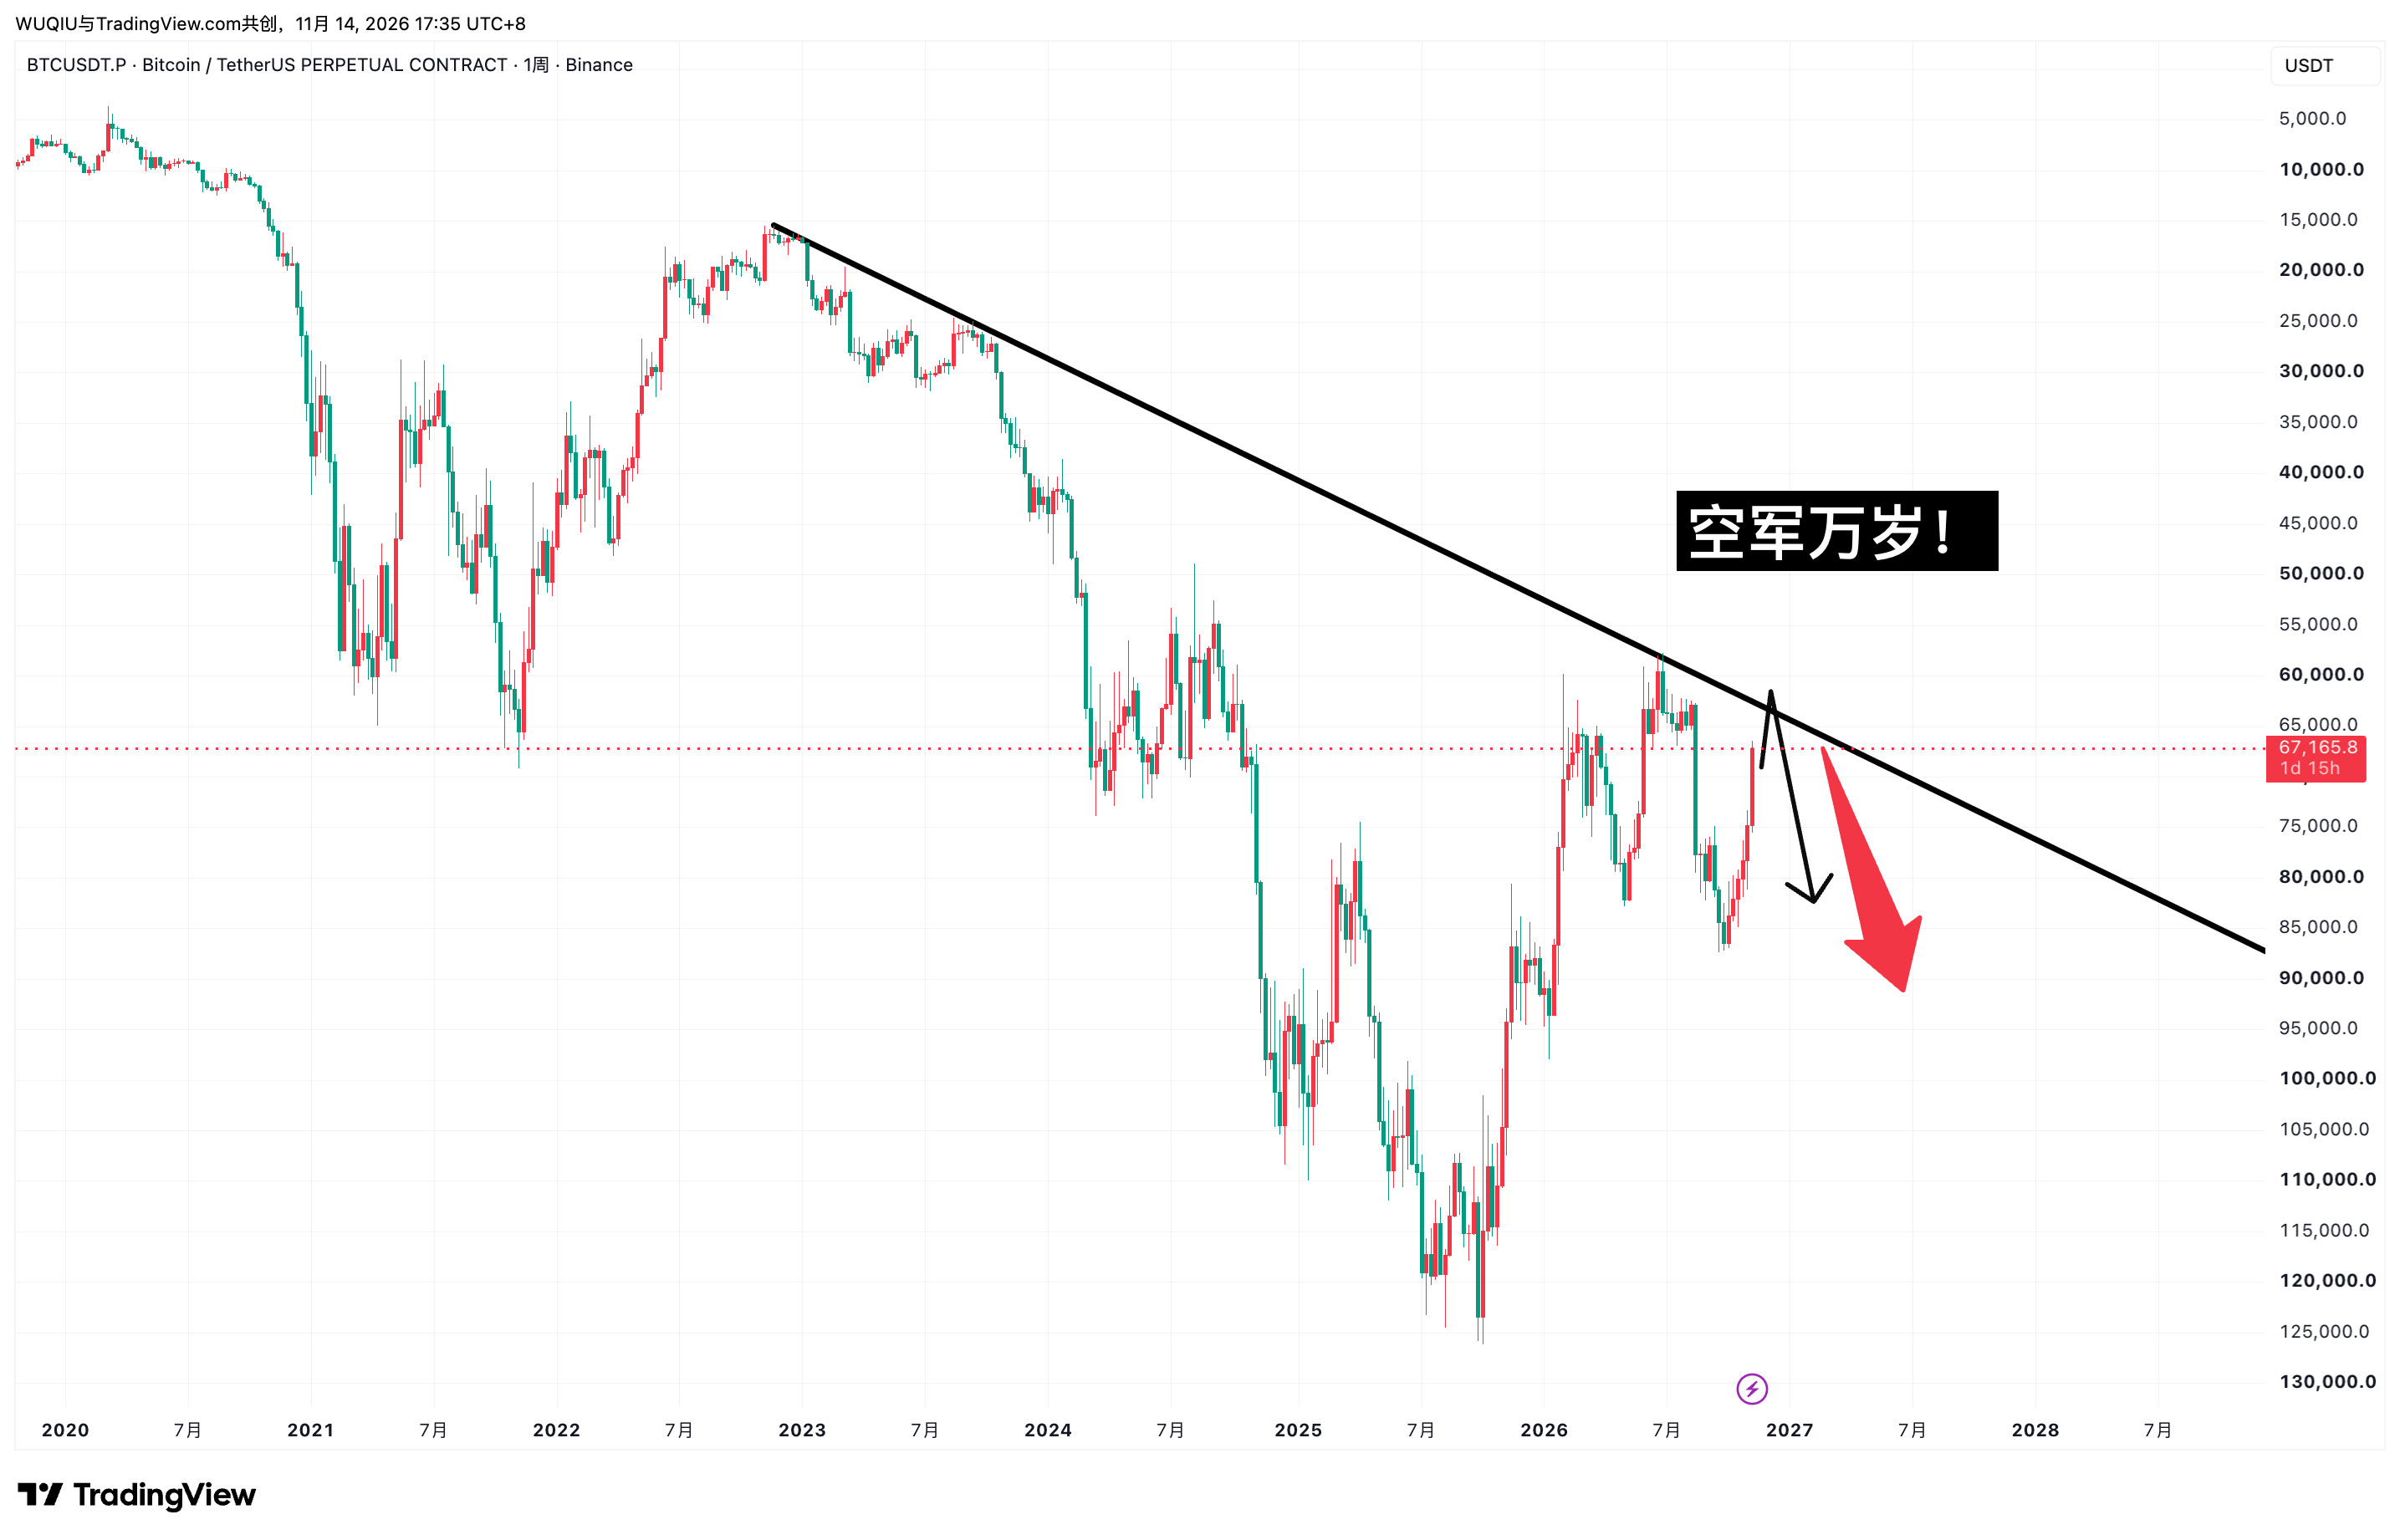
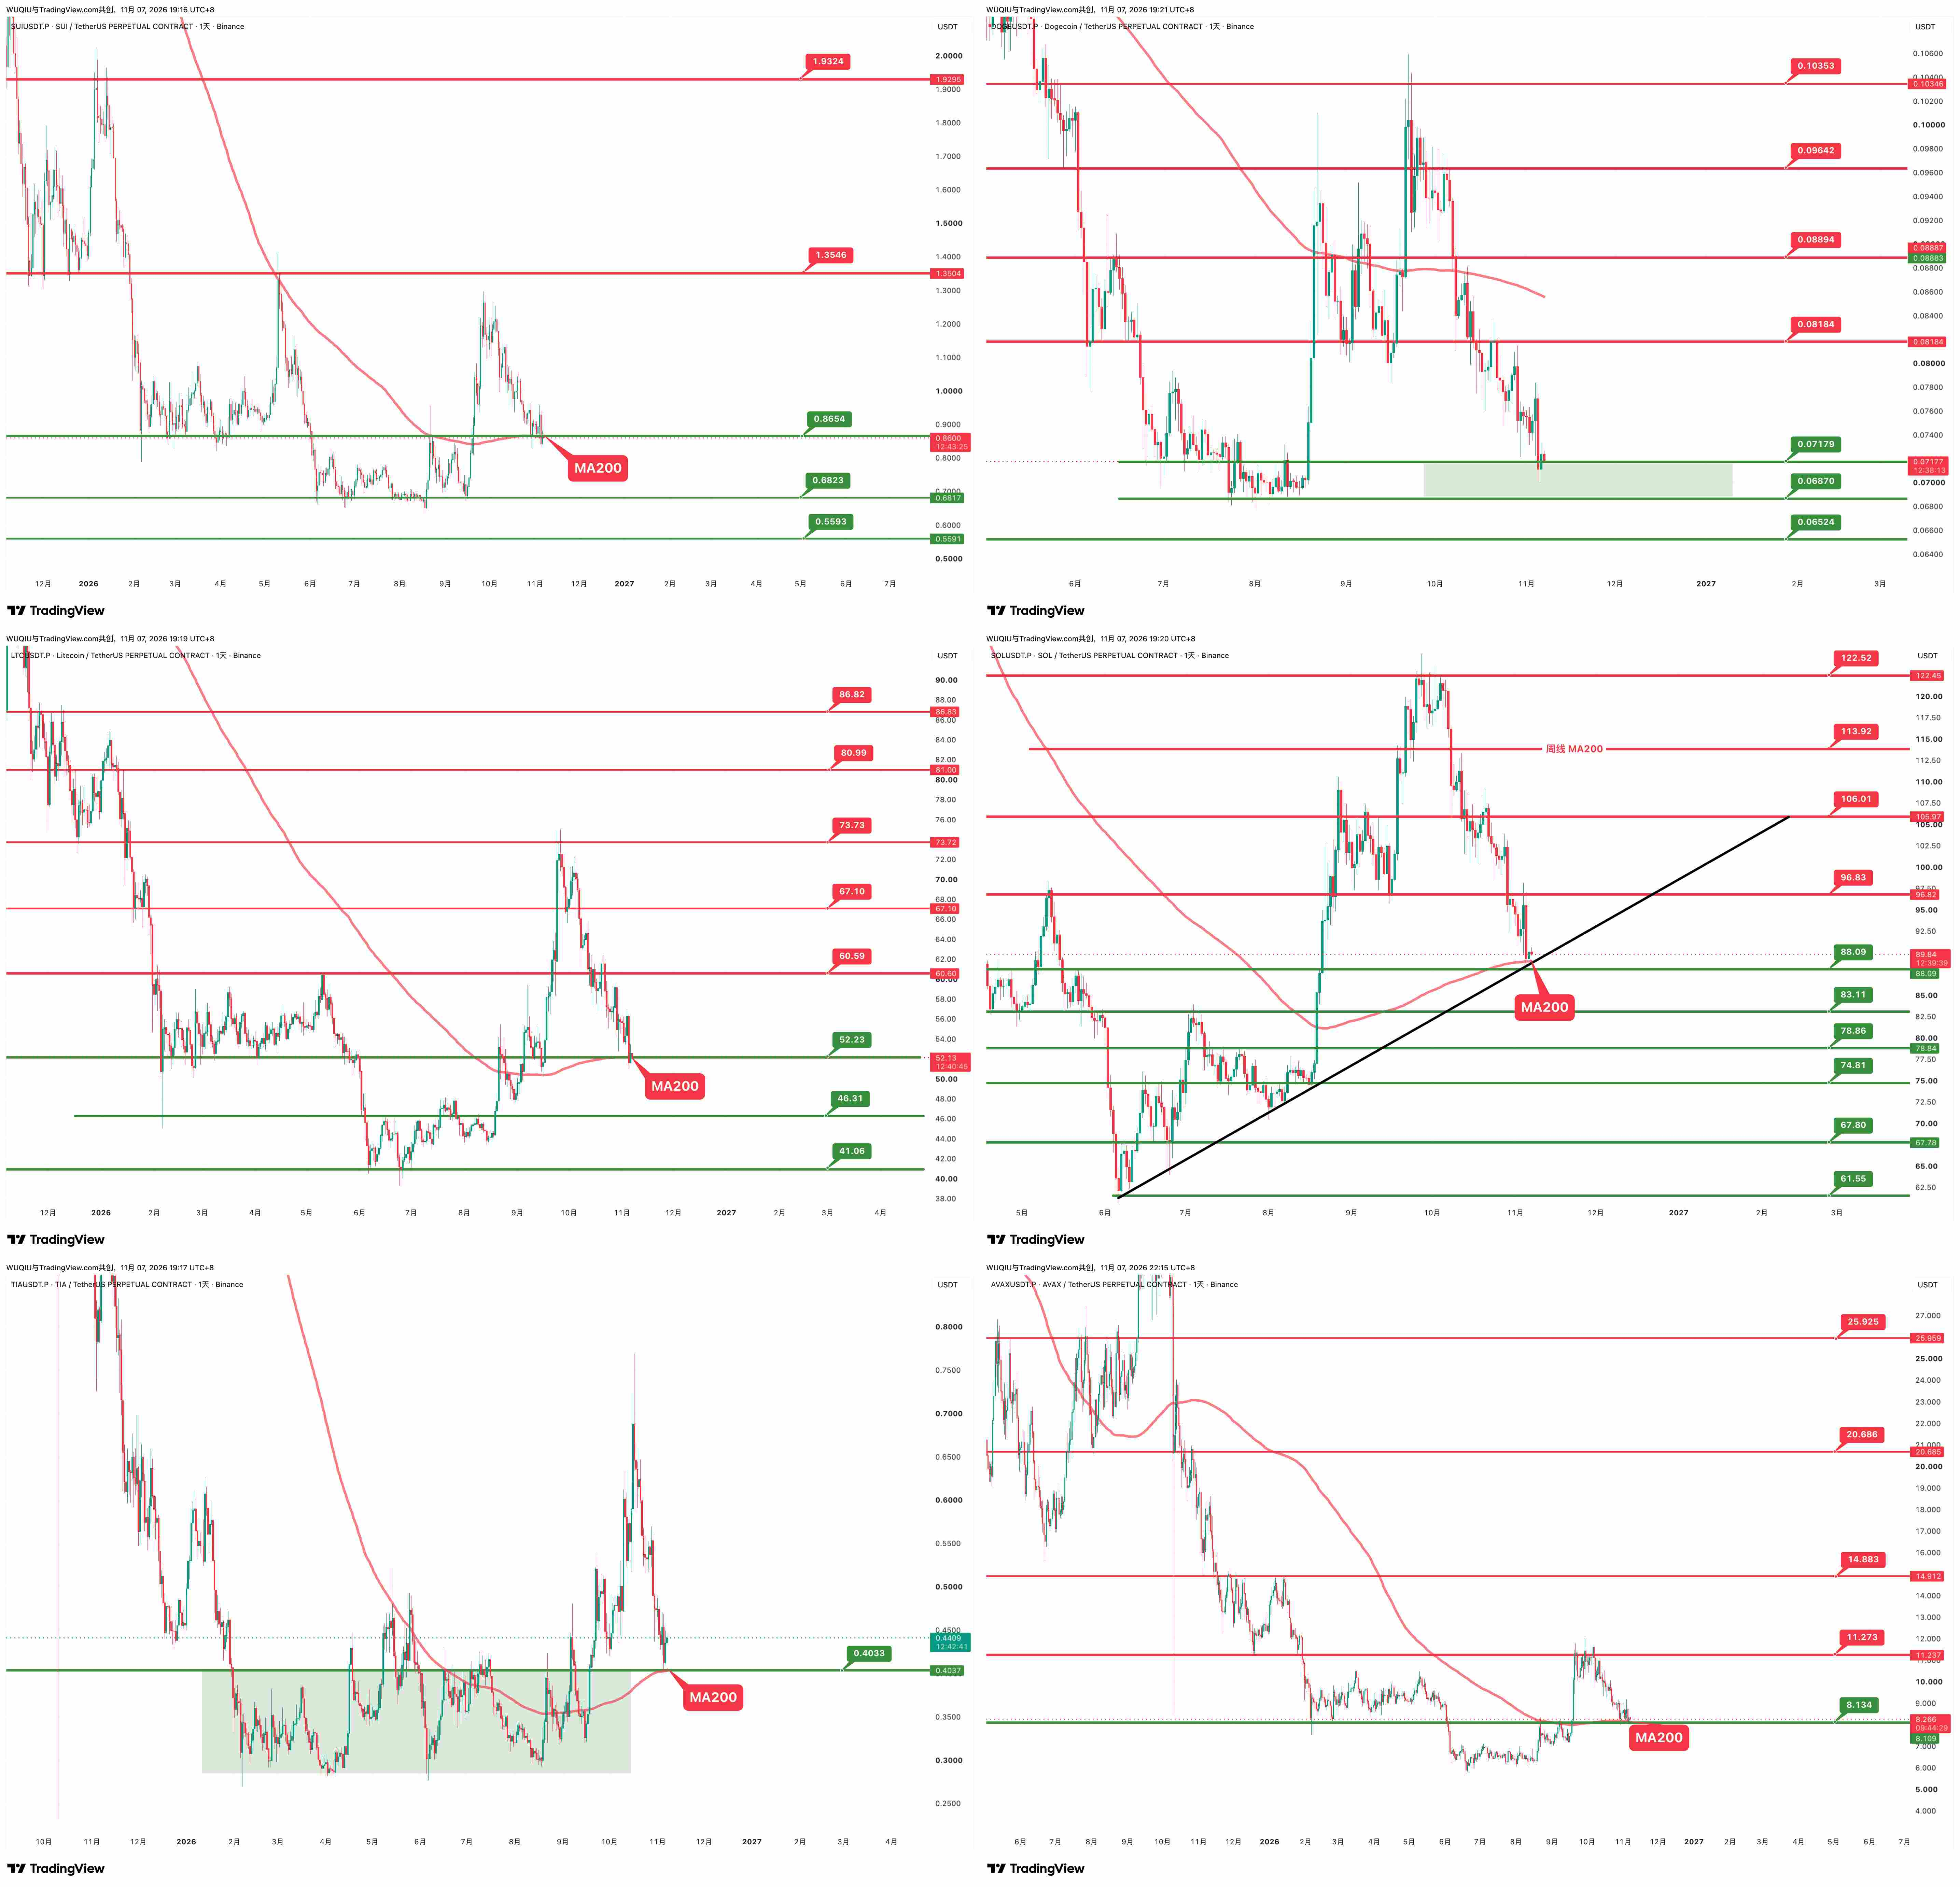
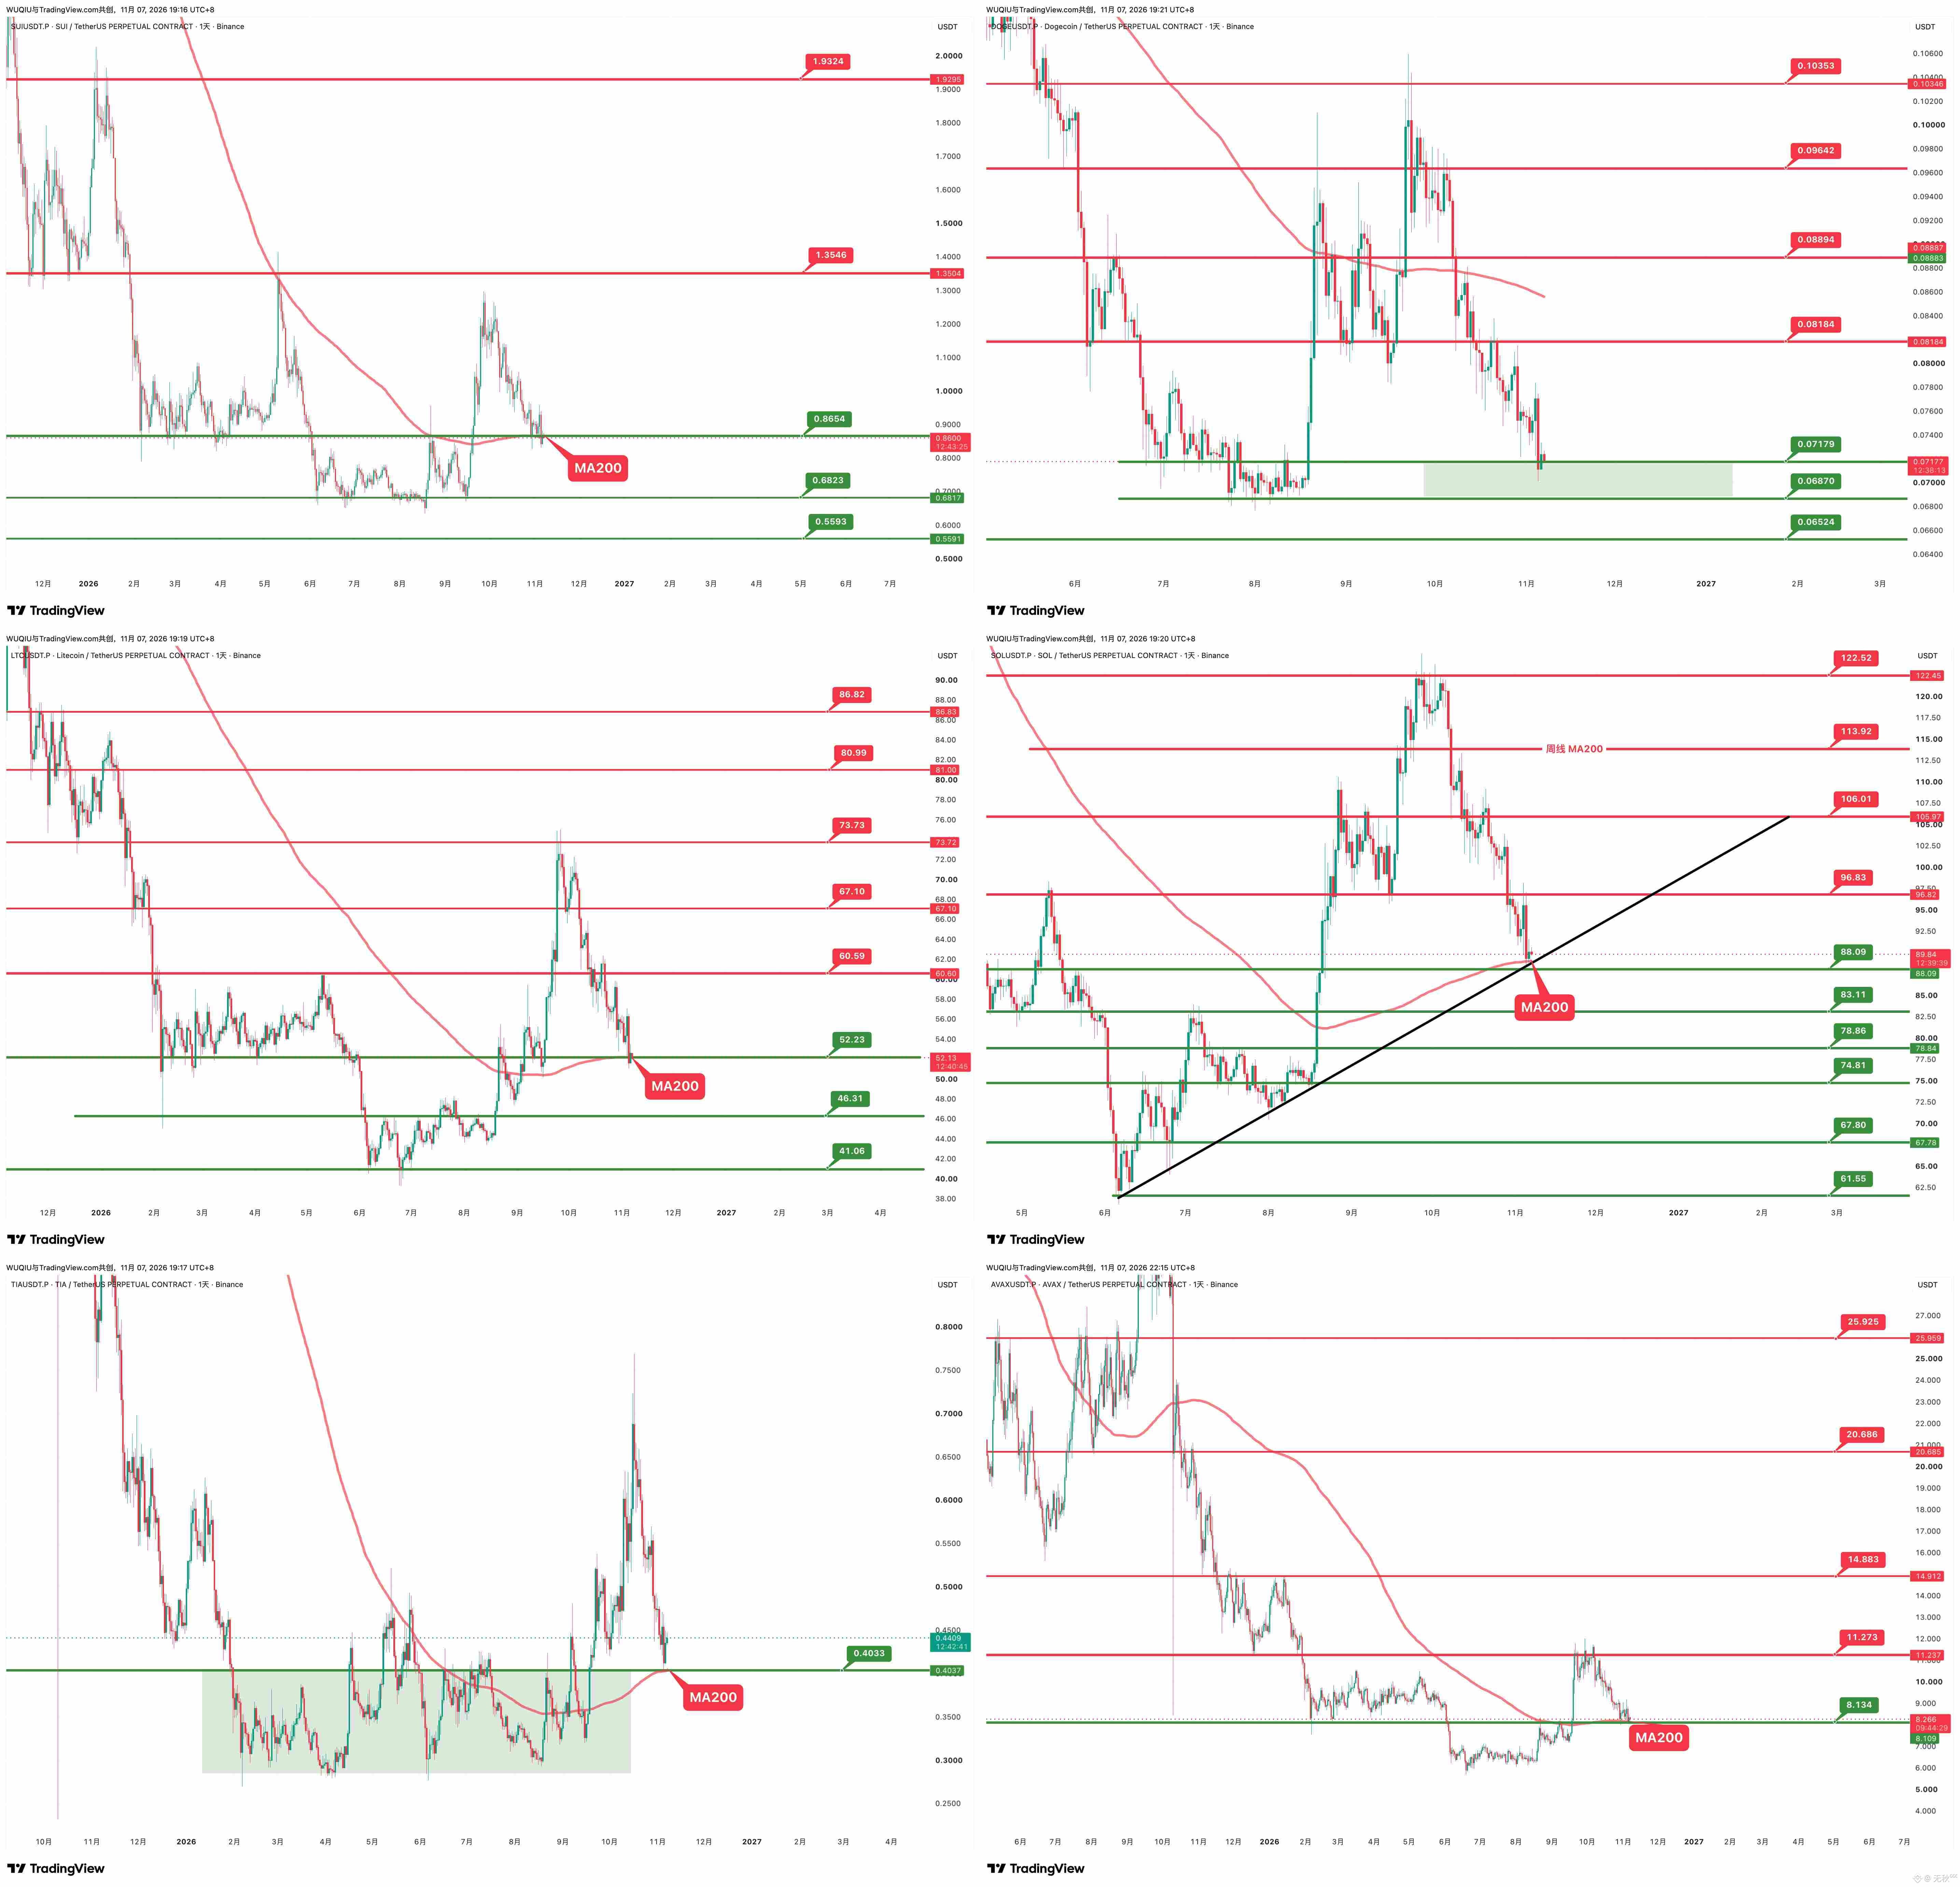
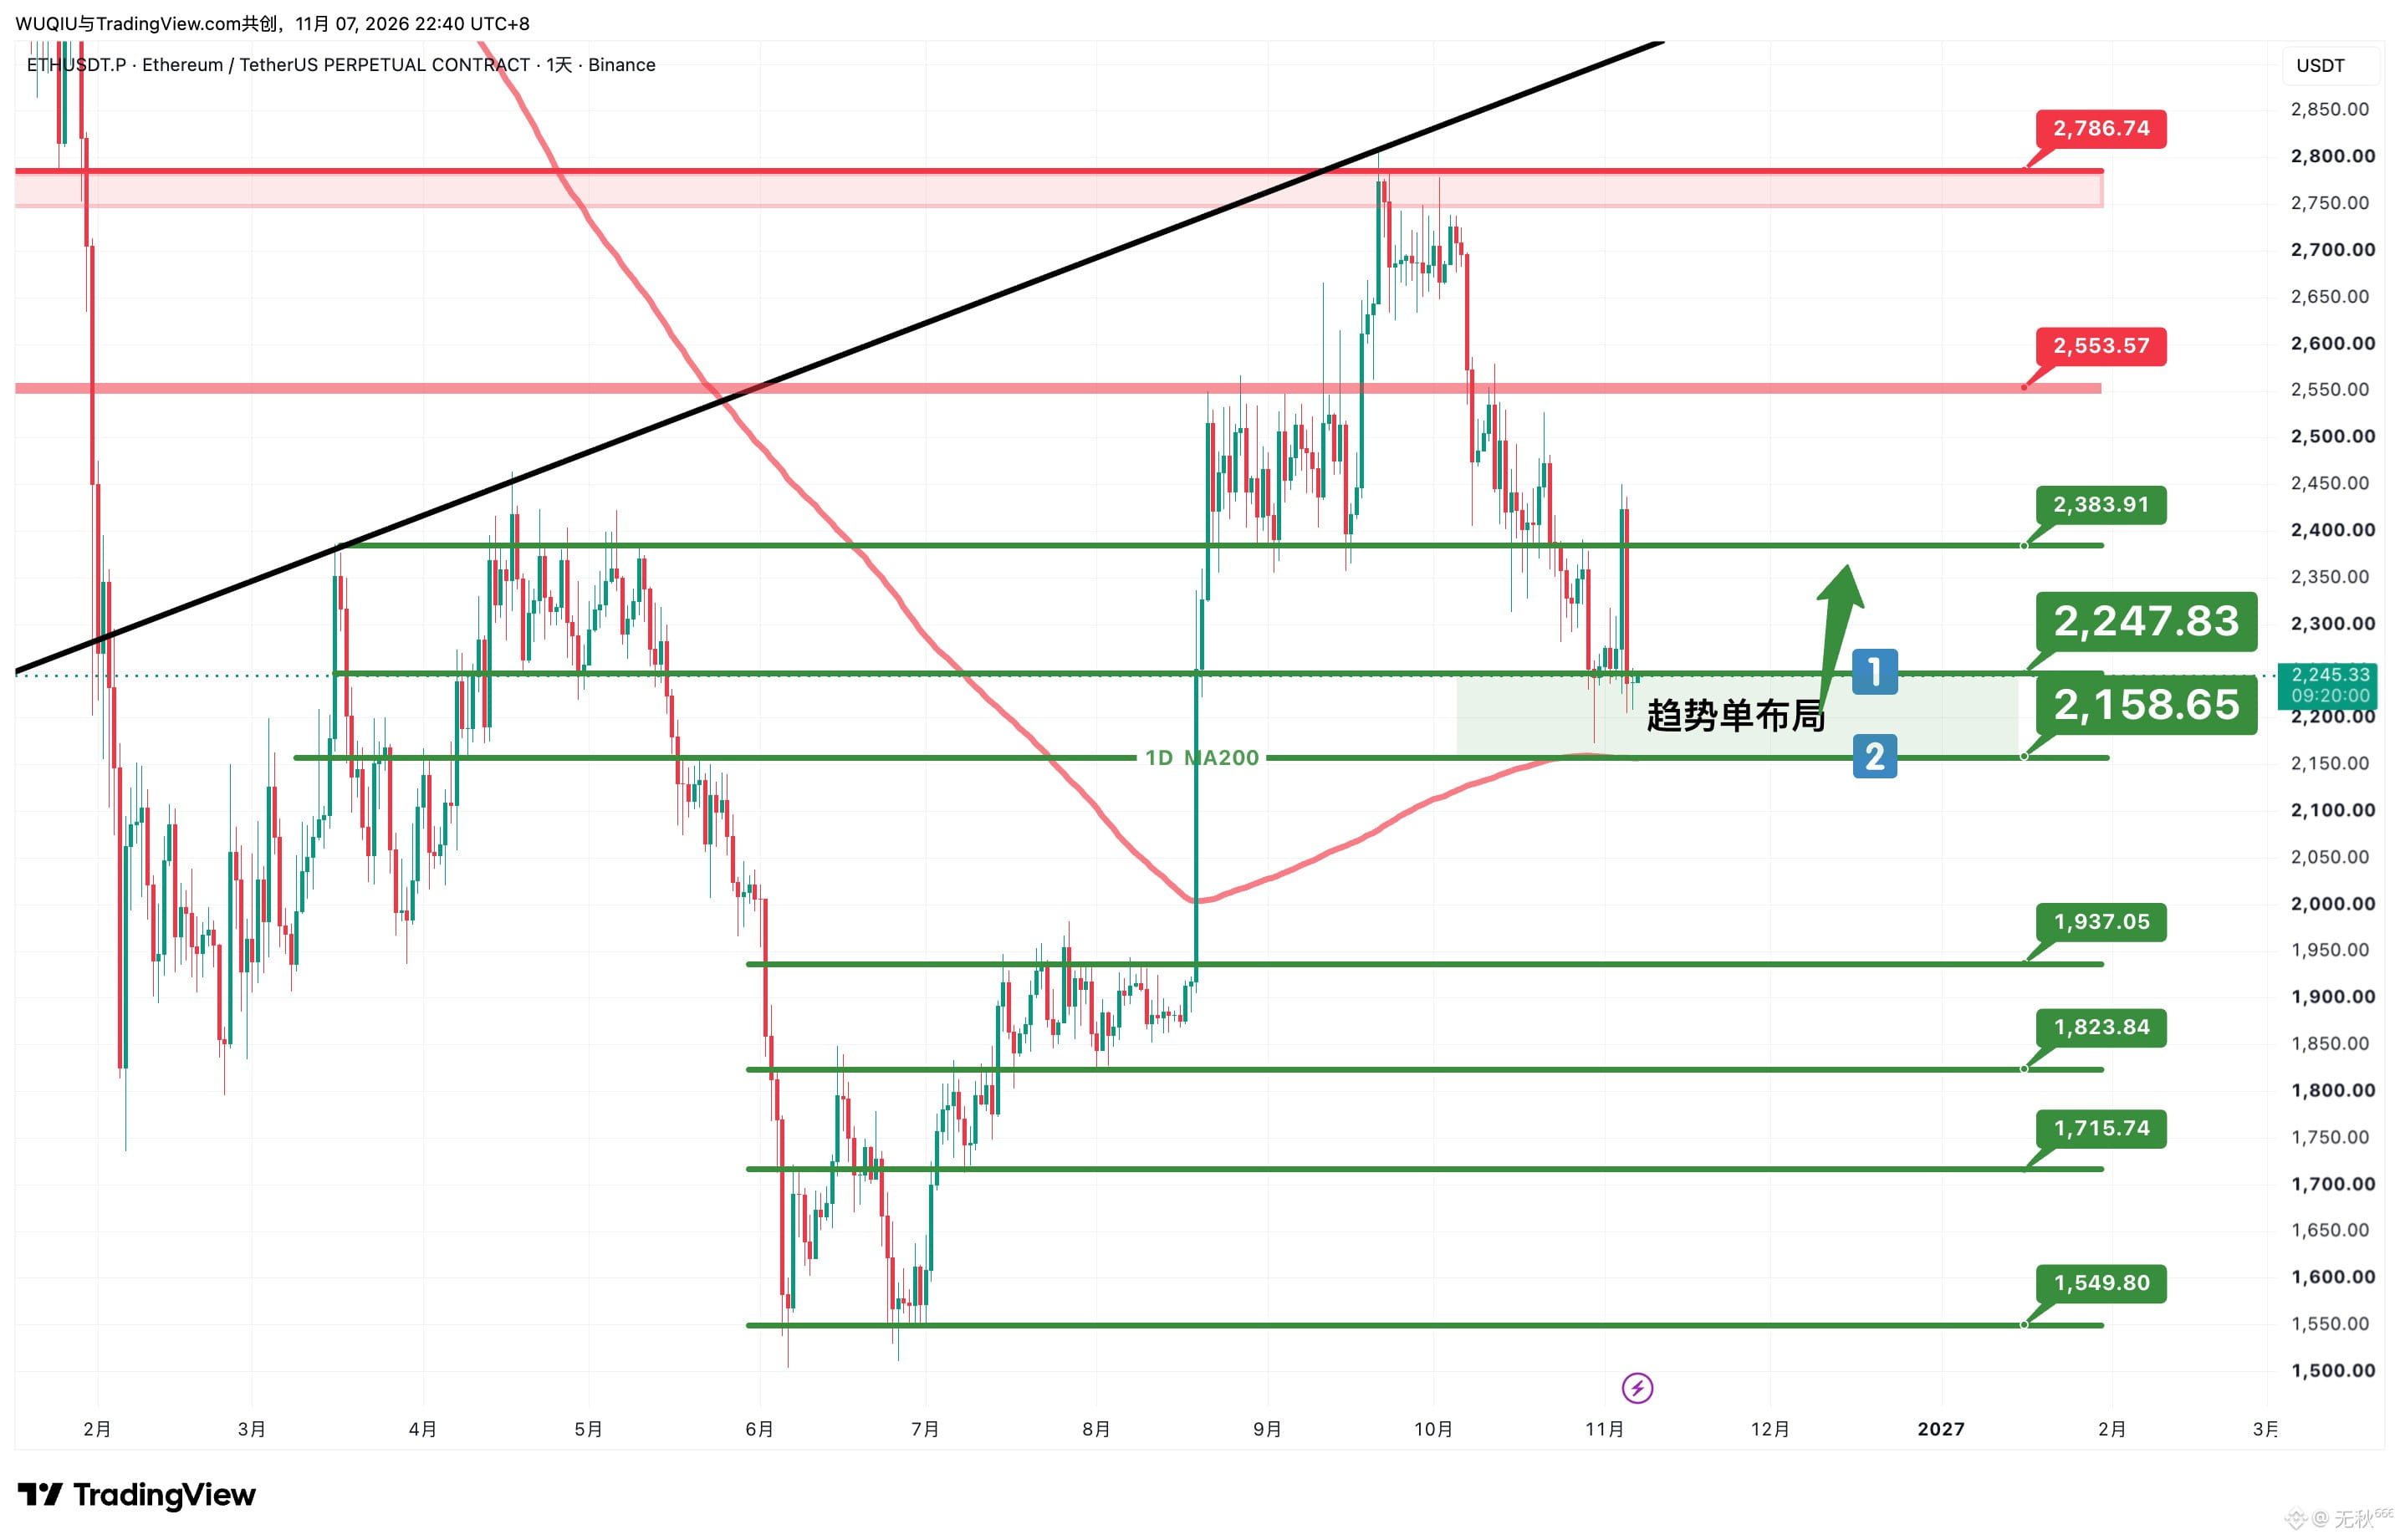
⚡️ 1. MA200 (the 200-day moving average) is one of the most important long-term trend dividing lines in the crypto market, and its current level is critical for all major crypto assets. Most major coins on Binance have now pulled back to the support of the daily MA200, while altcoins that had previously underperformed have returned to key support areas near their daily-chart lows. From a candlestick technical perspective, these are all areas to build positions for the next trend move. (Only around 40–43% of the top 150 coins by market cap are above the 200-day moving average, and around 70% of Binance altcoins have fallen below it. The rebound from August–September has already been largely erased. If we firmly believe that the current stage is a transition from a bear market to a bull market, the pullback can be considered sufficiently deep.)
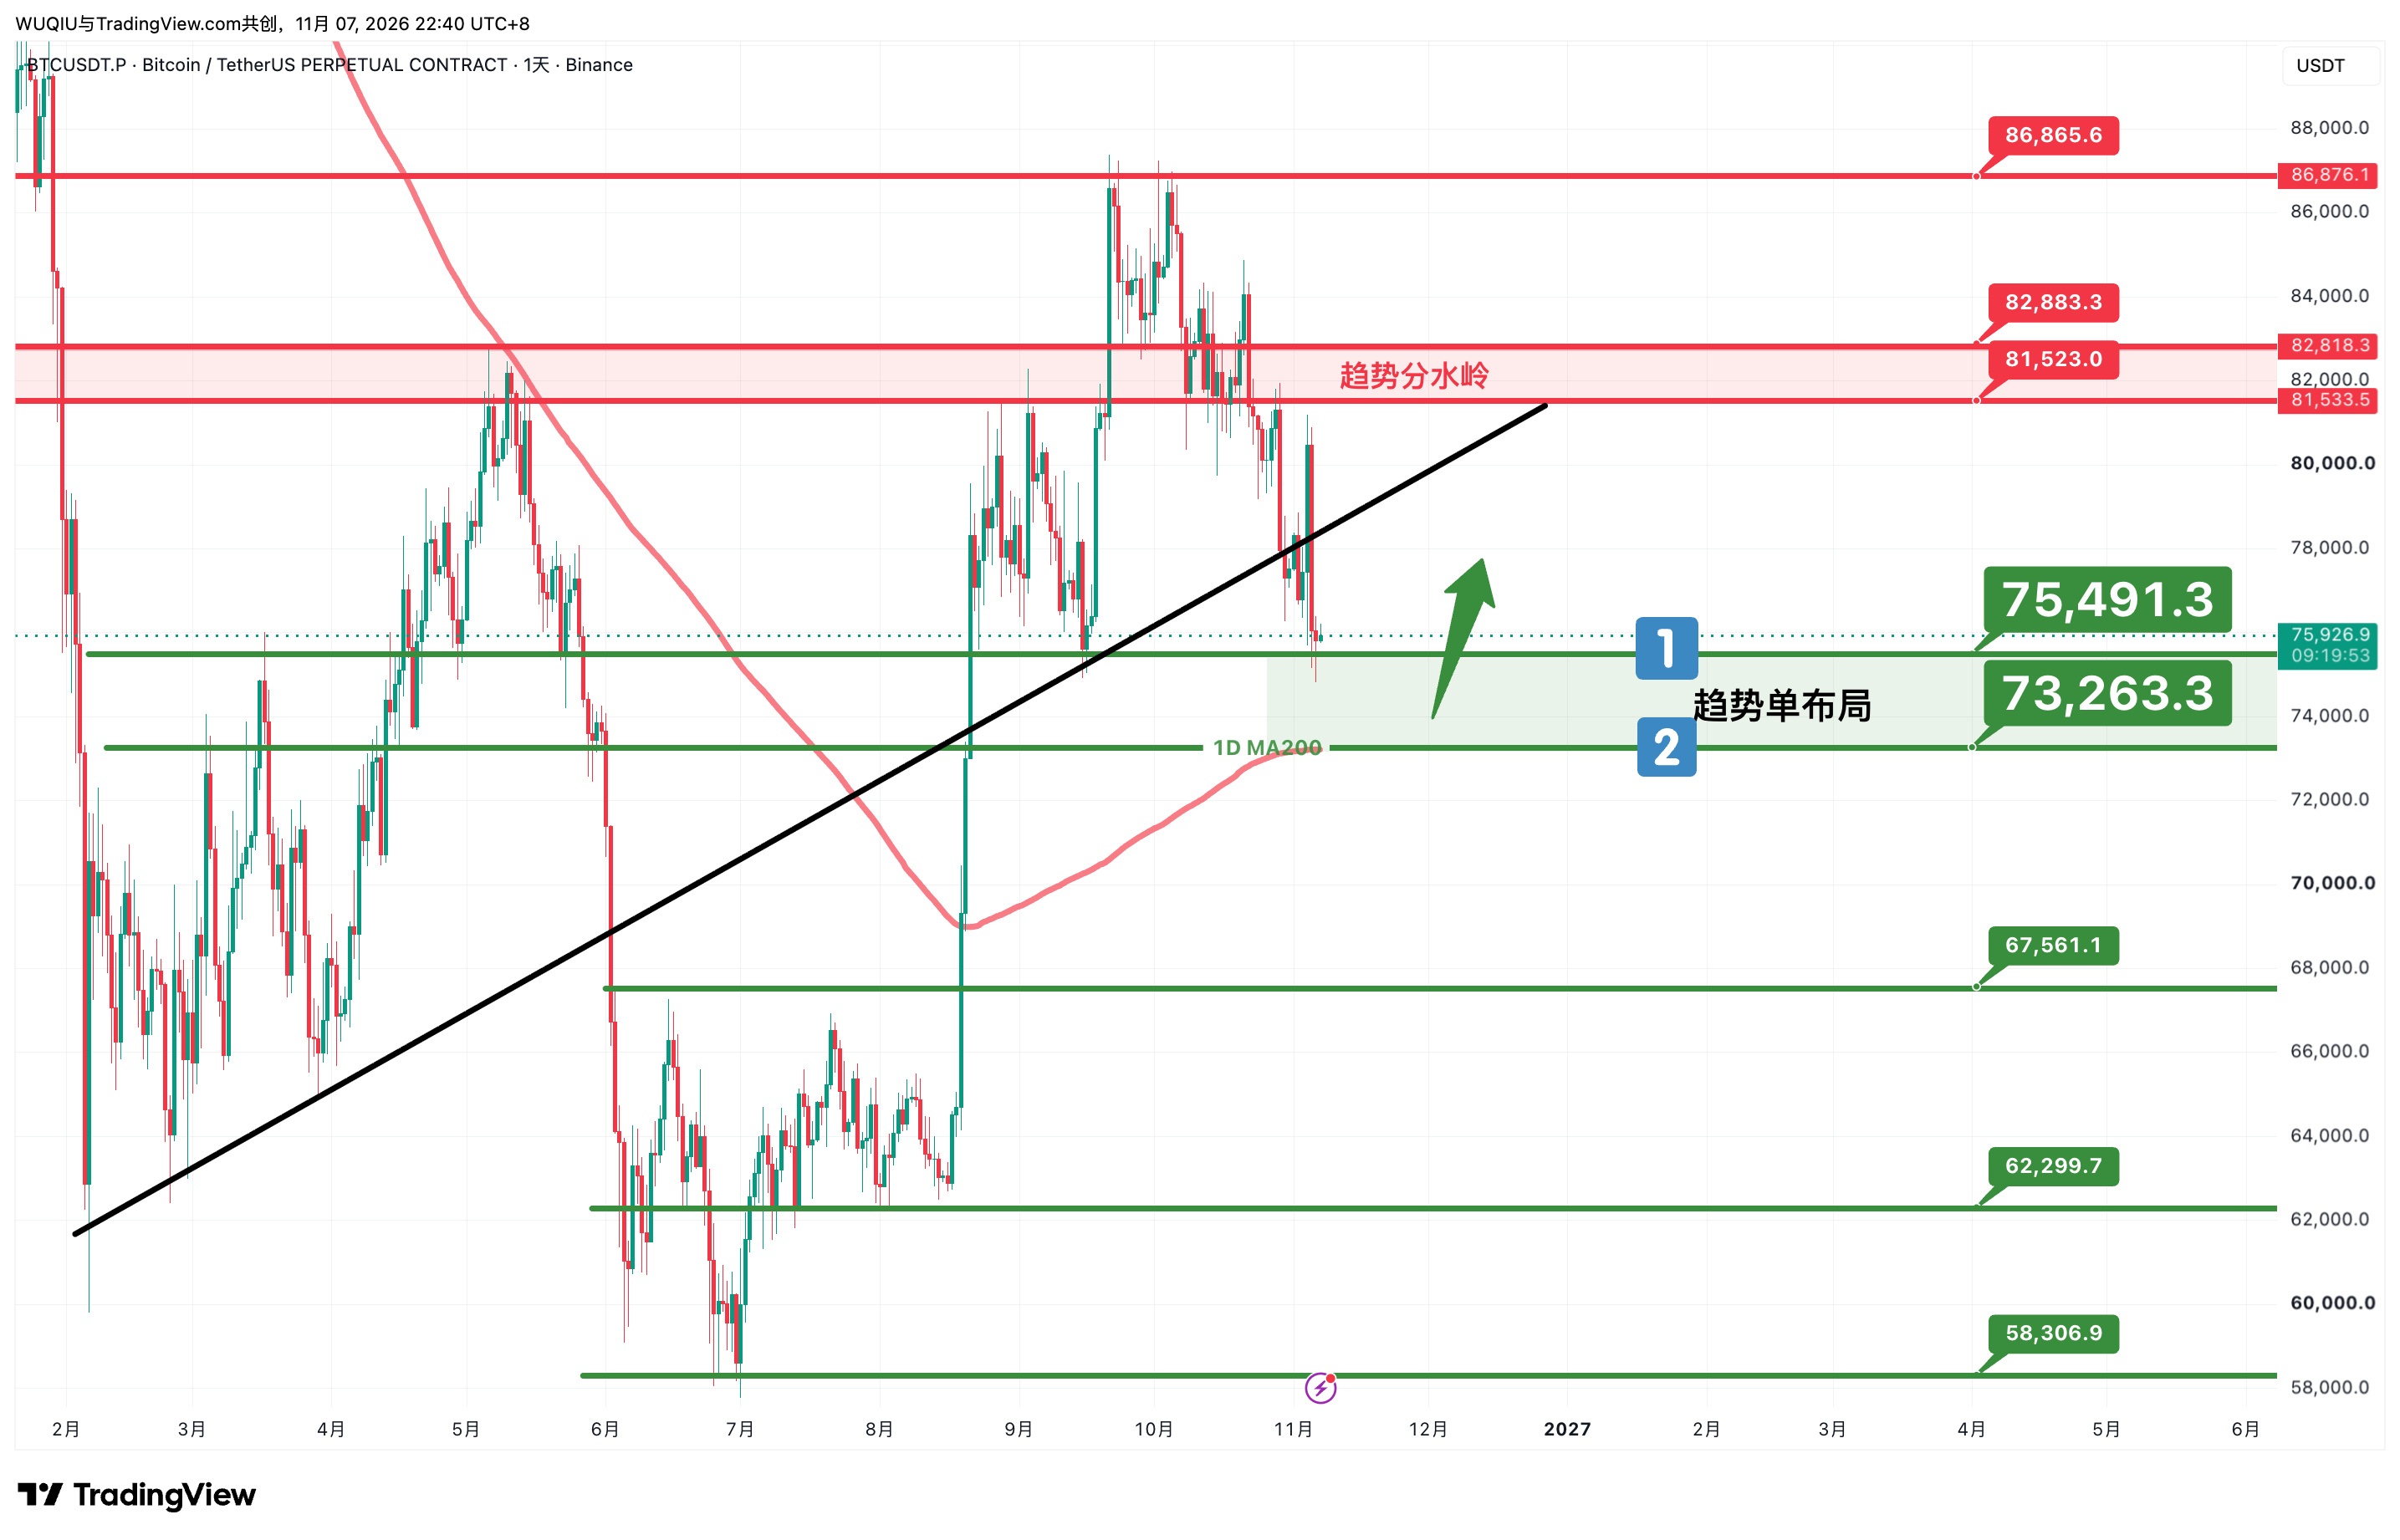
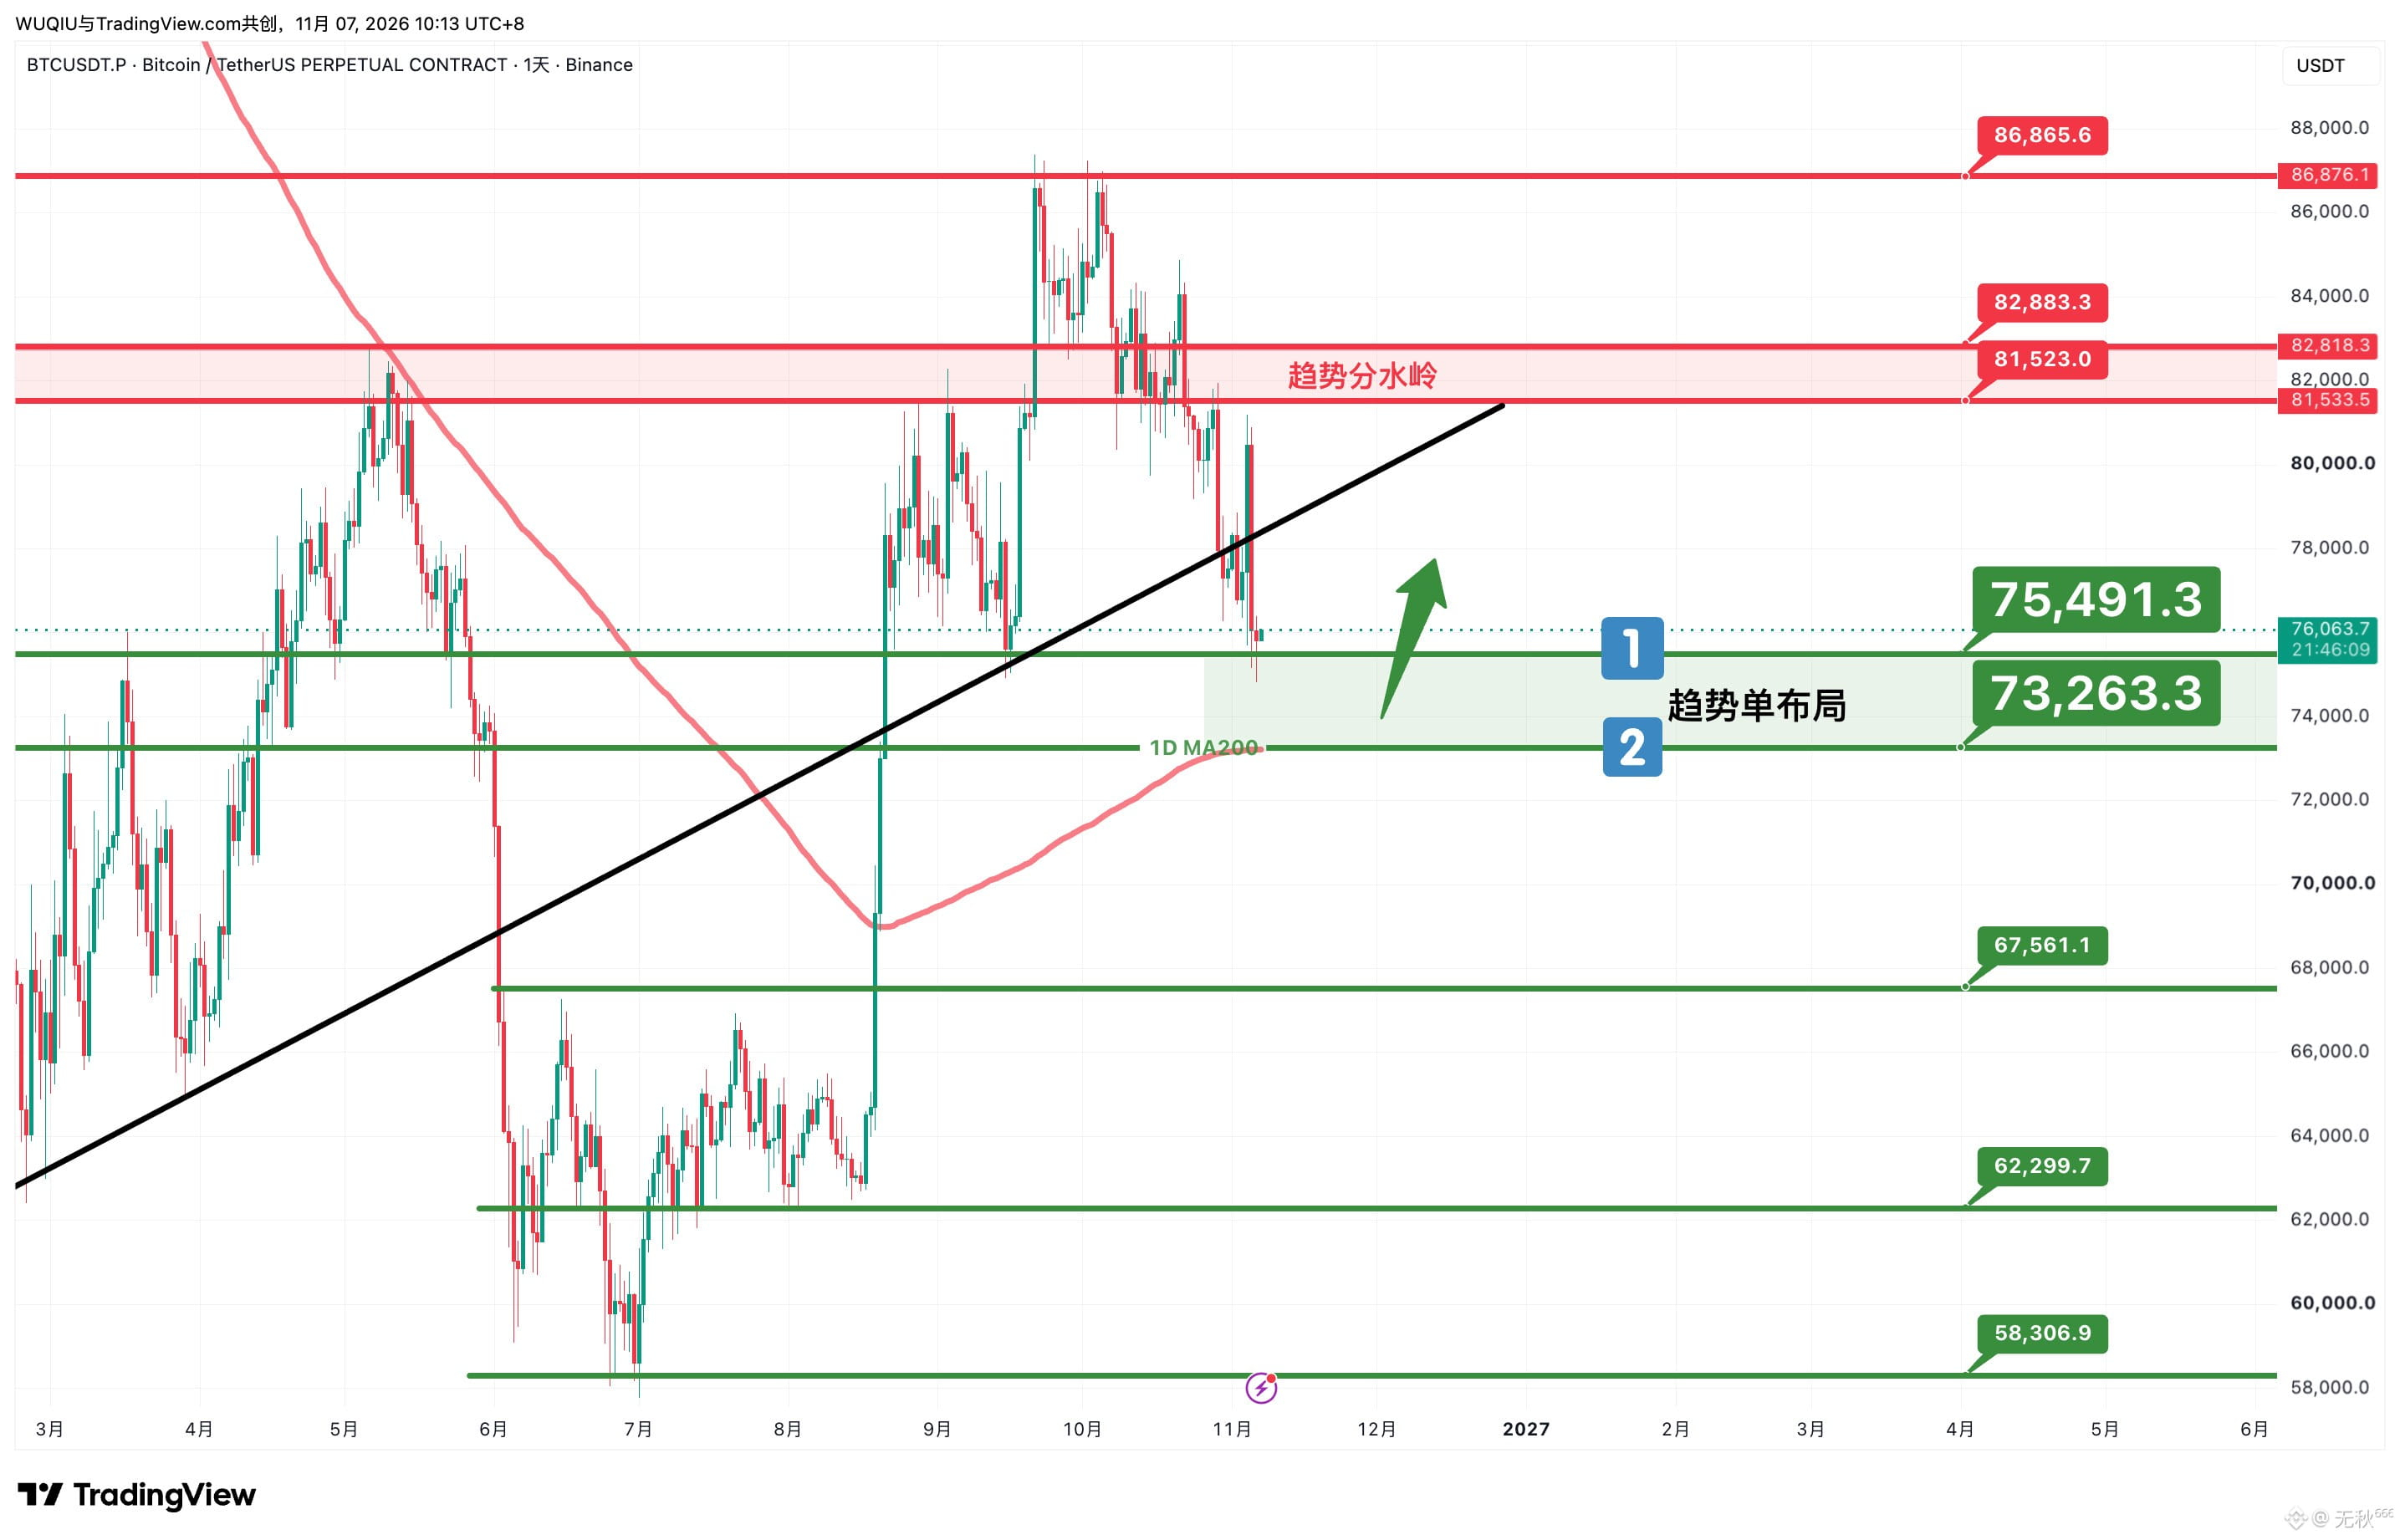
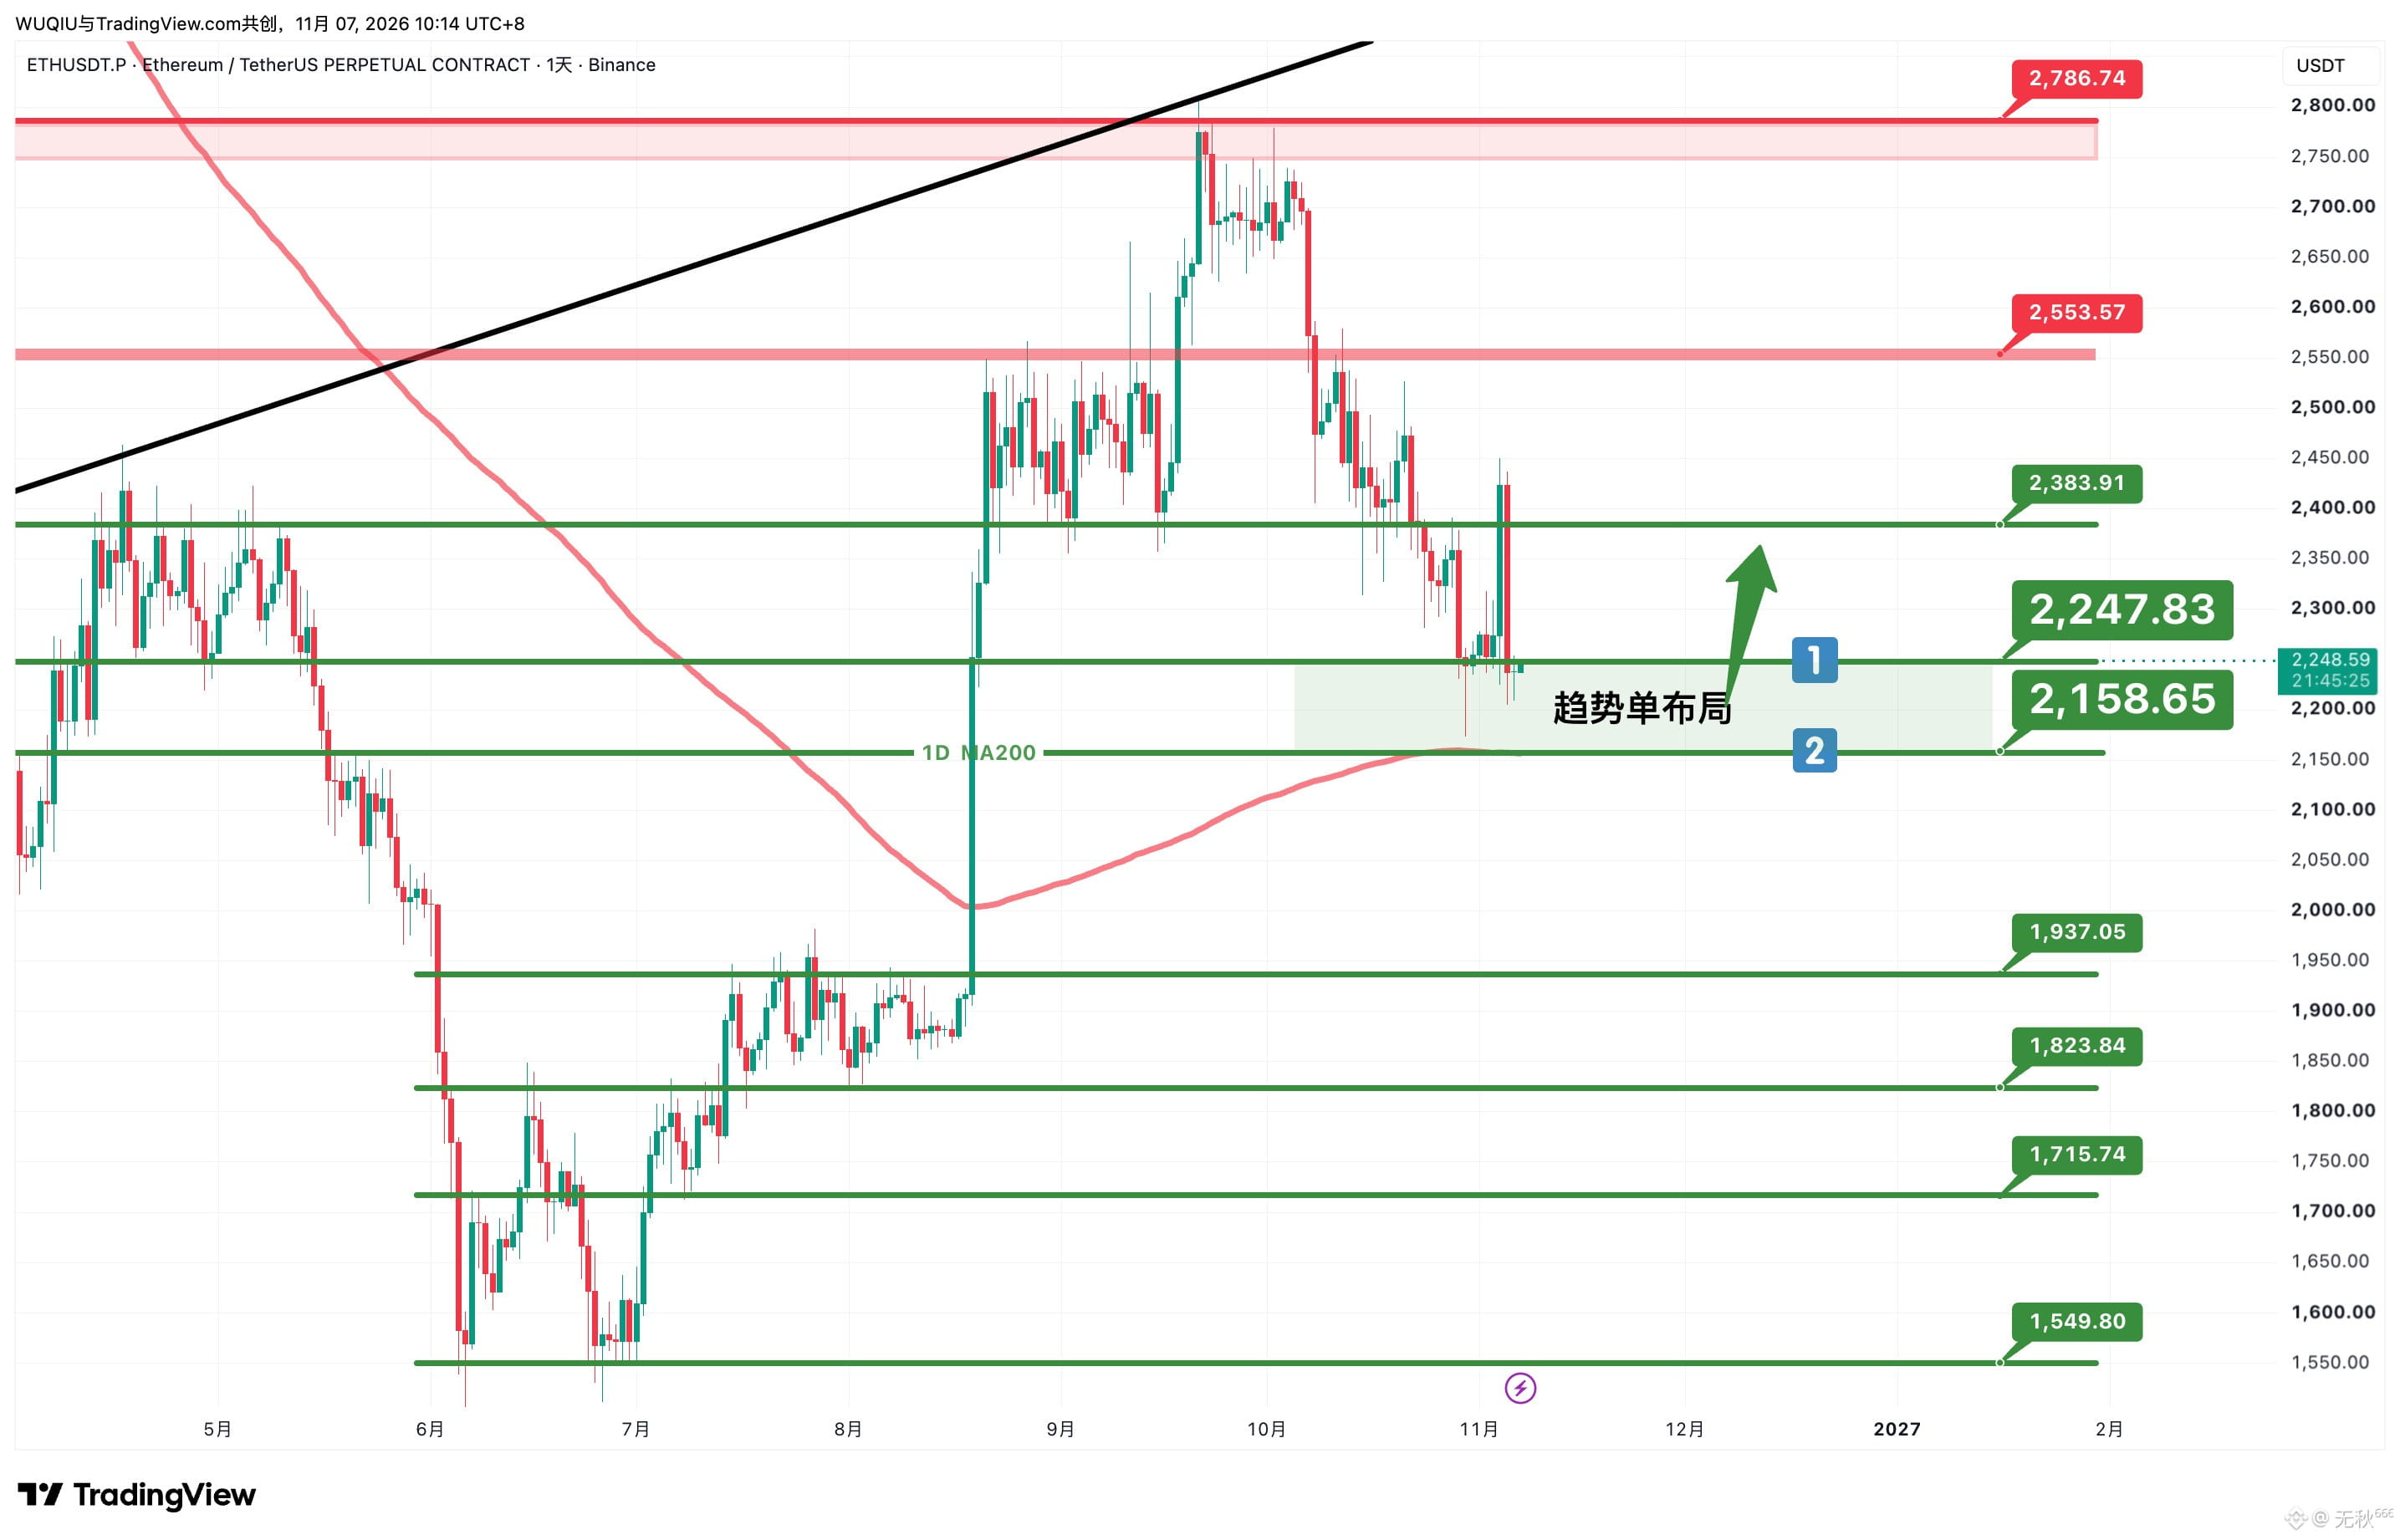
⚡️ 2. BTC: The daily MA200 is around $73,200–$73,280, and is potential support for the right shoulder of a weekly inverse head-and-shoulders pattern. ETH: The MA200 is around $2,157–$2,160, likewise potential support for the right shoulder of a weekly inverse head-and-shoulders pattern. BTC and ETH are currently still a little way from their respective daily MA200 levels, so the key scenario to watch next week is whether price makes a quick wick down to the daily MA200 support, then rapidly recovers on high volume to form a bullish engulfing candle. In the chart shared earlier, entry point 2 was marked as a potential entry for that wick (be sure to use an appropriate stop-loss). Of course, if you prefer right-side trading, you should wait for the wick to happen and for price to recover and form a bullish engulfing candle (confirmed by the hourly close) before entering, rather than placing a limit order on the left side.
⚡️ 3. As a long-term bull/bear dividing line, the MA200 is not only a key technical support level but also a major psychological line of defense, and one of the few worthwhile areas for a major trade. If the worst-case scenario occurs and price breaks below it decisively, that is often accompanied by a longer period of renewed correction (several months), and the start of the bull market would be significantly delayed.
#美国拟收紧数据中心监管,AI扩张或面临新约束 #BTC走势分析
⚡️ 2. BTC: The daily MA200 is around $73,200–$73,280, and is potential support for the right shoulder of a weekly inverse head-and-shoulders pattern. ETH: The MA200 is around $2,157–$2,160, likewise potential support for the right shoulder of a weekly inverse head-and-shoulders pattern. BTC and ETH are currently still a little way from their respective daily MA200 levels, so the key scenario to watch next week is whether price makes a quick wick down to the daily MA200 support, then rapidly recovers on high volume to form a bullish engulfing candle. In the chart shared earlier, entry point 2 was marked as a potential entry for that wick (be sure to use an appropriate stop-loss). Of course, if you prefer right-side trading, you should wait for the wick to happen and for price to recover and form a bullish engulfing candle (confirmed by the hourly close) before entering, rather than placing a limit order on the left side.
⚡️ 3. As a long-term bull/bear dividing line, the MA200 is not only a key technical support level but also a major psychological line of defense, and one of the few worthwhile areas for a major trade. If the worst-case scenario occurs and price breaks below it decisively, that is often accompanied by a longer period of renewed correction (several months), and the start of the bull market would be significantly delayed.
#美国拟收紧数据中心监管,AI扩张或面临新约束 #BTC走势分析
无秋⁶⁶⁶
·
--
$BTC $ETH Entry area remains unchanged:
Spot / buy-the-dip long (low-leverage trend trade). For daily-level buy orders below, use level 1 for the initial position and level 2 to add to it. Suggested ratio for staged entries: 1:2. If using a stop-loss, set it yourself a reasonable distance below level 2.
#比特币反弹至7.5万美元芯片股领涨 #美股一夜蒸发超2万亿,多家对冲基金面临清算
Spot / buy-the-dip long (low-leverage trend trade). For daily-level buy orders below, use level 1 for the initial position and level 2 to add to it. Suggested ratio for staged entries: 1:2. If using a stop-loss, set it yourself a reasonable distance below level 2.
#比特币反弹至7.5万美元芯片股领涨 #美股一夜蒸发超2万亿,多家对冲基金面临清算



无秋⁶⁶⁶
·
--
$KORU As mentioned earlier, Brother Li is also starting to recover. For spot holdings, you can choose to hold; for futures long positions, start reducing your position gradually in batches around the current price of 13, and you can take all your profits around 17.5. If the price falls below your cost basis again (back into the 11.5–8.5 range), you can add back the positions you reduced.
Spot position: $KORUB
Entry range: 8.45–11.5
Target range: 17–20
#109亿美元比特币期权周五到期 #韩国考虑设立永久性加密调查单位
Spot position: $KORUB
Entry range: 8.45–11.5
Target range: 17–20
#109亿美元比特币期权周五到期 #韩国考虑设立永久性加密调查单位
Log in to explore more content