
Coinspeaker
12.5k Posts

Coinspeaker
 Square Verified+
Report
Block User
Coinspeaker
0 Following
71.6K+ Followers
107.5K+ Liked
Posts
·
--
Verified
Article
Musk Joins 160,000 Signers Calling for Jensen Huang’s Nvidia Comeback: How Is NVDA Stock Reacting?Elon Musk said on Friday, November 13, that he is signing the Jensen Huang petition, an open letter asking Nvidia’s board to bring back its former chief executive. Huang resigned a day earlier, after reports of extramarital affairs.
By Monday, the “Stand with Jensen” letter had more than 160,000 signatures. Epic Games CEO Tim Sweeney, Y Combinator CEO Garry Tan and Uber co-founder Travis Kalanick have also backed it. The letter asks the board to reinstate Huang while an independent investigation establishes the facts.
SILICON VALLEY VS. WHITE HOUSE: BATTLE FOR NVIDIA
Tech executives are pushing to reinstate Jensen Huang, while Treasury Secretary Scott Bessent reportedly opposes his return.
A petition backing Huang has drawn 175,000 signatures.
Yet prediction markets give Huang just an 18%… pic.twitter.com/BZl5KheVnq
— *Walter Bloomberg (@DeItaone) November 16, 2026
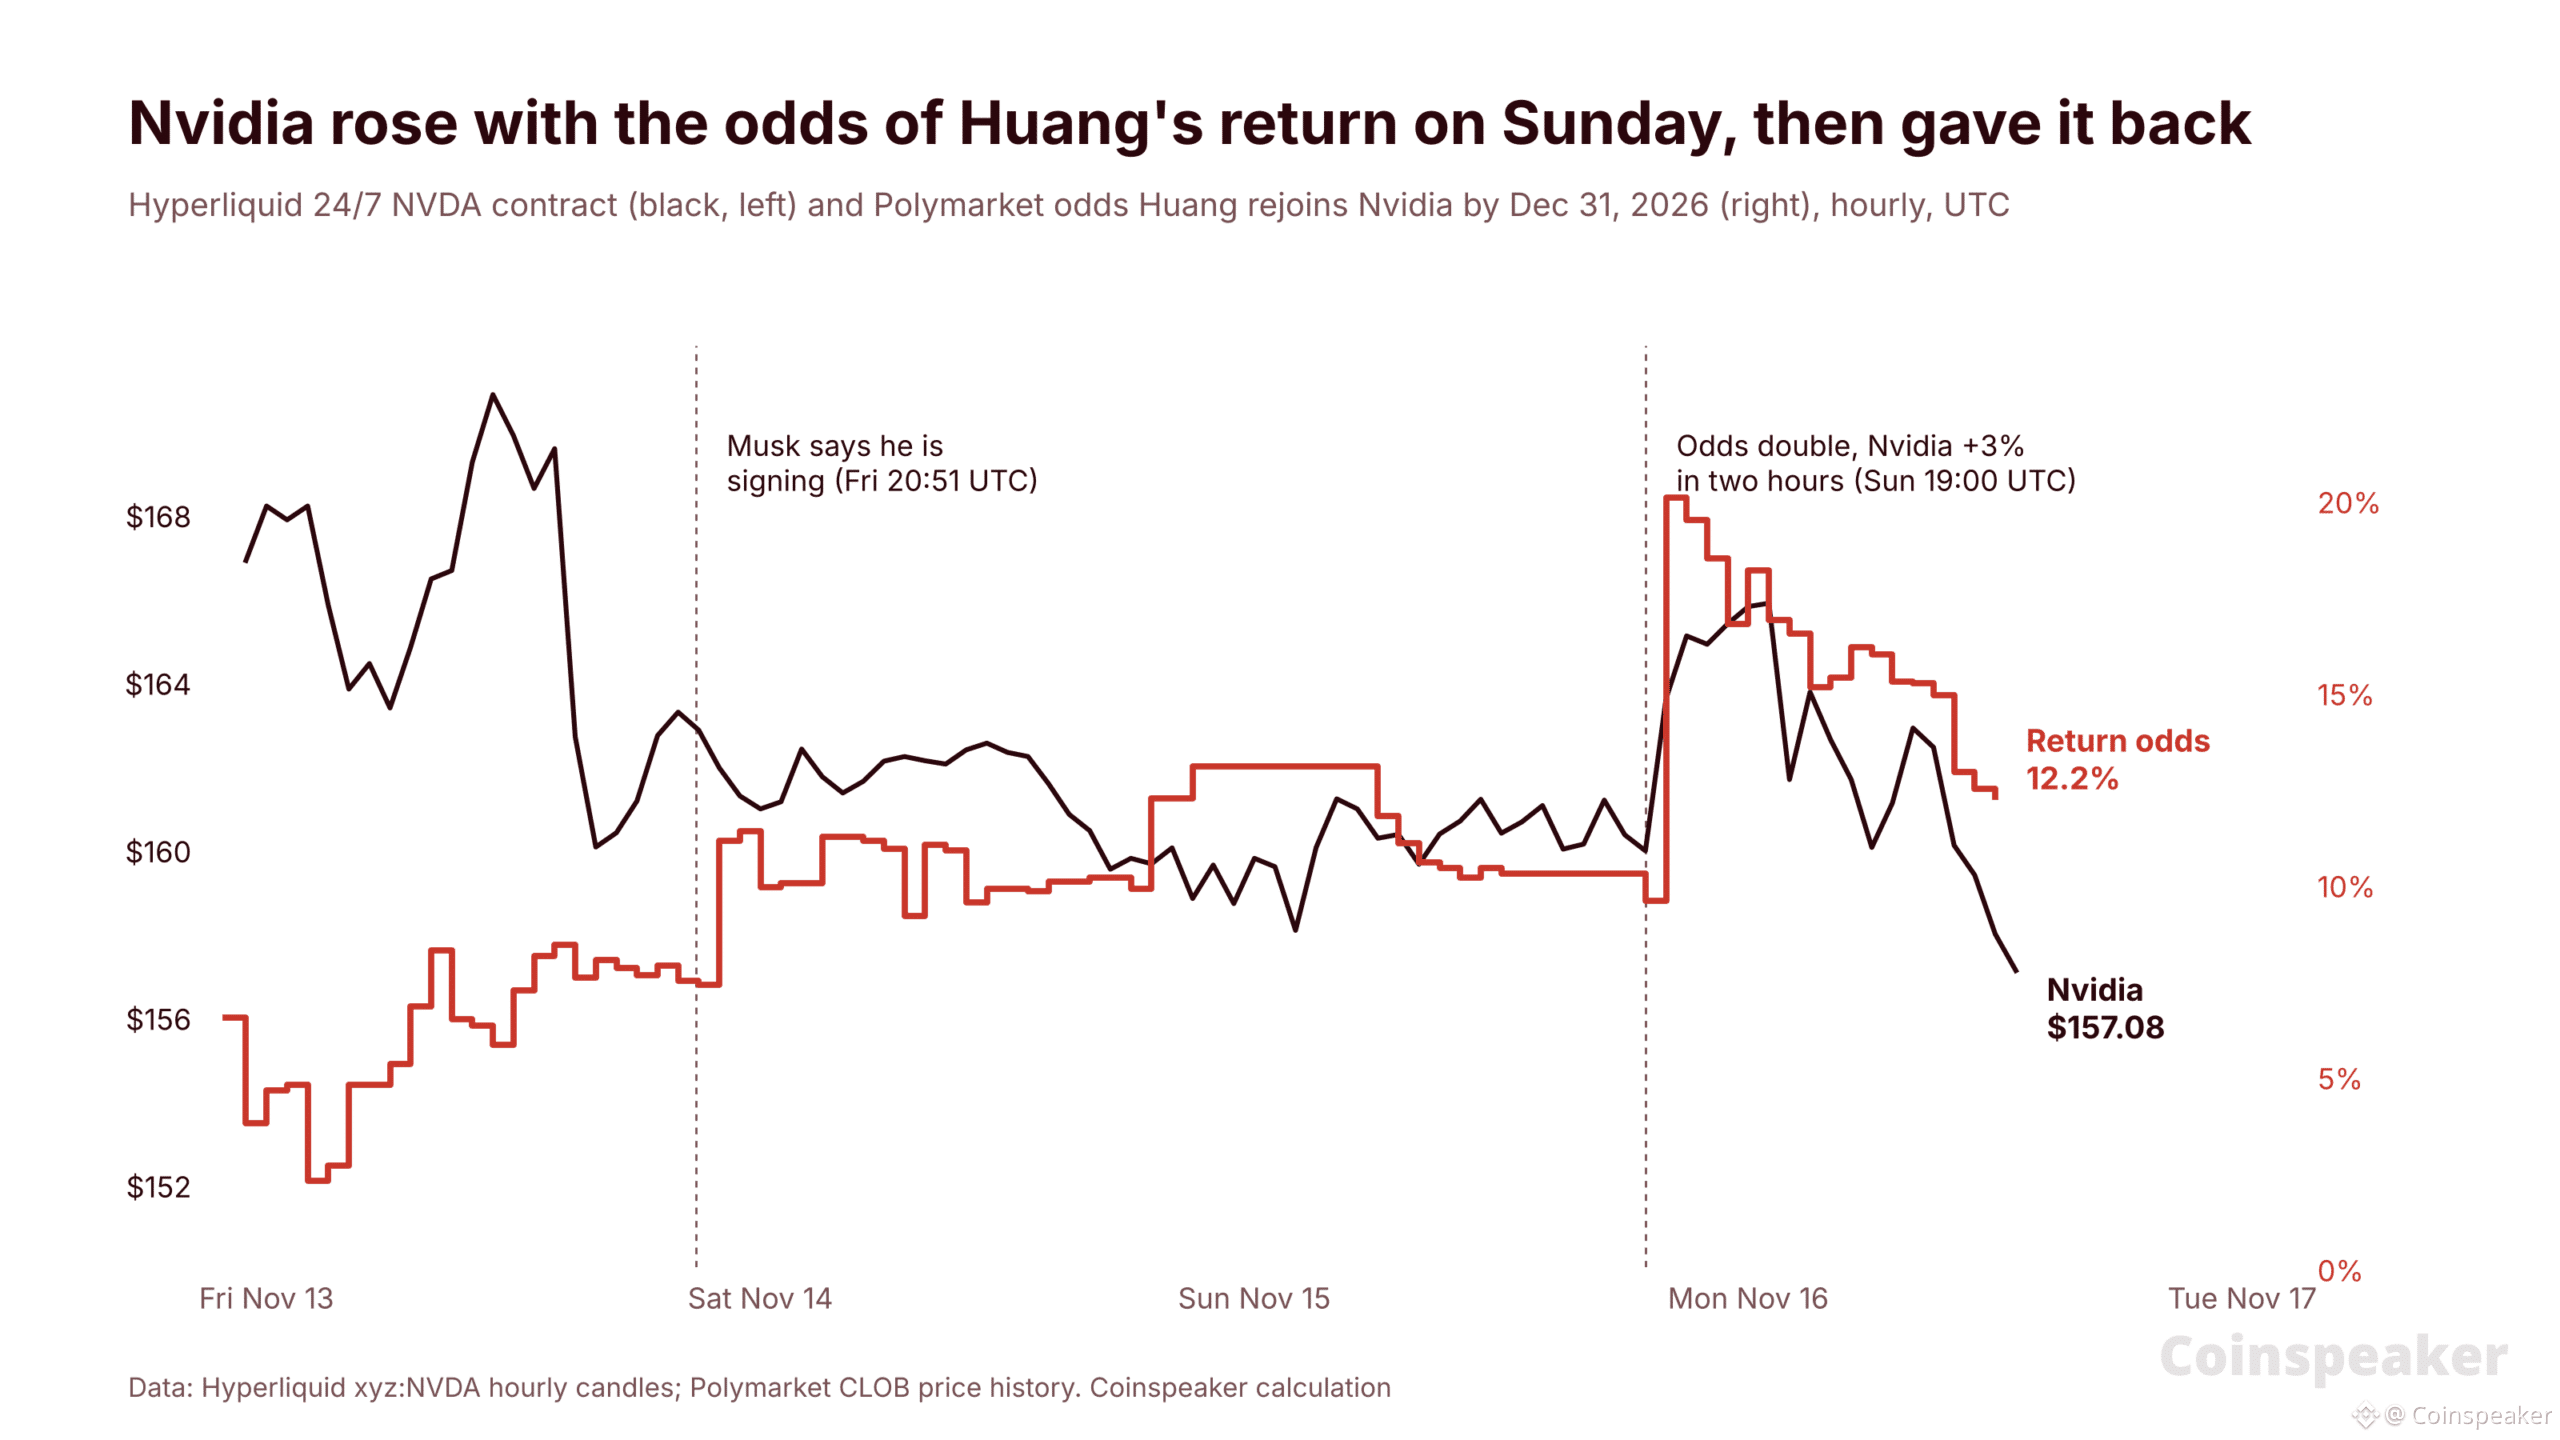
We matched Polymarket’s odds of Huang’s return with a 24/7 Nvidia stock contract on Hyperliquid. Musk’s post lifted the odds but barely moved the stock. A sharper jump in the odds on Sunday evening did: the stock rose 3% within two hours, then gave it all back by Monday.
So how is Nvidia’s stock reacting, one day before earnings?
Jensen Huang Petition: Musk, Sweeney and Tan Back His Return
Musk posted on X that “a petition is underway to reinstate Jensen and I’m signing it too.” He had said earlier that hiring Huang would be “an honor.”
The petition is hosted at standwithjensen.com. Signers report their own job titles, and the site does not verify them. More than 7,500 say they work at the company, about 18% of its staff.
Investors are split:
For a return: Altimeter’s Brad Gerstner and Atreides’ Gavin Baker asked the board on Friday to keep “all options on the table, including the potential return of Jensen Huang.”
Against: U.S. Treasury Secretary Scott Bessent said on Sunday that Nvidia needs “a dramatic shake-up.” He wants answers from the board within 10 days.
Skeptics: Wedbush analyst Dan Ives said he sees “no chance Jensen comes back to Nvidia as CEO.”
The company says it is choosing a search firm for the CEO role and has not formally approached any candidates. Chief financial officer Colette Kress runs the company in the meantime.
Market Intelligence: Crypto Analyst Predicts Top Solana Meme Coins to Bid
Nvidia Market Reaction: The Stock Followed the Odds
Nasdaq is shut on weekends, but the stock still trades around the clock as a perpetual contract, a futures-style contract with no expiry date, on Hyperliquid. To see whether the Jensen Huang petition moved the stock, we lined up its hourly price with Polymarket’s odds that Huang rejoins by December 31, 2026.
Musk’s post (Friday, 20:51 UTC): the odds rose from 7.4% to 11.1% within the hour. The contract slipped from $162.82 to $161.92.
Sunday, 19:00 to 21:00 UTC: the odds jumped from 9.6% to 20.1%, and the contract rose 3.2%, from $159.94 to $165.07. The contract traded $98 million in one hour, 32 times its typical weekend hour. We found no single report that set it off.
Monday: the odds eased to 12.3%, and the contract fell to $157.08. That is 3.5% below Friday’s Nasdaq close of $162.85.
Polymarket’s longer bets show how far the Jensen Huang petition still has to go. Traders give Huang a 37.5% chance of rejoining by the end of 2027, but only 5.6% by November 30.
EXPLORE: Elon Musk’s Grok AI Predicts an Explosive Move for Solana Crypto
Nvidia Price Analysis: Earnings Test Under Kress
On the daily chart, Hyperliquid’s NVDA contract trades at $156.93. It sits below its 50-day exponential moving average (EMA), an average that gives recent prices more weight, at $199.26, and its 200-day EMA at $206.42. On Nasdaq, the shares closed Friday at $162.85, down 18.6% since November 4.
Resistance: $166.97, Sunday’s high, then $171.50, Friday’s high.
Support: $156.23, Saturday’s low, then $148.86, the November 12 low and the lowest price of 2026 on this contract.
NVDA 1D chart. Source: Hyperliquid
Outlook Trigger Level to watch Rebound Calm earnings on Tuesday and a daily close above $166.97 $171.50, then $178.37, the November 11 high Holding pattern Daily closes between $156.23 and $166.97 A base while the CEO search runs Sell-off A daily close below $156.23 $148.86, the November 12 low
The Jensen Huang petition has moved the odds more than the stock. Musk’s backing barely shifted the price, and Sunday’s jump faded within a day. Tuesday’s earnings, the first under Kress, are likely to matter more to Nvidia shares than any petition.
Market Intelligence: Crypto Analyst Reveals Upcoming Coinbase Listings
next
The post Musk Joins 160,000 Signers Calling for Jensen Huang’s Nvidia Comeback: How Is NVDA Stock Reacting? appeared first on Coinspeaker.
Musk Joins 160,000 Signers Calling for Jensen Huang’s Nvidia Comeback: How Is NVDA Stock Reacting?
Elon Musk said on Friday, November 13, that he is signing the Jensen Huang petition, an open letter asking Nvidia’s board to bring back its former chief executive. Huang resigned a day earlier, after reports of extramarital affairs.
By Monday, the “Stand with Jensen” letter had more than 160,000 signatures. Epic Games CEO Tim Sweeney, Y Combinator CEO Garry Tan and Uber co-founder Travis Kalanick have also backed it. The letter asks the board to reinstate Huang while an independent investigation establishes the facts.
SILICON VALLEY VS. WHITE HOUSE: BATTLE FOR NVIDIA
Tech executives are pushing to reinstate Jensen Huang, while Treasury Secretary Scott Bessent reportedly opposes his return.
A petition backing Huang has drawn 175,000 signatures.
Yet prediction markets give Huang just an 18%… pic.twitter.com/BZl5KheVnq
— *Walter Bloomberg (@DeItaone) November 16, 2026
We matched Polymarket’s odds of Huang’s return with a 24/7 Nvidia stock contract on Hyperliquid. Musk’s post lifted the odds but barely moved the stock. A sharper jump in the odds on Sunday evening did: the stock rose 3% within two hours, then gave it all back by Monday.
So how is Nvidia’s stock reacting, one day before earnings?
Jensen Huang Petition: Musk, Sweeney and Tan Back His Return
Musk posted on X that “a petition is underway to reinstate Jensen and I’m signing it too.” He had said earlier that hiring Huang would be “an honor.”
The petition is hosted at standwithjensen.com. Signers report their own job titles, and the site does not verify them. More than 7,500 say they work at the company, about 18% of its staff.
Investors are split:
For a return: Altimeter’s Brad Gerstner and Atreides’ Gavin Baker asked the board on Friday to keep “all options on the table, including the potential return of Jensen Huang.”
Against: U.S. Treasury Secretary Scott Bessent said on Sunday that Nvidia needs “a dramatic shake-up.” He wants answers from the board within 10 days.
Skeptics: Wedbush analyst Dan Ives said he sees “no chance Jensen comes back to Nvidia as CEO.”
The company says it is choosing a search firm for the CEO role and has not formally approached any candidates. Chief financial officer Colette Kress runs the company in the meantime.
Market Intelligence: Crypto Analyst Predicts Top Solana Meme Coins to Bid
Nvidia Market Reaction: The Stock Followed the Odds
Nasdaq is shut on weekends, but the stock still trades around the clock as a perpetual contract, a futures-style contract with no expiry date, on Hyperliquid. To see whether the Jensen Huang petition moved the stock, we lined up its hourly price with Polymarket’s odds that Huang rejoins by December 31, 2026.
Musk’s post (Friday, 20:51 UTC): the odds rose from 7.4% to 11.1% within the hour. The contract slipped from $162.82 to $161.92.
Sunday, 19:00 to 21:00 UTC: the odds jumped from 9.6% to 20.1%, and the contract rose 3.2%, from $159.94 to $165.07. The contract traded $98 million in one hour, 32 times its typical weekend hour. We found no single report that set it off.
Monday: the odds eased to 12.3%, and the contract fell to $157.08. That is 3.5% below Friday’s Nasdaq close of $162.85.
Polymarket’s longer bets show how far the Jensen Huang petition still has to go. Traders give Huang a 37.5% chance of rejoining by the end of 2027, but only 5.6% by November 30.
EXPLORE: Elon Musk’s Grok AI Predicts an Explosive Move for Solana Crypto
Nvidia Price Analysis: Earnings Test Under Kress
On the daily chart, Hyperliquid’s NVDA contract trades at $156.93. It sits below its 50-day exponential moving average (EMA), an average that gives recent prices more weight, at $199.26, and its 200-day EMA at $206.42. On Nasdaq, the shares closed Friday at $162.85, down 18.6% since November 4.
Resistance: $166.97, Sunday’s high, then $171.50, Friday’s high.
Support: $156.23, Saturday’s low, then $148.86, the November 12 low and the lowest price of 2026 on this contract.
NVDA 1D chart. Source: Hyperliquid
Outlook Trigger Level to watch Rebound Calm earnings on Tuesday and a daily close above $166.97 $171.50, then $178.37, the November 11 high Holding pattern Daily closes between $156.23 and $166.97 A base while the CEO search runs Sell-off A daily close below $156.23 $148.86, the November 12 low
The Jensen Huang petition has moved the odds more than the stock. Musk’s backing barely shifted the price, and Sunday’s jump faded within a day. Tuesday’s earnings, the first under Kress, are likely to matter more to Nvidia shares than any petition.
Market Intelligence: Crypto Analyst Reveals Upcoming Coinbase Listings
next
The post Musk Joins 160,000 Signers Calling for Jensen Huang’s Nvidia Comeback: How Is NVDA Stock Reacting? appeared first on Coinspeaker.
By Monday, the “Stand with Jensen” letter had more than 160,000 signatures. Epic Games CEO Tim Sweeney, Y Combinator CEO Garry Tan and Uber co-founder Travis Kalanick have also backed it. The letter asks the board to reinstate Huang while an independent investigation establishes the facts.
SILICON VALLEY VS. WHITE HOUSE: BATTLE FOR NVIDIA
Tech executives are pushing to reinstate Jensen Huang, while Treasury Secretary Scott Bessent reportedly opposes his return.
A petition backing Huang has drawn 175,000 signatures.
Yet prediction markets give Huang just an 18%… pic.twitter.com/BZl5KheVnq
— *Walter Bloomberg (@DeItaone) November 16, 2026
We matched Polymarket’s odds of Huang’s return with a 24/7 Nvidia stock contract on Hyperliquid. Musk’s post lifted the odds but barely moved the stock. A sharper jump in the odds on Sunday evening did: the stock rose 3% within two hours, then gave it all back by Monday.
So how is Nvidia’s stock reacting, one day before earnings?
Jensen Huang Petition: Musk, Sweeney and Tan Back His Return
Musk posted on X that “a petition is underway to reinstate Jensen and I’m signing it too.” He had said earlier that hiring Huang would be “an honor.”
The petition is hosted at standwithjensen.com. Signers report their own job titles, and the site does not verify them. More than 7,500 say they work at the company, about 18% of its staff.
Investors are split:
For a return: Altimeter’s Brad Gerstner and Atreides’ Gavin Baker asked the board on Friday to keep “all options on the table, including the potential return of Jensen Huang.”
Against: U.S. Treasury Secretary Scott Bessent said on Sunday that Nvidia needs “a dramatic shake-up.” He wants answers from the board within 10 days.
Skeptics: Wedbush analyst Dan Ives said he sees “no chance Jensen comes back to Nvidia as CEO.”
The company says it is choosing a search firm for the CEO role and has not formally approached any candidates. Chief financial officer Colette Kress runs the company in the meantime.
Market Intelligence: Crypto Analyst Predicts Top Solana Meme Coins to Bid
Nvidia Market Reaction: The Stock Followed the Odds
Nasdaq is shut on weekends, but the stock still trades around the clock as a perpetual contract, a futures-style contract with no expiry date, on Hyperliquid. To see whether the Jensen Huang petition moved the stock, we lined up its hourly price with Polymarket’s odds that Huang rejoins by December 31, 2026.
Musk’s post (Friday, 20:51 UTC): the odds rose from 7.4% to 11.1% within the hour. The contract slipped from $162.82 to $161.92.
Sunday, 19:00 to 21:00 UTC: the odds jumped from 9.6% to 20.1%, and the contract rose 3.2%, from $159.94 to $165.07. The contract traded $98 million in one hour, 32 times its typical weekend hour. We found no single report that set it off.
Monday: the odds eased to 12.3%, and the contract fell to $157.08. That is 3.5% below Friday’s Nasdaq close of $162.85.
Polymarket’s longer bets show how far the Jensen Huang petition still has to go. Traders give Huang a 37.5% chance of rejoining by the end of 2027, but only 5.6% by November 30.
EXPLORE: Elon Musk’s Grok AI Predicts an Explosive Move for Solana Crypto
Nvidia Price Analysis: Earnings Test Under Kress
On the daily chart, Hyperliquid’s NVDA contract trades at $156.93. It sits below its 50-day exponential moving average (EMA), an average that gives recent prices more weight, at $199.26, and its 200-day EMA at $206.42. On Nasdaq, the shares closed Friday at $162.85, down 18.6% since November 4.
Resistance: $166.97, Sunday’s high, then $171.50, Friday’s high.
Support: $156.23, Saturday’s low, then $148.86, the November 12 low and the lowest price of 2026 on this contract.
NVDA 1D chart. Source: Hyperliquid
Outlook Trigger Level to watch Rebound Calm earnings on Tuesday and a daily close above $166.97 $171.50, then $178.37, the November 11 high Holding pattern Daily closes between $156.23 and $166.97 A base while the CEO search runs Sell-off A daily close below $156.23 $148.86, the November 12 low
The Jensen Huang petition has moved the odds more than the stock. Musk’s backing barely shifted the price, and Sunday’s jump faded within a day. Tuesday’s earnings, the first under Kress, are likely to matter more to Nvidia shares than any petition.
Market Intelligence: Crypto Analyst Reveals Upcoming Coinbase Listings
next
The post Musk Joins 160,000 Signers Calling for Jensen Huang’s Nvidia Comeback: How Is NVDA Stock Reacting? appeared first on Coinspeaker.
554
·
--
Article
Elon Musk’s Grok AI Predicts an Explosive Move for Solana CryptoSolana (SOL USD) is trading near $71 in mid-November 2026 after a sharp multi-week decline that has pushed the token to levels not seen in several months. Despite the recent weakness and broader market pressure, Elon Musk’s Grok AI predicts that an over-the-top bullish scenario still leaves room for a powerful recovery by January 1, 2027.
The landmark catalyst unlocking this extreme upside is a highly unlikely but not impossible acceleration of institutional tokenization on Solana.
(SOURCE: Grok AI Predicts an Explosive SOL Crypto Move)
Building on the real announcement that the Depository Trust & Clearing Corporation (DTCC) plans to connect its Tokenization Service to Solana in the second half of 2027, the timeline is dramatically pulled forward and the scope expanded.
In this hypothetical, DTCC and other major traditional-finance infrastructure providers begin routing significant volumes of tokenized equities, Treasuries, and funds onto Solana much earlier than expected, establishing the network as a preferred high-throughput settlement layer for Wall Street-grade assets and driving sustained structural demand for SOL.
Solana Crypto Technical Analysis: Can $70 Support Hold Through November?
SOL has broken lower from the $90–$95 region and is now consolidating near $70–$72 after testing support around $67–$70. The recent decline has produced a clear series of lower highs, with immediate resistance clustered near $78–$82 and a heavier supply zone around the $90–$95 area that previously acted as support.
On the downside, the $65–$68 zone represents the next key demand area. Momentum indicators have moved deep into oversold territory on intermediate timeframes, a condition that has historically preceded sharp relief rallies once forced selling exhausts. In a standard recovery, a sustained weekly close back above $85–$90 would be an important first confirmation that the corrective phase is ending.
Under the extreme institutional-tokenization catalyst outlined above, those intermediate levels would be cleared rapidly, allowing measured-move extensions and multi-cycle projections from the current base to support a far more aggressive upside trajectory.
While the past few weeks have been painful and have tested investor conviction, Solana has repeatedly shown it can rebound strongly when narrative and capital flows align.
The combination of real institutional interest in tokenization, continued ecosystem development, and the theoretical potential for much faster, broader Wall Street adoption creates a setup where a powerful recovery remains possible.
Market Intelligence: Crypto Analyst Predicts Best New Crypto to Hodl
What Recent Catalysts and News for Solana Could Boost the Grok AI Price Prediction?
We are advancing our multi-chain strategy with plans to connect the DTCC Tokenization Service with @solana, expanding network choice for market participants.
DTC-tokenized assets are expected to be available on Solana in the second half of 2027. ➡️ https://t.co/OdWc9KDeQS pic.twitter.com/vLTK1291A3
— Depository Trust & Clearing Corporation (@The_DTCC) November 12, 2026
Even amid the current sell-off, several developments lay the groundwork for longer-term optimism. The DTCC’s formal plan to bring tokenized securities to Solana in 2027 stands out as a meaningful institutional endorsement.
Charles Schwab has added Solana to its spot crypto trading offerings for U.S. clients, expanding mainstream access. Ecosystem activity continues, including new product launches from major Solana protocols, ongoing network upgrades, and the Breakpoint conference bringing together builders, institutions, and policymakers.
These items do not erase near-term price pressure, but they reinforce Solana’s positioning in high-performance DeFi, payments, and now tokenization—areas that could amplify significantly if institutional adoption accelerates.
Grok AI Predicts a Wild SOL USD Move: What is the Final Prediction?
Musk’s Grok AI predicts that, if a specific catalyst lands, Solana could reach between $420 and $550 by January 1, 2027, with a stretch target above $650 in the most aggressive outcome.
This remains pure speculation and entertainment, not a realistic base-case outlook. The catalyst would require extraordinary regulatory progress and execution on robotaxi and Optimus at a scale that is currently highly unlikely.
Market Intelligence: Crypto Analyst Reveals Upcoming Binance Listings
next
The post Elon Musk’s Grok AI Predicts an Explosive Move for Solana Crypto appeared first on Coinspeaker.
Elon Musk’s Grok AI Predicts an Explosive Move for Solana Crypto
Solana (SOL USD) is trading near $71 in mid-November 2026 after a sharp multi-week decline that has pushed the token to levels not seen in several months. Despite the recent weakness and broader market pressure, Elon Musk’s Grok AI predicts that an over-the-top bullish scenario still leaves room for a powerful recovery by January 1, 2027.
The landmark catalyst unlocking this extreme upside is a highly unlikely but not impossible acceleration of institutional tokenization on Solana.
(SOURCE: Grok AI Predicts an Explosive SOL Crypto Move)
Building on the real announcement that the Depository Trust & Clearing Corporation (DTCC) plans to connect its Tokenization Service to Solana in the second half of 2027, the timeline is dramatically pulled forward and the scope expanded.
In this hypothetical, DTCC and other major traditional-finance infrastructure providers begin routing significant volumes of tokenized equities, Treasuries, and funds onto Solana much earlier than expected, establishing the network as a preferred high-throughput settlement layer for Wall Street-grade assets and driving sustained structural demand for SOL.
Solana Crypto Technical Analysis: Can $70 Support Hold Through November?
SOL has broken lower from the $90–$95 region and is now consolidating near $70–$72 after testing support around $67–$70. The recent decline has produced a clear series of lower highs, with immediate resistance clustered near $78–$82 and a heavier supply zone around the $90–$95 area that previously acted as support.
On the downside, the $65–$68 zone represents the next key demand area. Momentum indicators have moved deep into oversold territory on intermediate timeframes, a condition that has historically preceded sharp relief rallies once forced selling exhausts. In a standard recovery, a sustained weekly close back above $85–$90 would be an important first confirmation that the corrective phase is ending.
Under the extreme institutional-tokenization catalyst outlined above, those intermediate levels would be cleared rapidly, allowing measured-move extensions and multi-cycle projections from the current base to support a far more aggressive upside trajectory.
While the past few weeks have been painful and have tested investor conviction, Solana has repeatedly shown it can rebound strongly when narrative and capital flows align.
The combination of real institutional interest in tokenization, continued ecosystem development, and the theoretical potential for much faster, broader Wall Street adoption creates a setup where a powerful recovery remains possible.
Market Intelligence: Crypto Analyst Predicts Best New Crypto to Hodl
What Recent Catalysts and News for Solana Could Boost the Grok AI Price Prediction?
We are advancing our multi-chain strategy with plans to connect the DTCC Tokenization Service with @solana, expanding network choice for market participants.
DTC-tokenized assets are expected to be available on Solana in the second half of 2027. ➡️ https://t.co/OdWc9KDeQS pic.twitter.com/vLTK1291A3
— Depository Trust & Clearing Corporation (@The_DTCC) November 12, 2026
Even amid the current sell-off, several developments lay the groundwork for longer-term optimism. The DTCC’s formal plan to bring tokenized securities to Solana in 2027 stands out as a meaningful institutional endorsement.
Charles Schwab has added Solana to its spot crypto trading offerings for U.S. clients, expanding mainstream access. Ecosystem activity continues, including new product launches from major Solana protocols, ongoing network upgrades, and the Breakpoint conference bringing together builders, institutions, and policymakers.
These items do not erase near-term price pressure, but they reinforce Solana’s positioning in high-performance DeFi, payments, and now tokenization—areas that could amplify significantly if institutional adoption accelerates.
Grok AI Predicts a Wild SOL USD Move: What is the Final Prediction?
Musk’s Grok AI predicts that, if a specific catalyst lands, Solana could reach between $420 and $550 by January 1, 2027, with a stretch target above $650 in the most aggressive outcome.
This remains pure speculation and entertainment, not a realistic base-case outlook. The catalyst would require extraordinary regulatory progress and execution on robotaxi and Optimus at a scale that is currently highly unlikely.
Market Intelligence: Crypto Analyst Reveals Upcoming Binance Listings
next
The post Elon Musk’s Grok AI Predicts an Explosive Move for Solana Crypto appeared first on Coinspeaker.
The landmark catalyst unlocking this extreme upside is a highly unlikely but not impossible acceleration of institutional tokenization on Solana.
(SOURCE: Grok AI Predicts an Explosive SOL Crypto Move)
Building on the real announcement that the Depository Trust & Clearing Corporation (DTCC) plans to connect its Tokenization Service to Solana in the second half of 2027, the timeline is dramatically pulled forward and the scope expanded.
In this hypothetical, DTCC and other major traditional-finance infrastructure providers begin routing significant volumes of tokenized equities, Treasuries, and funds onto Solana much earlier than expected, establishing the network as a preferred high-throughput settlement layer for Wall Street-grade assets and driving sustained structural demand for SOL.
Solana Crypto Technical Analysis: Can $70 Support Hold Through November?
SOL has broken lower from the $90–$95 region and is now consolidating near $70–$72 after testing support around $67–$70. The recent decline has produced a clear series of lower highs, with immediate resistance clustered near $78–$82 and a heavier supply zone around the $90–$95 area that previously acted as support.
On the downside, the $65–$68 zone represents the next key demand area. Momentum indicators have moved deep into oversold territory on intermediate timeframes, a condition that has historically preceded sharp relief rallies once forced selling exhausts. In a standard recovery, a sustained weekly close back above $85–$90 would be an important first confirmation that the corrective phase is ending.
Under the extreme institutional-tokenization catalyst outlined above, those intermediate levels would be cleared rapidly, allowing measured-move extensions and multi-cycle projections from the current base to support a far more aggressive upside trajectory.
While the past few weeks have been painful and have tested investor conviction, Solana has repeatedly shown it can rebound strongly when narrative and capital flows align.
The combination of real institutional interest in tokenization, continued ecosystem development, and the theoretical potential for much faster, broader Wall Street adoption creates a setup where a powerful recovery remains possible.
Market Intelligence: Crypto Analyst Predicts Best New Crypto to Hodl
What Recent Catalysts and News for Solana Could Boost the Grok AI Price Prediction?
We are advancing our multi-chain strategy with plans to connect the DTCC Tokenization Service with @solana, expanding network choice for market participants.
DTC-tokenized assets are expected to be available on Solana in the second half of 2027. ➡️ https://t.co/OdWc9KDeQS pic.twitter.com/vLTK1291A3
— Depository Trust & Clearing Corporation (@The_DTCC) November 12, 2026
Even amid the current sell-off, several developments lay the groundwork for longer-term optimism. The DTCC’s formal plan to bring tokenized securities to Solana in 2027 stands out as a meaningful institutional endorsement.
Charles Schwab has added Solana to its spot crypto trading offerings for U.S. clients, expanding mainstream access. Ecosystem activity continues, including new product launches from major Solana protocols, ongoing network upgrades, and the Breakpoint conference bringing together builders, institutions, and policymakers.
These items do not erase near-term price pressure, but they reinforce Solana’s positioning in high-performance DeFi, payments, and now tokenization—areas that could amplify significantly if institutional adoption accelerates.
Grok AI Predicts a Wild SOL USD Move: What is the Final Prediction?
Musk’s Grok AI predicts that, if a specific catalyst lands, Solana could reach between $420 and $550 by January 1, 2027, with a stretch target above $650 in the most aggressive outcome.
This remains pure speculation and entertainment, not a realistic base-case outlook. The catalyst would require extraordinary regulatory progress and execution on robotaxi and Optimus at a scale that is currently highly unlikely.
Market Intelligence: Crypto Analyst Reveals Upcoming Binance Listings
next
The post Elon Musk’s Grok AI Predicts an Explosive Move for Solana Crypto appeared first on Coinspeaker.
570
·
--
Article
Bitcoin Price Tumbles 19% Ahead of Anthropic IPO: Is SpaceX Crash Repeating?Bitcoin news takes a new turn on Monday, November 16, as BTC trades near $64,700 with just three days to go before Anthropic’s highly anticipated Nasdaq debut under the ticker ANT. The slide looks a lot like the one before SpaceX’s record listing in June.
Anthropic plans to price its IPO on Wednesday, November 18, at $70 to $78 a share, and list on Thursday. At the top of the range, it would raise about $64 billion, the second-largest IPO ever after SpaceX’s $75 billion.
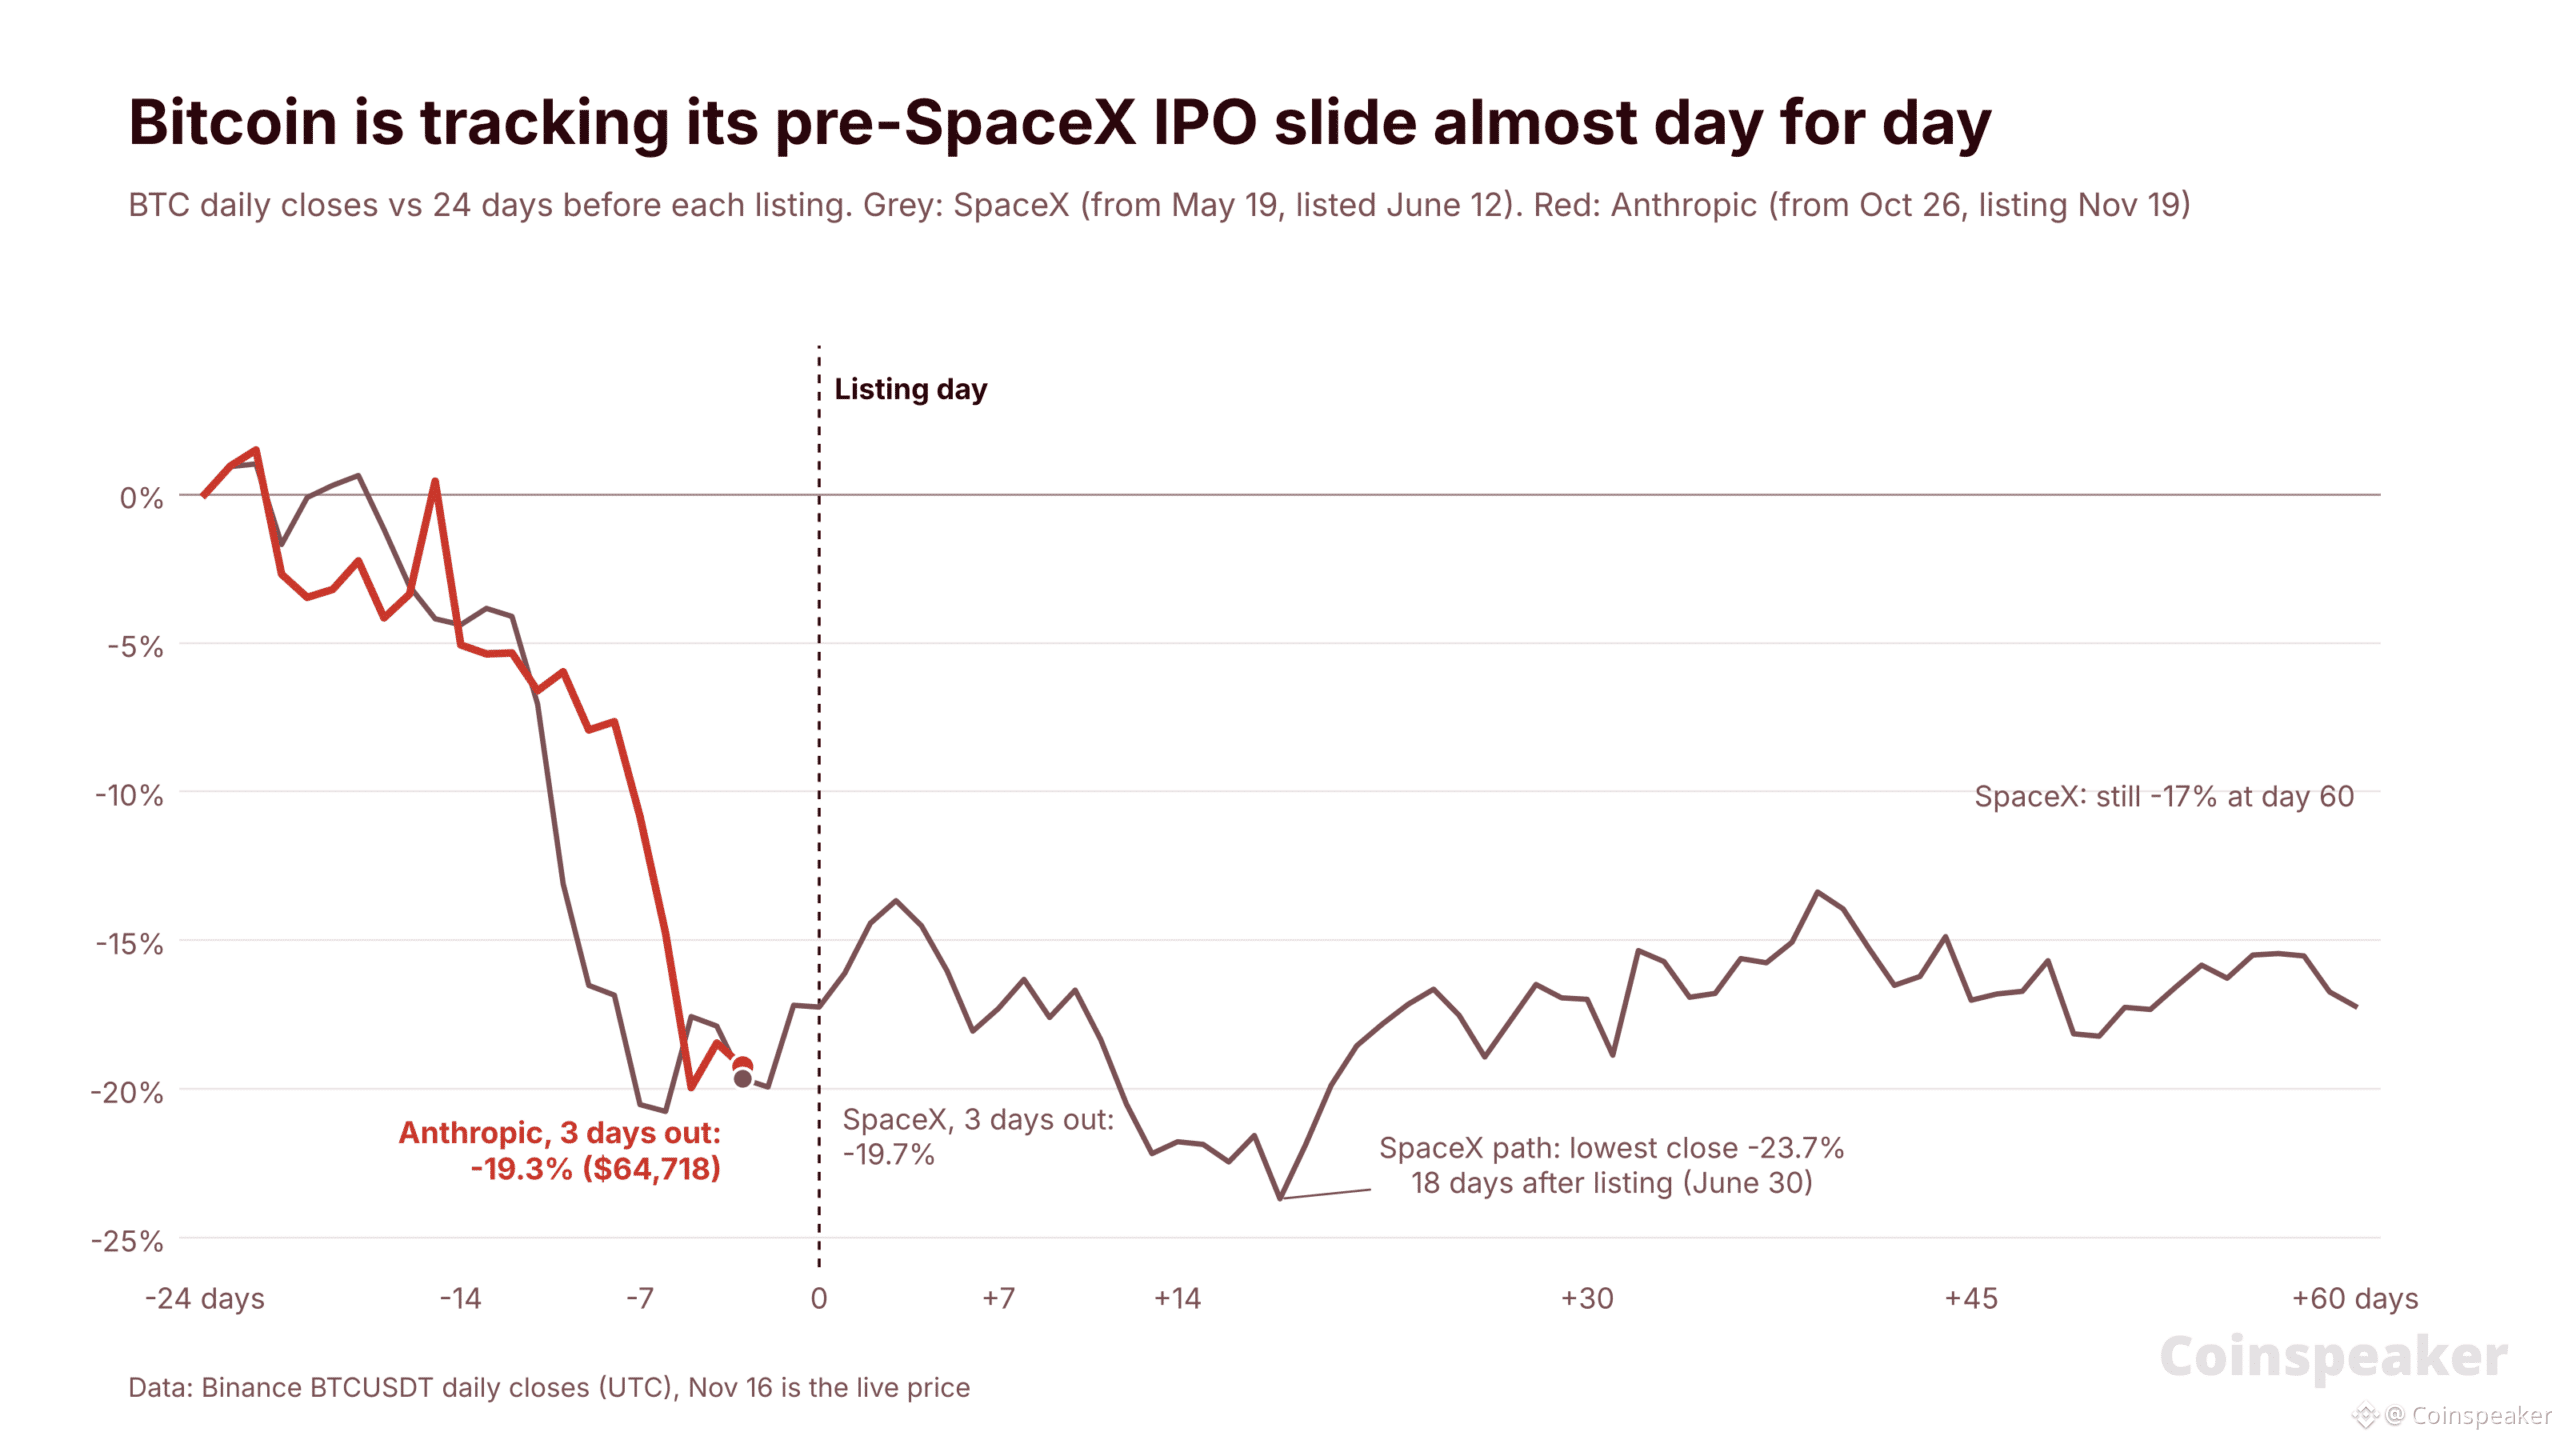
Bitcoin has fallen 19.3% since October 26, about when Anthropic’s filing went public, 24 days before the listing. We lined that up with the same 24 days before SpaceX’s debut on June 12. Three days out, Bitcoin was down 19.7% then and is down 19.3% now.
Bitcoin fell 19% into the biggest IPO ever. Now it's down 18% heading into the second biggest.
SpaceX raised $75B when it went public on June 12. In the 50 days before it listed, Bitcoin dropped 19%. Anthropic plans to raise up to $64B when it lists next week, and Bitcoin is… pic.twitter.com/pRAkGpxr1z
— Matt Cole (@ColeMacro) November 13, 2026
Some traders think giant IPOs pull money out of crypto as investors sell other assets to buy in. Here is what Bitcoin did before, during and after the SpaceX listing, and what that could mean for the Anthropic debut.
Bitcoin News From June: The SpaceX IPO in Three Stages
SpaceX made its filing public on May 20 and set a fixed price of $135 a share on June 1. Nasdaq listed its Class A shares on June 12.
Before the listing, a 20% slide: Bitcoin closed at $77,552 the day the filing went public. It fell 13% in the three days after the price was set, and hit $59,131 on June 5, during the investor roadshow.
Listing week, a short bounce: SpaceX opened at $150 and closed its first day at $160.95, 19% above the IPO price. Bitcoin closed listing day at $63,580 and climbed to $66,329 three days later.
After the listing, a lower low: the bounce faded. Bitcoin’s lowest close came 18 days after the listing, $58,625 on June 30, and the 2026 low of $57,800 followed on July 1. Sixty days out, it was still 17% below its starting point.
The recovery came later. By September 10, 90 days after the listing, Bitcoin was back near where it started, and it reached $87,396 on September 21.
Market Intelligence: Crypto Analyst Predicts Best New Crypto to Hodl
Bitcoin Is Tracking the SpaceX Path Almost Day for Day
For this Bitcoin news analysis, we indexed Bitcoin’s daily closes to 24 days before each listing: May 19 for SpaceX and October 26 for Anthropic. The two lines start and end in almost the same place.
Two weeks out: down 4.4% before SpaceX, 5.1% before Anthropic.
One week out: down 20.5% before SpaceX, 10.8% before Anthropic. This time the sharp drop came a few days later.
Three days out: down 19.7% before SpaceX, 19.3% now.
This time the slide came with its own triggers. Leveraged long traders were forced out on November 13, and Bitcoin hit $62,006 on November 15. The Crypto Fear & Greed Index fell to 10, close to the readings that marked this year’s February and July lows.
EXPLORE: Bitcoin Price Crashes to $72,700 as Leveraged Traders Buy the Dip: Is the Bottom In?
Bitcoin News for the Anthropic IPO: A Bounce, Then a Lower Low?
If Bitcoin follows the SpaceX script, the listing itself would bring a short relief bounce, not the bottom.
Listing week: after SpaceX, Bitcoin rose 4.3% from listing day to its high three days later.
The following weeks: Bitcoin’s lowest close came 18 days after the listing, 7.8% below its listing-day close. The same drop from today’s price would take it to about $59,700 in early December.
The Fed: the Federal Reserve meets on December 9, inside that window.
Two IPOs are not a pattern, and the timing in this Bitcoin news may be a coincidence. Both slides also had other causes, such as forced selling of leveraged bets. Still, the June playbook says the listing day is a poor guide to the bottom.
Bitcoin Price Analysis: The Daily Chart
On the daily chart, where each candle covers one day, Bitcoin trades at $64,560. It sits far below its 50-day exponential moving average (EMA), an average that gives recent prices more weight, at $76,680, and its 200-day EMA at $75,977.
Resistance: $67,568, Friday’s low, which now caps rebounds. Then $70,214, Friday’s PPI high.
Support: $62,006, Sunday’s low. Below that, $59,131, the June low before the SpaceX listing, and $57,800, the 2026 bottom.
BTCUSDT 1D chart. Source: TradingView
Outlook Trigger Level to watch Rebound A listing-week bounce and a daily close above $67,568 $70,214, the PPI high Holding pattern Daily closes between $62,006 and $67,568 A base before the Dec 9 Fed meeting Sell-off A daily close below $62,006 $59,131, then the $57,800 low
Market Intelligence: Crypto Analyst Predicts Next Crypto to Hit 1 Dollar
For readers following Bitcoin news this week, the SpaceX precedent points to a bounce around Thursday’s listing and a retest of the lows later. Whether Bitcoin follows the script depends on how much money the Anthropic deal pulls out of other markets.
next
The post Bitcoin Price Tumbles 19% Ahead of Anthropic IPO: Is SpaceX Crash Repeating? appeared first on Coinspeaker.
Bitcoin Price Tumbles 19% Ahead of Anthropic IPO: Is SpaceX Crash Repeating?
Bitcoin news takes a new turn on Monday, November 16, as BTC trades near $64,700 with just three days to go before Anthropic’s highly anticipated Nasdaq debut under the ticker ANT. The slide looks a lot like the one before SpaceX’s record listing in June.
Anthropic plans to price its IPO on Wednesday, November 18, at $70 to $78 a share, and list on Thursday. At the top of the range, it would raise about $64 billion, the second-largest IPO ever after SpaceX’s $75 billion.
Bitcoin has fallen 19.3% since October 26, about when Anthropic’s filing went public, 24 days before the listing. We lined that up with the same 24 days before SpaceX’s debut on June 12. Three days out, Bitcoin was down 19.7% then and is down 19.3% now.
Bitcoin fell 19% into the biggest IPO ever. Now it's down 18% heading into the second biggest.
SpaceX raised $75B when it went public on June 12. In the 50 days before it listed, Bitcoin dropped 19%. Anthropic plans to raise up to $64B when it lists next week, and Bitcoin is… pic.twitter.com/pRAkGpxr1z
— Matt Cole (@ColeMacro) November 13, 2026
Some traders think giant IPOs pull money out of crypto as investors sell other assets to buy in. Here is what Bitcoin did before, during and after the SpaceX listing, and what that could mean for the Anthropic debut.
Bitcoin News From June: The SpaceX IPO in Three Stages
SpaceX made its filing public on May 20 and set a fixed price of $135 a share on June 1. Nasdaq listed its Class A shares on June 12.
Before the listing, a 20% slide: Bitcoin closed at $77,552 the day the filing went public. It fell 13% in the three days after the price was set, and hit $59,131 on June 5, during the investor roadshow.
Listing week, a short bounce: SpaceX opened at $150 and closed its first day at $160.95, 19% above the IPO price. Bitcoin closed listing day at $63,580 and climbed to $66,329 three days later.
After the listing, a lower low: the bounce faded. Bitcoin’s lowest close came 18 days after the listing, $58,625 on June 30, and the 2026 low of $57,800 followed on July 1. Sixty days out, it was still 17% below its starting point.
The recovery came later. By September 10, 90 days after the listing, Bitcoin was back near where it started, and it reached $87,396 on September 21.
Market Intelligence: Crypto Analyst Predicts Best New Crypto to Hodl
Bitcoin Is Tracking the SpaceX Path Almost Day for Day
For this Bitcoin news analysis, we indexed Bitcoin’s daily closes to 24 days before each listing: May 19 for SpaceX and October 26 for Anthropic. The two lines start and end in almost the same place.
Two weeks out: down 4.4% before SpaceX, 5.1% before Anthropic.
One week out: down 20.5% before SpaceX, 10.8% before Anthropic. This time the sharp drop came a few days later.
Three days out: down 19.7% before SpaceX, 19.3% now.
This time the slide came with its own triggers. Leveraged long traders were forced out on November 13, and Bitcoin hit $62,006 on November 15. The Crypto Fear & Greed Index fell to 10, close to the readings that marked this year’s February and July lows.
EXPLORE: Bitcoin Price Crashes to $72,700 as Leveraged Traders Buy the Dip: Is the Bottom In?
Bitcoin News for the Anthropic IPO: A Bounce, Then a Lower Low?
If Bitcoin follows the SpaceX script, the listing itself would bring a short relief bounce, not the bottom.
Listing week: after SpaceX, Bitcoin rose 4.3% from listing day to its high three days later.
The following weeks: Bitcoin’s lowest close came 18 days after the listing, 7.8% below its listing-day close. The same drop from today’s price would take it to about $59,700 in early December.
The Fed: the Federal Reserve meets on December 9, inside that window.
Two IPOs are not a pattern, and the timing in this Bitcoin news may be a coincidence. Both slides also had other causes, such as forced selling of leveraged bets. Still, the June playbook says the listing day is a poor guide to the bottom.
Bitcoin Price Analysis: The Daily Chart
On the daily chart, where each candle covers one day, Bitcoin trades at $64,560. It sits far below its 50-day exponential moving average (EMA), an average that gives recent prices more weight, at $76,680, and its 200-day EMA at $75,977.
Resistance: $67,568, Friday’s low, which now caps rebounds. Then $70,214, Friday’s PPI high.
Support: $62,006, Sunday’s low. Below that, $59,131, the June low before the SpaceX listing, and $57,800, the 2026 bottom.
BTCUSDT 1D chart. Source: TradingView
Outlook Trigger Level to watch Rebound A listing-week bounce and a daily close above $67,568 $70,214, the PPI high Holding pattern Daily closes between $62,006 and $67,568 A base before the Dec 9 Fed meeting Sell-off A daily close below $62,006 $59,131, then the $57,800 low
Market Intelligence: Crypto Analyst Predicts Next Crypto to Hit 1 Dollar
For readers following Bitcoin news this week, the SpaceX precedent points to a bounce around Thursday’s listing and a retest of the lows later. Whether Bitcoin follows the script depends on how much money the Anthropic deal pulls out of other markets.
next
The post Bitcoin Price Tumbles 19% Ahead of Anthropic IPO: Is SpaceX Crash Repeating? appeared first on Coinspeaker.
Anthropic plans to price its IPO on Wednesday, November 18, at $70 to $78 a share, and list on Thursday. At the top of the range, it would raise about $64 billion, the second-largest IPO ever after SpaceX’s $75 billion.
Bitcoin has fallen 19.3% since October 26, about when Anthropic’s filing went public, 24 days before the listing. We lined that up with the same 24 days before SpaceX’s debut on June 12. Three days out, Bitcoin was down 19.7% then and is down 19.3% now.
Bitcoin fell 19% into the biggest IPO ever. Now it's down 18% heading into the second biggest.
SpaceX raised $75B when it went public on June 12. In the 50 days before it listed, Bitcoin dropped 19%. Anthropic plans to raise up to $64B when it lists next week, and Bitcoin is… pic.twitter.com/pRAkGpxr1z
— Matt Cole (@ColeMacro) November 13, 2026
Some traders think giant IPOs pull money out of crypto as investors sell other assets to buy in. Here is what Bitcoin did before, during and after the SpaceX listing, and what that could mean for the Anthropic debut.
Bitcoin News From June: The SpaceX IPO in Three Stages
SpaceX made its filing public on May 20 and set a fixed price of $135 a share on June 1. Nasdaq listed its Class A shares on June 12.
Before the listing, a 20% slide: Bitcoin closed at $77,552 the day the filing went public. It fell 13% in the three days after the price was set, and hit $59,131 on June 5, during the investor roadshow.
Listing week, a short bounce: SpaceX opened at $150 and closed its first day at $160.95, 19% above the IPO price. Bitcoin closed listing day at $63,580 and climbed to $66,329 three days later.
After the listing, a lower low: the bounce faded. Bitcoin’s lowest close came 18 days after the listing, $58,625 on June 30, and the 2026 low of $57,800 followed on July 1. Sixty days out, it was still 17% below its starting point.
The recovery came later. By September 10, 90 days after the listing, Bitcoin was back near where it started, and it reached $87,396 on September 21.
Market Intelligence: Crypto Analyst Predicts Best New Crypto to Hodl
Bitcoin Is Tracking the SpaceX Path Almost Day for Day
For this Bitcoin news analysis, we indexed Bitcoin’s daily closes to 24 days before each listing: May 19 for SpaceX and October 26 for Anthropic. The two lines start and end in almost the same place.
Two weeks out: down 4.4% before SpaceX, 5.1% before Anthropic.
One week out: down 20.5% before SpaceX, 10.8% before Anthropic. This time the sharp drop came a few days later.
Three days out: down 19.7% before SpaceX, 19.3% now.
This time the slide came with its own triggers. Leveraged long traders were forced out on November 13, and Bitcoin hit $62,006 on November 15. The Crypto Fear & Greed Index fell to 10, close to the readings that marked this year’s February and July lows.
EXPLORE: Bitcoin Price Crashes to $72,700 as Leveraged Traders Buy the Dip: Is the Bottom In?
Bitcoin News for the Anthropic IPO: A Bounce, Then a Lower Low?
If Bitcoin follows the SpaceX script, the listing itself would bring a short relief bounce, not the bottom.
Listing week: after SpaceX, Bitcoin rose 4.3% from listing day to its high three days later.
The following weeks: Bitcoin’s lowest close came 18 days after the listing, 7.8% below its listing-day close. The same drop from today’s price would take it to about $59,700 in early December.
The Fed: the Federal Reserve meets on December 9, inside that window.
Two IPOs are not a pattern, and the timing in this Bitcoin news may be a coincidence. Both slides also had other causes, such as forced selling of leveraged bets. Still, the June playbook says the listing day is a poor guide to the bottom.
Bitcoin Price Analysis: The Daily Chart
On the daily chart, where each candle covers one day, Bitcoin trades at $64,560. It sits far below its 50-day exponential moving average (EMA), an average that gives recent prices more weight, at $76,680, and its 200-day EMA at $75,977.
Resistance: $67,568, Friday’s low, which now caps rebounds. Then $70,214, Friday’s PPI high.
Support: $62,006, Sunday’s low. Below that, $59,131, the June low before the SpaceX listing, and $57,800, the 2026 bottom.
BTCUSDT 1D chart. Source: TradingView
Outlook Trigger Level to watch Rebound A listing-week bounce and a daily close above $67,568 $70,214, the PPI high Holding pattern Daily closes between $62,006 and $67,568 A base before the Dec 9 Fed meeting Sell-off A daily close below $62,006 $59,131, then the $57,800 low
Market Intelligence: Crypto Analyst Predicts Next Crypto to Hit 1 Dollar
For readers following Bitcoin news this week, the SpaceX precedent points to a bounce around Thursday’s listing and a retest of the lows later. Whether Bitcoin follows the script depends on how much money the Anthropic deal pulls out of other markets.
next
The post Bitcoin Price Tumbles 19% Ahead of Anthropic IPO: Is SpaceX Crash Repeating? appeared first on Coinspeaker.
421
·
--

Article
Perplexity AI Predicts a Monster Move for Saylor’s MicroStrategyMichael Saylor’s Strategy (formerly MicroStrategy) ended the week on the a sour note. MSTR stock fell about 13.4% over the past five days, slipping to around $111.60. That follows a rough six months, when MSTR had dropped -37.3%. Perplexity AI predicts where MSTR stock will go over the next few months, and it may surprise some given the current bearish landscape across crypto and tech stocks.
The latest headlines mostly focus on capital management. Q3 earnings landed on 29 October, and EPS of $44.75 beat the $21.50 consensus, though revenue of $125.4M missed. The profit is mainly a mark-to-market Bitcoin gain. Last week’s filing was more unusual.
The company sold about 2.05 million shares of MSTR, generating net proceeds of $283.8M. Of this amount, the company allocated only $81.9M to purchasing Bitcoin (BTC), while using $188.3M to repurchase its preferred stock (STRC).
The company currently holds 850,364 BTC, with an average acquisition cost of $75,456 per coin. Bitcoin is currently trading just above $64,000 after a tragic -14% weekly crash, now leaving Saylor underwater.
MSTR Technical Analysis: Can Strategy Remain Bullish as Bitcoin Crashes to $64,000?
(SOURCE: Yahoo Finance)
The short-term outlook for MSTR is weak. The stock is currently trading below all four major exponential moving averages (EMAs), with the daily Relative Strength Index (RSI) near 41, indicating soft momentum. Additionally, other metrics show a negative Moving Average Convergence Divergence (MACD).
The 200-day moving average, which is around $133, has provided support so far, but the stock is below its 20-day average ($139) and 50-day average ($149). The key levels to watch are as follows:
– If the stock fails to hold above $110, the next support level is at $102. – Over the past six months, support has been found near $87. – Resistance is located between $126 and $130, which is the first major hurdle where the moving averages converge. – Should the stock break above this resistance, the next level to watch is around $186.
The overall trend remains bearish until MSTR can reclaim the $136–140 range on a closing basis. If support at $110 fails, it could open the door to lower price levels.
Market Intelligence: Crypto Analyst Reveals Upcoming Binance Listings
Perplexity AI Predicts Saylor’s Strategy (MSTR): How Bullish is Anthropic on Saylor’s Strategy?
$MSTR currently holds $4.92B in USD. IMO, they should smash-buy $3B worth of $BTC at $64K. That would add another 46,875 BTC to the stack while still leaving almost $2B in cash on the balance sheet. Let’s push towards 900,000 BTC next week! 🚀@Saylor
— Documenting Strategy (@strategydocs) November 14, 2026
While the market is currently in turmoil, the bullish case for MicroStrategy (MSTR) relies on a Bitcoin recovery, as the company has acted like a leveraged bet on the cryptocurrency. CEO Michael Saylor believes “we’re at the beginning of the next Bitcoin bull market,” citing renewed institutional demand and Bitcoin’s current price, about 6% above its 200-week moving average.
If this trend persists, several catalysts could emerge. Bitcoin is currently down approximately 49% from its all-time high, while MicroStrategy’s Bitcoin holdings have increased by about one-third. A rebound toward six figures for Bitcoin would significantly impact MSTR’s share price, given the substantial size of its holdings relative to its market value.
Moreover, the company’s net leverage has decreased from 8.4% in Q2 to 2.4%. Management has stated that Bitcoin could fall by 78% before the company’s liabilities are no longer covered. The $4.77Bn reserve can cover preferred dividends, alleviating concerns about forced selling. Additionally, buying back its stock below par could enhance Bitcoin’s per-share value.
MicroStrategy also has an unused $1Bn authorization for common stock buybacks. If the company reports several quarters of significant GAAP profits, it may reignite discussions about its eligibility for inclusion in the S&P 500, although this remains speculative.
In a bullish scenario, Perplexity AI predicts MSTR could first reclaim prices in the $136–$140 range and then potentially reach the 200-day moving average by year-end. Strong momentum in Bitcoin could drive MSTR’s stock price toward the $170–$196 resistance band in the first half of 2027.
Analyst targets, such as BTIG’s $250 estimate, would require Bitcoin to reach new highs. However, genuine risks remain: continued share issuance could dilute existing shareholders, and a continued drop in Bitcoin’s price below the approximately $75,000 cost basis could rapidly diminish market sentiment.
Market Intelligence: Crypto Analyst Predicts Best New Crypto to Hodl
next
The post Perplexity AI Predicts a Monster Move for Saylor’s MicroStrategy appeared first on Coinspeaker.
Perplexity AI Predicts a Monster Move for Saylor’s MicroStrategy
Michael Saylor’s Strategy (formerly MicroStrategy) ended the week on the a sour note. MSTR stock fell about 13.4% over the past five days, slipping to around $111.60. That follows a rough six months, when MSTR had dropped -37.3%. Perplexity AI predicts where MSTR stock will go over the next few months, and it may surprise some given the current bearish landscape across crypto and tech stocks.
The latest headlines mostly focus on capital management. Q3 earnings landed on 29 October, and EPS of $44.75 beat the $21.50 consensus, though revenue of $125.4M missed. The profit is mainly a mark-to-market Bitcoin gain. Last week’s filing was more unusual.
The company sold about 2.05 million shares of MSTR, generating net proceeds of $283.8M. Of this amount, the company allocated only $81.9M to purchasing Bitcoin (BTC), while using $188.3M to repurchase its preferred stock (STRC).
The company currently holds 850,364 BTC, with an average acquisition cost of $75,456 per coin. Bitcoin is currently trading just above $64,000 after a tragic -14% weekly crash, now leaving Saylor underwater.
MSTR Technical Analysis: Can Strategy Remain Bullish as Bitcoin Crashes to $64,000?
(SOURCE: Yahoo Finance)
The short-term outlook for MSTR is weak. The stock is currently trading below all four major exponential moving averages (EMAs), with the daily Relative Strength Index (RSI) near 41, indicating soft momentum. Additionally, other metrics show a negative Moving Average Convergence Divergence (MACD).
The 200-day moving average, which is around $133, has provided support so far, but the stock is below its 20-day average ($139) and 50-day average ($149). The key levels to watch are as follows:
– If the stock fails to hold above $110, the next support level is at $102. – Over the past six months, support has been found near $87. – Resistance is located between $126 and $130, which is the first major hurdle where the moving averages converge. – Should the stock break above this resistance, the next level to watch is around $186.
The overall trend remains bearish until MSTR can reclaim the $136–140 range on a closing basis. If support at $110 fails, it could open the door to lower price levels.
Market Intelligence: Crypto Analyst Reveals Upcoming Binance Listings
Perplexity AI Predicts Saylor’s Strategy (MSTR): How Bullish is Anthropic on Saylor’s Strategy?
$MSTR currently holds $4.92B in USD. IMO, they should smash-buy $3B worth of $BTC at $64K. That would add another 46,875 BTC to the stack while still leaving almost $2B in cash on the balance sheet. Let’s push towards 900,000 BTC next week! 🚀@Saylor
— Documenting Strategy (@strategydocs) November 14, 2026
While the market is currently in turmoil, the bullish case for MicroStrategy (MSTR) relies on a Bitcoin recovery, as the company has acted like a leveraged bet on the cryptocurrency. CEO Michael Saylor believes “we’re at the beginning of the next Bitcoin bull market,” citing renewed institutional demand and Bitcoin’s current price, about 6% above its 200-week moving average.
If this trend persists, several catalysts could emerge. Bitcoin is currently down approximately 49% from its all-time high, while MicroStrategy’s Bitcoin holdings have increased by about one-third. A rebound toward six figures for Bitcoin would significantly impact MSTR’s share price, given the substantial size of its holdings relative to its market value.
Moreover, the company’s net leverage has decreased from 8.4% in Q2 to 2.4%. Management has stated that Bitcoin could fall by 78% before the company’s liabilities are no longer covered. The $4.77Bn reserve can cover preferred dividends, alleviating concerns about forced selling. Additionally, buying back its stock below par could enhance Bitcoin’s per-share value.
MicroStrategy also has an unused $1Bn authorization for common stock buybacks. If the company reports several quarters of significant GAAP profits, it may reignite discussions about its eligibility for inclusion in the S&P 500, although this remains speculative.
In a bullish scenario, Perplexity AI predicts MSTR could first reclaim prices in the $136–$140 range and then potentially reach the 200-day moving average by year-end. Strong momentum in Bitcoin could drive MSTR’s stock price toward the $170–$196 resistance band in the first half of 2027.
Analyst targets, such as BTIG’s $250 estimate, would require Bitcoin to reach new highs. However, genuine risks remain: continued share issuance could dilute existing shareholders, and a continued drop in Bitcoin’s price below the approximately $75,000 cost basis could rapidly diminish market sentiment.
Market Intelligence: Crypto Analyst Predicts Best New Crypto to Hodl
next
The post Perplexity AI Predicts a Monster Move for Saylor’s MicroStrategy appeared first on Coinspeaker.
The latest headlines mostly focus on capital management. Q3 earnings landed on 29 October, and EPS of $44.75 beat the $21.50 consensus, though revenue of $125.4M missed. The profit is mainly a mark-to-market Bitcoin gain. Last week’s filing was more unusual.
The company sold about 2.05 million shares of MSTR, generating net proceeds of $283.8M. Of this amount, the company allocated only $81.9M to purchasing Bitcoin (BTC), while using $188.3M to repurchase its preferred stock (STRC).
The company currently holds 850,364 BTC, with an average acquisition cost of $75,456 per coin. Bitcoin is currently trading just above $64,000 after a tragic -14% weekly crash, now leaving Saylor underwater.
MSTR Technical Analysis: Can Strategy Remain Bullish as Bitcoin Crashes to $64,000?
(SOURCE: Yahoo Finance)
The short-term outlook for MSTR is weak. The stock is currently trading below all four major exponential moving averages (EMAs), with the daily Relative Strength Index (RSI) near 41, indicating soft momentum. Additionally, other metrics show a negative Moving Average Convergence Divergence (MACD).
The 200-day moving average, which is around $133, has provided support so far, but the stock is below its 20-day average ($139) and 50-day average ($149). The key levels to watch are as follows:
– If the stock fails to hold above $110, the next support level is at $102. – Over the past six months, support has been found near $87. – Resistance is located between $126 and $130, which is the first major hurdle where the moving averages converge. – Should the stock break above this resistance, the next level to watch is around $186.
The overall trend remains bearish until MSTR can reclaim the $136–140 range on a closing basis. If support at $110 fails, it could open the door to lower price levels.
Market Intelligence: Crypto Analyst Reveals Upcoming Binance Listings
Perplexity AI Predicts Saylor’s Strategy (MSTR): How Bullish is Anthropic on Saylor’s Strategy?
$MSTR currently holds $4.92B in USD. IMO, they should smash-buy $3B worth of $BTC at $64K. That would add another 46,875 BTC to the stack while still leaving almost $2B in cash on the balance sheet. Let’s push towards 900,000 BTC next week! 🚀@Saylor
— Documenting Strategy (@strategydocs) November 14, 2026
While the market is currently in turmoil, the bullish case for MicroStrategy (MSTR) relies on a Bitcoin recovery, as the company has acted like a leveraged bet on the cryptocurrency. CEO Michael Saylor believes “we’re at the beginning of the next Bitcoin bull market,” citing renewed institutional demand and Bitcoin’s current price, about 6% above its 200-week moving average.
If this trend persists, several catalysts could emerge. Bitcoin is currently down approximately 49% from its all-time high, while MicroStrategy’s Bitcoin holdings have increased by about one-third. A rebound toward six figures for Bitcoin would significantly impact MSTR’s share price, given the substantial size of its holdings relative to its market value.
Moreover, the company’s net leverage has decreased from 8.4% in Q2 to 2.4%. Management has stated that Bitcoin could fall by 78% before the company’s liabilities are no longer covered. The $4.77Bn reserve can cover preferred dividends, alleviating concerns about forced selling. Additionally, buying back its stock below par could enhance Bitcoin’s per-share value.
MicroStrategy also has an unused $1Bn authorization for common stock buybacks. If the company reports several quarters of significant GAAP profits, it may reignite discussions about its eligibility for inclusion in the S&P 500, although this remains speculative.
In a bullish scenario, Perplexity AI predicts MSTR could first reclaim prices in the $136–$140 range and then potentially reach the 200-day moving average by year-end. Strong momentum in Bitcoin could drive MSTR’s stock price toward the $170–$196 resistance band in the first half of 2027.
Analyst targets, such as BTIG’s $250 estimate, would require Bitcoin to reach new highs. However, genuine risks remain: continued share issuance could dilute existing shareholders, and a continued drop in Bitcoin’s price below the approximately $75,000 cost basis could rapidly diminish market sentiment.
Market Intelligence: Crypto Analyst Predicts Best New Crypto to Hodl
next
The post Perplexity AI Predicts a Monster Move for Saylor’s MicroStrategy appeared first on Coinspeaker.
206
·
--
Article
Anthropic’s Claude AI Predicts a Euphoric Move for Cardano (ADA)Cardano is trading near $0.15 today, down -5.8% overnight amid broader market weakness. In an over-the-top bullish scenario, Claude AI predicts that ADA could stage one of the more dramatic recoveries among large-cap Layer-1s by January 1, 2027.
The landmark catalyst driving this extreme upside is a highly unlikely but not impossible supercharged outcome of Cardano’s real progress on regulated assets.
(SOURCE: Claude AI Predicts a Huge ADA Rally is on the Way)
Building on the recent mainnet launch of CIP-0113 (the programmable token standard that allows issuers to embed transfer restrictions, identity checks, and compliance rules directly into assets), a major international consortium of banks, asset managers, and a key regulatory body formally designates Cardano as a preferred settlement layer for large-scale tokenized real-world assets and regulated securities.
In this hypothetical, the network becomes the default rail for a significant portion of institutional RWA issuance, creating sustained demand for ADA as the native gas and collateral token and triggering a wave of treasury accumulation and ecosystem inflows.
Anthropic Claude AI Predicts a Huge Cardano Move: Does the Technical Analysis Agree?
(SOURCE: TradingView)
ADA has been under steady pressure, sliding from levels near $0.18–$0.20 earlier in the month into the mid-$0.14s before stabilizing around $0.15.
The chart shows a series of lower highs, with key support now resting in the $0.14–$0.145 zone and stronger demand potentially waiting near $0.12–$0.13 if selling resumes.
Resistance sits at $0.17–$0.18 and then the more significant $0.22–$0.25 area. Momentum indicators remain weak after the recent decline, leaving substantial room for a reversal if buying interest returns.
In a conventional recovery, a sustained break above $0.18–$0.20 would be needed to shift the structure higher and open a path toward $0.30–$0.40.
Under the extreme institutional RWA-adoption catalyst outlined above, those intermediate levels would be cleared rapidly, allowing multi-cycle measured moves and Fibonacci extensions from the current multi-month base to project far higher
While present price action reflects broader risk-off conditions and limited near-term catalysts, the combination of Cardano’s regulated-asset tooling and the theoretical potential for large-scale institutional selection creates a setup from which a parabolic move remains possible in a strong risk-on environment.
Market Intelligence: Crypto Analyst Reveals Upcoming Binance Listings
Cardano Recent News and Announcements Roundup
A big October for Cardano.
CIP-0113 programmable tokens went live on mainnet.@VeridianID became an independent company.
2,000+ people visited the Cardano booth at @token2049 Singapore.@FireblocksHQ confirmed it will offer custody for Cardano native tokens.
And much more,… pic.twitter.com/yJ9eLN3HzQ
— Cardano Foundation (@Cardano_CF) November 14, 2026
Several developments provide a foundation for this scenario. The Cardano Foundation confirmed that CIP-0113 went live on mainnet in October, enabling programmable compliance features for tokenized assets.
The Foundation’s application for the .ada top-level domain advanced further in the ICANN process. Midnight, Cardano’s privacy-focused partner chain, shipped Ledger 9 with enhanced private transfer capabilities.
Development updates continue on scaling Leios (via DijkstraNet) to support higher throughput. On the real-world side, Cardano has been used in India’s Uttar Pradesh police forensic evidence system, with discussions of broader expansion.
These items keep Cardano in conversations around institutional readiness, regulated assets, and governance maturation even while price action remains subdued.
Claude AI Predicts an ADA Boom: How Could It Go?
Anthropic’s Claude AI predicts ADA could reach between $4.50 and $7.00 by January 1, 2027, with a stretch target above $9 in the most aggressive outcome.
This is deliberately aggressive and highly speculative. The catalyst would require a fundamental change in how global markets operate, something that remains a long shot.
Market Intelligence: Crypto Analyst Predicts Best New Crypto to Hodlnext
The post Anthropic’s Claude AI Predicts a Euphoric Move for Cardano (ADA) appeared first on Coinspeaker.
Anthropic’s Claude AI Predicts a Euphoric Move for Cardano (ADA)
Cardano is trading near $0.15 today, down -5.8% overnight amid broader market weakness. In an over-the-top bullish scenario, Claude AI predicts that ADA could stage one of the more dramatic recoveries among large-cap Layer-1s by January 1, 2027.
The landmark catalyst driving this extreme upside is a highly unlikely but not impossible supercharged outcome of Cardano’s real progress on regulated assets.
(SOURCE: Claude AI Predicts a Huge ADA Rally is on the Way)
Building on the recent mainnet launch of CIP-0113 (the programmable token standard that allows issuers to embed transfer restrictions, identity checks, and compliance rules directly into assets), a major international consortium of banks, asset managers, and a key regulatory body formally designates Cardano as a preferred settlement layer for large-scale tokenized real-world assets and regulated securities.
In this hypothetical, the network becomes the default rail for a significant portion of institutional RWA issuance, creating sustained demand for ADA as the native gas and collateral token and triggering a wave of treasury accumulation and ecosystem inflows.
Anthropic Claude AI Predicts a Huge Cardano Move: Does the Technical Analysis Agree?
(SOURCE: TradingView)
ADA has been under steady pressure, sliding from levels near $0.18–$0.20 earlier in the month into the mid-$0.14s before stabilizing around $0.15.
The chart shows a series of lower highs, with key support now resting in the $0.14–$0.145 zone and stronger demand potentially waiting near $0.12–$0.13 if selling resumes.
Resistance sits at $0.17–$0.18 and then the more significant $0.22–$0.25 area. Momentum indicators remain weak after the recent decline, leaving substantial room for a reversal if buying interest returns.
In a conventional recovery, a sustained break above $0.18–$0.20 would be needed to shift the structure higher and open a path toward $0.30–$0.40.
Under the extreme institutional RWA-adoption catalyst outlined above, those intermediate levels would be cleared rapidly, allowing multi-cycle measured moves and Fibonacci extensions from the current multi-month base to project far higher
While present price action reflects broader risk-off conditions and limited near-term catalysts, the combination of Cardano’s regulated-asset tooling and the theoretical potential for large-scale institutional selection creates a setup from which a parabolic move remains possible in a strong risk-on environment.
Market Intelligence: Crypto Analyst Reveals Upcoming Binance Listings
Cardano Recent News and Announcements Roundup
A big October for Cardano.
CIP-0113 programmable tokens went live on mainnet.@VeridianID became an independent company.
2,000+ people visited the Cardano booth at @token2049 Singapore.@FireblocksHQ confirmed it will offer custody for Cardano native tokens.
And much more,… pic.twitter.com/yJ9eLN3HzQ
— Cardano Foundation (@Cardano_CF) November 14, 2026
Several developments provide a foundation for this scenario. The Cardano Foundation confirmed that CIP-0113 went live on mainnet in October, enabling programmable compliance features for tokenized assets.
The Foundation’s application for the .ada top-level domain advanced further in the ICANN process. Midnight, Cardano’s privacy-focused partner chain, shipped Ledger 9 with enhanced private transfer capabilities.
Development updates continue on scaling Leios (via DijkstraNet) to support higher throughput. On the real-world side, Cardano has been used in India’s Uttar Pradesh police forensic evidence system, with discussions of broader expansion.
These items keep Cardano in conversations around institutional readiness, regulated assets, and governance maturation even while price action remains subdued.
Claude AI Predicts an ADA Boom: How Could It Go?
Anthropic’s Claude AI predicts ADA could reach between $4.50 and $7.00 by January 1, 2027, with a stretch target above $9 in the most aggressive outcome.
This is deliberately aggressive and highly speculative. The catalyst would require a fundamental change in how global markets operate, something that remains a long shot.
Market Intelligence: Crypto Analyst Predicts Best New Crypto to Hodlnext
The post Anthropic’s Claude AI Predicts a Euphoric Move for Cardano (ADA) appeared first on Coinspeaker.
The landmark catalyst driving this extreme upside is a highly unlikely but not impossible supercharged outcome of Cardano’s real progress on regulated assets.
(SOURCE: Claude AI Predicts a Huge ADA Rally is on the Way)
Building on the recent mainnet launch of CIP-0113 (the programmable token standard that allows issuers to embed transfer restrictions, identity checks, and compliance rules directly into assets), a major international consortium of banks, asset managers, and a key regulatory body formally designates Cardano as a preferred settlement layer for large-scale tokenized real-world assets and regulated securities.
In this hypothetical, the network becomes the default rail for a significant portion of institutional RWA issuance, creating sustained demand for ADA as the native gas and collateral token and triggering a wave of treasury accumulation and ecosystem inflows.
Anthropic Claude AI Predicts a Huge Cardano Move: Does the Technical Analysis Agree?
(SOURCE: TradingView)
ADA has been under steady pressure, sliding from levels near $0.18–$0.20 earlier in the month into the mid-$0.14s before stabilizing around $0.15.
The chart shows a series of lower highs, with key support now resting in the $0.14–$0.145 zone and stronger demand potentially waiting near $0.12–$0.13 if selling resumes.
Resistance sits at $0.17–$0.18 and then the more significant $0.22–$0.25 area. Momentum indicators remain weak after the recent decline, leaving substantial room for a reversal if buying interest returns.
In a conventional recovery, a sustained break above $0.18–$0.20 would be needed to shift the structure higher and open a path toward $0.30–$0.40.
Under the extreme institutional RWA-adoption catalyst outlined above, those intermediate levels would be cleared rapidly, allowing multi-cycle measured moves and Fibonacci extensions from the current multi-month base to project far higher
While present price action reflects broader risk-off conditions and limited near-term catalysts, the combination of Cardano’s regulated-asset tooling and the theoretical potential for large-scale institutional selection creates a setup from which a parabolic move remains possible in a strong risk-on environment.
Market Intelligence: Crypto Analyst Reveals Upcoming Binance Listings
Cardano Recent News and Announcements Roundup
A big October for Cardano.
CIP-0113 programmable tokens went live on mainnet.@VeridianID became an independent company.
2,000+ people visited the Cardano booth at @token2049 Singapore.@FireblocksHQ confirmed it will offer custody for Cardano native tokens.
And much more,… pic.twitter.com/yJ9eLN3HzQ
— Cardano Foundation (@Cardano_CF) November 14, 2026
Several developments provide a foundation for this scenario. The Cardano Foundation confirmed that CIP-0113 went live on mainnet in October, enabling programmable compliance features for tokenized assets.
The Foundation’s application for the .ada top-level domain advanced further in the ICANN process. Midnight, Cardano’s privacy-focused partner chain, shipped Ledger 9 with enhanced private transfer capabilities.
Development updates continue on scaling Leios (via DijkstraNet) to support higher throughput. On the real-world side, Cardano has been used in India’s Uttar Pradesh police forensic evidence system, with discussions of broader expansion.
These items keep Cardano in conversations around institutional readiness, regulated assets, and governance maturation even while price action remains subdued.
Claude AI Predicts an ADA Boom: How Could It Go?
Anthropic’s Claude AI predicts ADA could reach between $4.50 and $7.00 by January 1, 2027, with a stretch target above $9 in the most aggressive outcome.
This is deliberately aggressive and highly speculative. The catalyst would require a fundamental change in how global markets operate, something that remains a long shot.
Market Intelligence: Crypto Analyst Predicts Best New Crypto to Hodlnext
The post Anthropic’s Claude AI Predicts a Euphoric Move for Cardano (ADA) appeared first on Coinspeaker.
1
1.2k
·
--

Article
Bitcoin Demand Dries Up As Miners Prepare to Dump 2,077 BTC: Is More Selling Pressure Coming for ...Bitcoin (BTC) demand is showing signs of weakness as miners move more coins to cryptocurrency exchanges. CryptoQuant recorded 2,077 BTC in miner-to-exchange transfers on November 10, approximately 16 times the 30-day daily average of 127 BTC. The move comes as Bitcoin struggles to regain momentum and the network approaches an estimated 8% reduction in mining difficulty.
The latest figures raise concerns about potential selling pressure, particularly as demand indicators weaken across spot and derivatives markets.
Meanwhile, miners could soon receive some relief from lower network difficulty.
Bitcoin's Rebound Fades as Spot Demand Weakens and Miner Flows Surge
“Leverage is being unwound, but spot demand has not recovered sustainably.” – By @xwinfinance pic.twitter.com/n03axjQKqt
— CryptoQuant.com (@cryptoquant_com) November 13, 2026
Explore: Bitcoin Price Crashes Below $69,000: Is the Worst Still to Come?
Antpool Sends 2,077 BTC to Exchanges in Biggest Miner Transfer Since February
Bitcoin Miner Flows
The 2,077 BTC transfer marked the largest daily miner-to-exchange movement since February 2026, according to CryptoQuant. Around 97% of the transferred Bitcoin came from Antpool, one of the network’s largest mining pools.
The movement represents a significant increase compared with the 30-day average of 127 BTC. Miners often transfer Bitcoin to exchanges when they need to liquidate holdings to cover electricity bills, equipment costs and other operating expenses.
However, CryptoQuant’s Miner to Exchange Flow indicator tracks transfers rather than completed sales. Miners can also move coins for treasury management or other operational reasons.
The latest activity therefore signals a potential increase in available selling supply, rather than confirmation that 2,077 BTC entered the market as sell orders.
Bitcoin Demand Dries Up as Spot Buyers Retreat and Futures Selling Intensifies
Miner transfers are adding to concerns about an already fragile market. CryptoQuant’s 30-day demand-growth indicators showed negative readings across both spot and perpetual futures markets.
Spot demand stood at approximately -280,000 BTC, while perpetual futures demand reached around -82,000 BTC. Combined, the indicators produced a negative reading of approximately 362,000 BTC.
These figures point to deteriorating demand conditions. Spot demand is particularly important because it reflects activity in the underlying Bitcoin market, while perpetual futures activity provides insight into speculative positioning.
The negative readings suggest that buying activity has struggled to absorb available supply. If miners continue transferring Bitcoin to exchanges while spot demand remains weak, the market could face additional downward pressure.
However, these indicators measure changes in estimated demand, not a direct count of Bitcoin sold by investors.
Market Intelligence: Crypto Analyst Predicts Best New Crypto to Hodl
Bitcoin’s next difficulty adjustment, expected around 14 November at block 975,744, may drop by roughly 8.4% after average block times rose to 655 seconds. The protocol reduces difficulty every 2,016 blocks (about two weeks) to maintain a 10-minute target; slower production eases mining and may boost BTC yield per unit of power.
This could aid miners amid weak prices and tight margins, but profitability still depends on electricity costs, hardware efficiency, fees and BTC value.
What Comes Next for Bitcoin? $69,000 Level Is Under Pressure
BTCUSDT Chart 1D Source: TradingView
Bitcoin is trading near $69,200 after another sharp daily decline. The chart shows that BTC has broken below the $75,000–$76,000 support zone, which now represents an important resistance area. The immediate level to watch is around $69,000.
A sustained break below it could expose the $64,000–$65,000 support area, followed by $60,000. On the upside, Bitcoin would need to reclaim $75,000 to signal a potential recovery and improve its short-term outlook.
Bitcoin faces several challenges heading into the next difficulty adjustment. The increase in miner-to-exchange transfers, combined with negative demand indicators, suggests that the market is struggling to attract sufficient buying interest.
Still, the Antpool transfers should not be interpreted as proof of widespread miner capitulation. The data identifies a large movement from one mining pool, but does not establish that the coins were sold.
The upcoming difficulty reduction could improve mining conditions and help struggling operators manage their costs. However, it is unlikely to resolve the broader weakness in Bitcoin demand.
Investors will be watching whether exchange transfers translate into actual selling and whether spot-market buyers return. A recovery in demand would help absorb additional supply and provide a stronger foundation for Bitcoin’s next move.
Market Intelligence: Crypto Analyst Reveals Upcoming Binance Listings
next
The post Bitcoin Demand Dries Up as Miners Prepare to Dump 2,077 BTC: Is More Selling Pressure Coming for BTC? appeared first on Coinspeaker.
Bitcoin Demand Dries Up As Miners Prepare to Dump 2,077 BTC: Is More Selling Pressure Coming for ...
Bitcoin (BTC) demand is showing signs of weakness as miners move more coins to cryptocurrency exchanges. CryptoQuant recorded 2,077 BTC in miner-to-exchange transfers on November 10, approximately 16 times the 30-day daily average of 127 BTC. The move comes as Bitcoin struggles to regain momentum and the network approaches an estimated 8% reduction in mining difficulty.
The latest figures raise concerns about potential selling pressure, particularly as demand indicators weaken across spot and derivatives markets.
Meanwhile, miners could soon receive some relief from lower network difficulty.
Bitcoin's Rebound Fades as Spot Demand Weakens and Miner Flows Surge
“Leverage is being unwound, but spot demand has not recovered sustainably.” – By @xwinfinance pic.twitter.com/n03axjQKqt
— CryptoQuant.com (@cryptoquant_com) November 13, 2026
Explore: Bitcoin Price Crashes Below $69,000: Is the Worst Still to Come?
Antpool Sends 2,077 BTC to Exchanges in Biggest Miner Transfer Since February
Bitcoin Miner Flows
The 2,077 BTC transfer marked the largest daily miner-to-exchange movement since February 2026, according to CryptoQuant. Around 97% of the transferred Bitcoin came from Antpool, one of the network’s largest mining pools.
The movement represents a significant increase compared with the 30-day average of 127 BTC. Miners often transfer Bitcoin to exchanges when they need to liquidate holdings to cover electricity bills, equipment costs and other operating expenses.
However, CryptoQuant’s Miner to Exchange Flow indicator tracks transfers rather than completed sales. Miners can also move coins for treasury management or other operational reasons.
The latest activity therefore signals a potential increase in available selling supply, rather than confirmation that 2,077 BTC entered the market as sell orders.
Bitcoin Demand Dries Up as Spot Buyers Retreat and Futures Selling Intensifies
Miner transfers are adding to concerns about an already fragile market. CryptoQuant’s 30-day demand-growth indicators showed negative readings across both spot and perpetual futures markets.
Spot demand stood at approximately -280,000 BTC, while perpetual futures demand reached around -82,000 BTC. Combined, the indicators produced a negative reading of approximately 362,000 BTC.
These figures point to deteriorating demand conditions. Spot demand is particularly important because it reflects activity in the underlying Bitcoin market, while perpetual futures activity provides insight into speculative positioning.
The negative readings suggest that buying activity has struggled to absorb available supply. If miners continue transferring Bitcoin to exchanges while spot demand remains weak, the market could face additional downward pressure.
However, these indicators measure changes in estimated demand, not a direct count of Bitcoin sold by investors.
Market Intelligence: Crypto Analyst Predicts Best New Crypto to Hodl
Bitcoin’s next difficulty adjustment, expected around 14 November at block 975,744, may drop by roughly 8.4% after average block times rose to 655 seconds. The protocol reduces difficulty every 2,016 blocks (about two weeks) to maintain a 10-minute target; slower production eases mining and may boost BTC yield per unit of power.
This could aid miners amid weak prices and tight margins, but profitability still depends on electricity costs, hardware efficiency, fees and BTC value.
What Comes Next for Bitcoin? $69,000 Level Is Under Pressure
BTCUSDT Chart 1D Source: TradingView
Bitcoin is trading near $69,200 after another sharp daily decline. The chart shows that BTC has broken below the $75,000–$76,000 support zone, which now represents an important resistance area. The immediate level to watch is around $69,000.
A sustained break below it could expose the $64,000–$65,000 support area, followed by $60,000. On the upside, Bitcoin would need to reclaim $75,000 to signal a potential recovery and improve its short-term outlook.
Bitcoin faces several challenges heading into the next difficulty adjustment. The increase in miner-to-exchange transfers, combined with negative demand indicators, suggests that the market is struggling to attract sufficient buying interest.
Still, the Antpool transfers should not be interpreted as proof of widespread miner capitulation. The data identifies a large movement from one mining pool, but does not establish that the coins were sold.
The upcoming difficulty reduction could improve mining conditions and help struggling operators manage their costs. However, it is unlikely to resolve the broader weakness in Bitcoin demand.
Investors will be watching whether exchange transfers translate into actual selling and whether spot-market buyers return. A recovery in demand would help absorb additional supply and provide a stronger foundation for Bitcoin’s next move.
Market Intelligence: Crypto Analyst Reveals Upcoming Binance Listings
next
The post Bitcoin Demand Dries Up as Miners Prepare to Dump 2,077 BTC: Is More Selling Pressure Coming for BTC? appeared first on Coinspeaker.
The latest figures raise concerns about potential selling pressure, particularly as demand indicators weaken across spot and derivatives markets.
Meanwhile, miners could soon receive some relief from lower network difficulty.
Bitcoin's Rebound Fades as Spot Demand Weakens and Miner Flows Surge
“Leverage is being unwound, but spot demand has not recovered sustainably.” – By @xwinfinance pic.twitter.com/n03axjQKqt
— CryptoQuant.com (@cryptoquant_com) November 13, 2026
Explore: Bitcoin Price Crashes Below $69,000: Is the Worst Still to Come?
Antpool Sends 2,077 BTC to Exchanges in Biggest Miner Transfer Since February
Bitcoin Miner Flows
The 2,077 BTC transfer marked the largest daily miner-to-exchange movement since February 2026, according to CryptoQuant. Around 97% of the transferred Bitcoin came from Antpool, one of the network’s largest mining pools.
The movement represents a significant increase compared with the 30-day average of 127 BTC. Miners often transfer Bitcoin to exchanges when they need to liquidate holdings to cover electricity bills, equipment costs and other operating expenses.
However, CryptoQuant’s Miner to Exchange Flow indicator tracks transfers rather than completed sales. Miners can also move coins for treasury management or other operational reasons.
The latest activity therefore signals a potential increase in available selling supply, rather than confirmation that 2,077 BTC entered the market as sell orders.
Bitcoin Demand Dries Up as Spot Buyers Retreat and Futures Selling Intensifies
Miner transfers are adding to concerns about an already fragile market. CryptoQuant’s 30-day demand-growth indicators showed negative readings across both spot and perpetual futures markets.
Spot demand stood at approximately -280,000 BTC, while perpetual futures demand reached around -82,000 BTC. Combined, the indicators produced a negative reading of approximately 362,000 BTC.
These figures point to deteriorating demand conditions. Spot demand is particularly important because it reflects activity in the underlying Bitcoin market, while perpetual futures activity provides insight into speculative positioning.
The negative readings suggest that buying activity has struggled to absorb available supply. If miners continue transferring Bitcoin to exchanges while spot demand remains weak, the market could face additional downward pressure.
However, these indicators measure changes in estimated demand, not a direct count of Bitcoin sold by investors.
Market Intelligence: Crypto Analyst Predicts Best New Crypto to Hodl
Bitcoin’s next difficulty adjustment, expected around 14 November at block 975,744, may drop by roughly 8.4% after average block times rose to 655 seconds. The protocol reduces difficulty every 2,016 blocks (about two weeks) to maintain a 10-minute target; slower production eases mining and may boost BTC yield per unit of power.
This could aid miners amid weak prices and tight margins, but profitability still depends on electricity costs, hardware efficiency, fees and BTC value.
What Comes Next for Bitcoin? $69,000 Level Is Under Pressure
BTCUSDT Chart 1D Source: TradingView
Bitcoin is trading near $69,200 after another sharp daily decline. The chart shows that BTC has broken below the $75,000–$76,000 support zone, which now represents an important resistance area. The immediate level to watch is around $69,000.
A sustained break below it could expose the $64,000–$65,000 support area, followed by $60,000. On the upside, Bitcoin would need to reclaim $75,000 to signal a potential recovery and improve its short-term outlook.
Bitcoin faces several challenges heading into the next difficulty adjustment. The increase in miner-to-exchange transfers, combined with negative demand indicators, suggests that the market is struggling to attract sufficient buying interest.
Still, the Antpool transfers should not be interpreted as proof of widespread miner capitulation. The data identifies a large movement from one mining pool, but does not establish that the coins were sold.
The upcoming difficulty reduction could improve mining conditions and help struggling operators manage their costs. However, it is unlikely to resolve the broader weakness in Bitcoin demand.
Investors will be watching whether exchange transfers translate into actual selling and whether spot-market buyers return. A recovery in demand would help absorb additional supply and provide a stronger foundation for Bitcoin’s next move.
Market Intelligence: Crypto Analyst Reveals Upcoming Binance Listings
next
The post Bitcoin Demand Dries Up as Miners Prepare to Dump 2,077 BTC: Is More Selling Pressure Coming for BTC? appeared first on Coinspeaker.
2
501
·
--
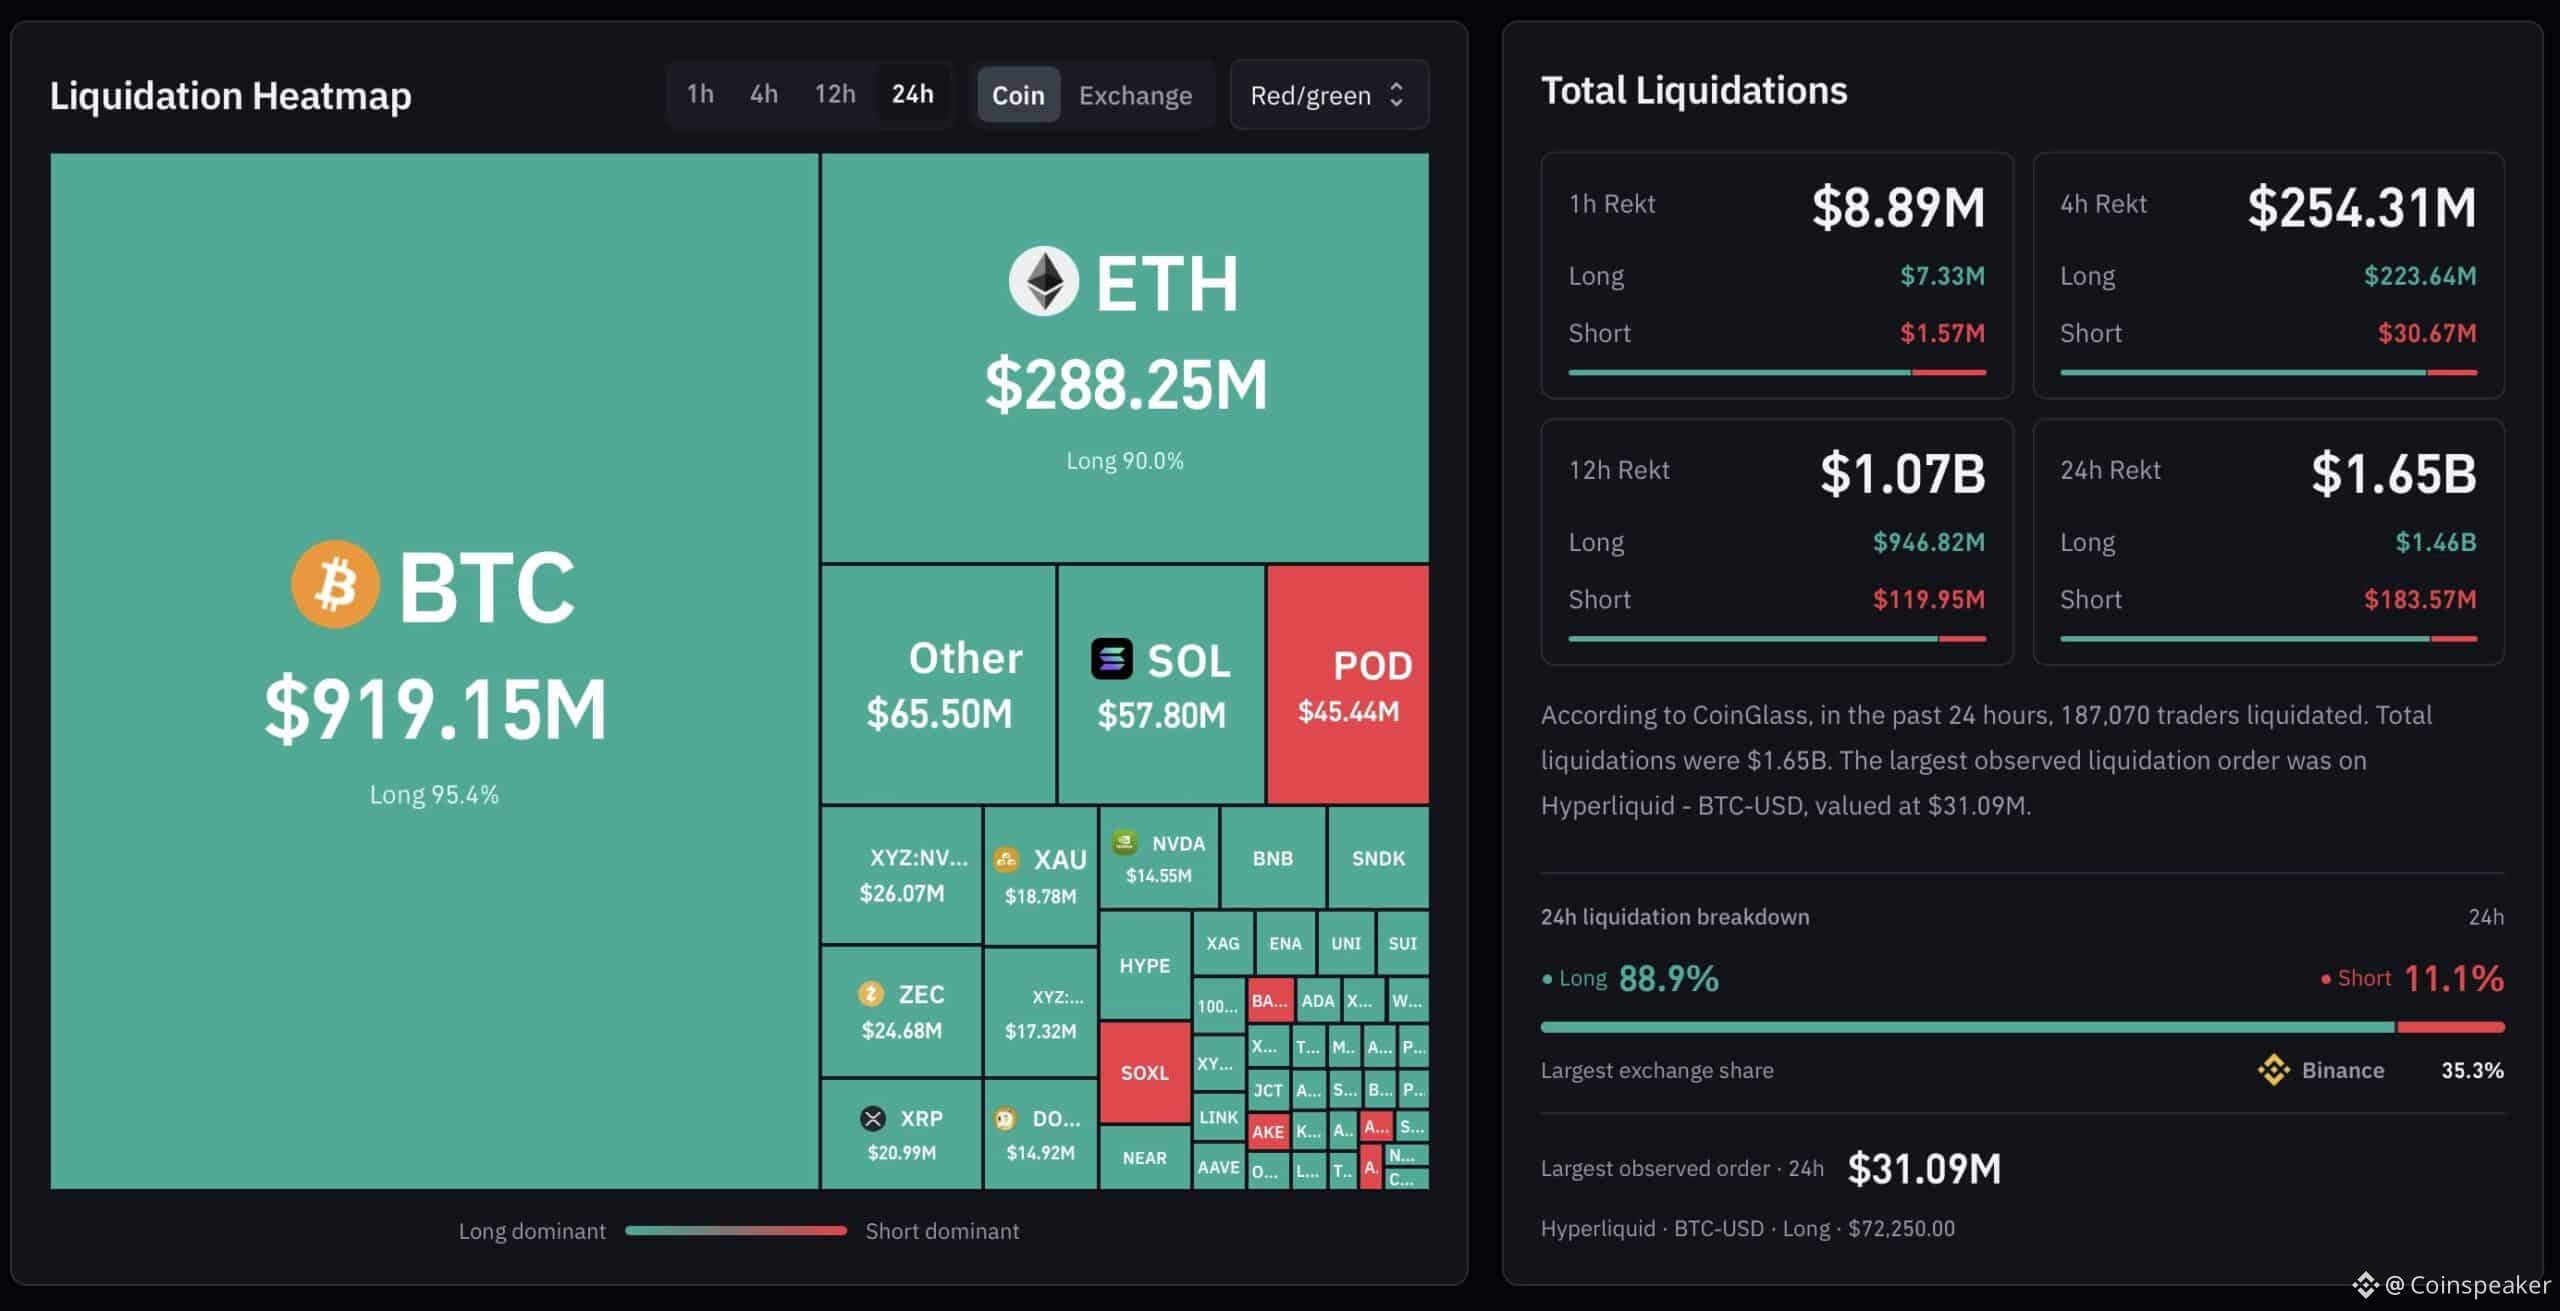
Article
Bitcoin Price Crashes Below $69,000: Is the Worst Still to Come?In Bitcoin news on Friday, November 13, the BTC USD price fell as low as $67,568 on Binance as a wave of forced selling wiped out leveraged bets on a rebound. It was the cryptocurrency’s lowest price since August 19.
Bitcoin trades at $68,772, down 6.7% in 24 hours and 9.1% in a week. Ether lost 5.5% and Solana 3.4% on the day.
BREAKING: Bitcoin falls below $69,000 and ETH nears $1,900 as selling pressure accelerates in crypto.
Crypto markets have now lost -$150 billion in 48 hours. pic.twitter.com/29QW0khxOh
— The Kobeissi Letter (@KobeissiLetter) November 13, 2026
Most of the damage came from liquidations, when an exchange closes a leveraged trade by force once the trader’s collateral runs out. CoinGlass data cited by several outlets put the 24-hour total at about $1.4 billion, close to 90% of it from longs, the bets that prices would rise. Those forced sales pushed Bitcoin through $70,000 in about two hours overnight.
The mood has flipped with it. The Crypto Fear & Greed Index dropped from 28 to 20 on Friday, its first Extreme Fear reading since July.
In Bitcoin news this week, the question is no longer whether the market is scared. It is whether Extreme Fear means the bottom is close, and what the daily and weekly charts say.
Liquidation Cascade: The Overnight Flush Hit Longs 11 to 1
Liquidation Map
The slide started on Thursday afternoon, when Nvidia announced that CEO Jensen Huang had resigned. It picked up speed after midnight UTC, when Bitcoin broke below the $72,727 low from Tuesday and kept falling.
We added up every forced closure in Bitcoin, Ethereum, Solana, XRP and Dogecoin futures on OKX, one of the largest exchanges, over the past 24 hours.
Longs lost $125.5 million. Shorts lost $11.2 million, so longs took about 11 times more damage.
Bitcoin alone: $76.7 million of longs were closed, most of it in two bursts. The first came at 14:00 UTC on Thursday, as the Nvidia news broke. The second came at 03:00 UTC on Friday, when Bitcoin fell through $69,000.
ETH: $33.6 million of longs, the second-biggest hit.
Investors have also kept pulling money from U.S. spot Bitcoin ETFs, funds that buy and hold the coin itself, adding to the selling.
EXPLORE: Bitcoin Price Crashes to $72,700 as Leveraged Traders Buy the Dip: Is the Bottom In?
Bitcoin News From the Futures Market: Two Bottom Signals Flash
On Thursday, we listed three signs that would point to a bottom: the fear index dropping toward the teens, the funding rate turning negative and open interest, the value of open futures bets, falling as longs give up. Overnight, two of them showed up.
Funding turned negative: The funding rate, a fee that keeps futures prices in line with spot, flipped to -0.0064% on OKX at 08:00 UTC. Shorts now pay longs for the first time since November 7.
Open interest fell: The value of all open Bitcoin futures on OKX dropped from $3.86 billion late on Thursday to $3.46 billion, a 10% cut in a few hours.
Fear reached 20: Close to the teens, though not yet at the 9 and 11 readings that marked this year’s February and July lows.
One sign still points the other way. On OKX, 3.19 accounts are long for every one that is short, about the same as before the crash. Many traders are still buying the dip with leverage.
Market Intelligence: Crypto Analyst Predicts Best New Crypto to Hodl
Extreme Fear Has Rarely Marked the Exact Bottom
Extreme Fear sounds like a buy signal. History says it usually comes early. We found every time since 2018 that the index first dropped to 20 or lower after at least a month without such a reading. There were 16, and we followed Bitcoin for 90 days after each.
It kept falling 15 times out of 16. The median further drop was 23.2%, and the low came a median 44 days later.
The bottom came within a week only three times: August 2018, March 2020 and September 2021.
90 days later: Bitcoin was higher in 7 of the 16 cases, with a median move of -4.4%.
The most recent case fits the pattern. Extreme Fear first appeared on June 3 at $64,014, and Bitcoin still fell another 8.5% before it bottomed at $57,800 on July 1. Then it rallied to $87,396 in September.
For anyone reading this Bitcoin news as a buy signal, Extreme Fear says the bottom is getting closer. It has rarely said the bottom is here. A move to the 2026 lows would match the median path.
Bitcoin Price Analysis: The Daily Chart
On the daily chart, where each candle covers one day, Bitcoin sits far below both of its exponential moving averages (EMAs), averages that give recent prices more weight. The 50-day EMA is at $78,226 and the 200-day EMA at $76,325.
Resistance: $72,727, Tuesday’s low, which now caps rebounds. Then $76,325, the 200-day EMA.
Support: $67,568, Friday’s low. Below that, $64,166, the double low from August 7 and 19, and $62,535, the August 14 low.
BTCUSDT 1D chart. Source: TradingView
Bitcoin News: The Weekly Chart Is Testing the Line That Marked 2026’s Bottoms
On the weekly chart, where each candle covers one week, the key level is the 200-week EMA at $69,555. Bitcoin trades just below it, and the week closes on Sunday.
That line matters. Bitcoin closed below the 200-week EMA for 16 weeks this year, in February and March and again from June to mid-August, and both of 2026’s bottoms formed during those stretches.
Resistance: $69,555, the 200-week EMA, then $78,053, the 50-week EMA.
Support: $65,000, the March low, then $60,000, the February low, and $57,800, the July bottom.
BTCUSDT 1W chart. Source: TradingView
Outlook Trigger Level to watch Rebound A weekly close back above $69,555 and a daily close above $72,727 $76,325, the 200-day EMA Holding pattern Daily closes between $64,166 and $72,727 A base under the 200-week EMA Sell-off A daily close below $64,166 $60,000, then the $57,800 July low
The overnight flush did part of the work a bottom needs: leverage came out and funding turned negative.
For traders following Bitcoin news, the Sunday weekly close against $69,555 is the next test. History says the final low often comes weeks after the first Extreme Fear reading.
Market Intelligence: Crypto Analyst Reveals Upcoming Binance Listings
next
The post Bitcoin Price Crashes Below $69,000: Is the Worst Still to Come? appeared first on Coinspeaker.
Bitcoin Price Crashes Below $69,000: Is the Worst Still to Come?
In Bitcoin news on Friday, November 13, the BTC USD price fell as low as $67,568 on Binance as a wave of forced selling wiped out leveraged bets on a rebound. It was the cryptocurrency’s lowest price since August 19.
Bitcoin trades at $68,772, down 6.7% in 24 hours and 9.1% in a week. Ether lost 5.5% and Solana 3.4% on the day.
BREAKING: Bitcoin falls below $69,000 and ETH nears $1,900 as selling pressure accelerates in crypto.
Crypto markets have now lost -$150 billion in 48 hours. pic.twitter.com/29QW0khxOh
— The Kobeissi Letter (@KobeissiLetter) November 13, 2026
Most of the damage came from liquidations, when an exchange closes a leveraged trade by force once the trader’s collateral runs out. CoinGlass data cited by several outlets put the 24-hour total at about $1.4 billion, close to 90% of it from longs, the bets that prices would rise. Those forced sales pushed Bitcoin through $70,000 in about two hours overnight.
The mood has flipped with it. The Crypto Fear & Greed Index dropped from 28 to 20 on Friday, its first Extreme Fear reading since July.
In Bitcoin news this week, the question is no longer whether the market is scared. It is whether Extreme Fear means the bottom is close, and what the daily and weekly charts say.
Liquidation Cascade: The Overnight Flush Hit Longs 11 to 1
Liquidation Map
The slide started on Thursday afternoon, when Nvidia announced that CEO Jensen Huang had resigned. It picked up speed after midnight UTC, when Bitcoin broke below the $72,727 low from Tuesday and kept falling.
We added up every forced closure in Bitcoin, Ethereum, Solana, XRP and Dogecoin futures on OKX, one of the largest exchanges, over the past 24 hours.
Longs lost $125.5 million. Shorts lost $11.2 million, so longs took about 11 times more damage.
Bitcoin alone: $76.7 million of longs were closed, most of it in two bursts. The first came at 14:00 UTC on Thursday, as the Nvidia news broke. The second came at 03:00 UTC on Friday, when Bitcoin fell through $69,000.
ETH: $33.6 million of longs, the second-biggest hit.
Investors have also kept pulling money from U.S. spot Bitcoin ETFs, funds that buy and hold the coin itself, adding to the selling.
EXPLORE: Bitcoin Price Crashes to $72,700 as Leveraged Traders Buy the Dip: Is the Bottom In?
Bitcoin News From the Futures Market: Two Bottom Signals Flash
On Thursday, we listed three signs that would point to a bottom: the fear index dropping toward the teens, the funding rate turning negative and open interest, the value of open futures bets, falling as longs give up. Overnight, two of them showed up.
Funding turned negative: The funding rate, a fee that keeps futures prices in line with spot, flipped to -0.0064% on OKX at 08:00 UTC. Shorts now pay longs for the first time since November 7.
Open interest fell: The value of all open Bitcoin futures on OKX dropped from $3.86 billion late on Thursday to $3.46 billion, a 10% cut in a few hours.
Fear reached 20: Close to the teens, though not yet at the 9 and 11 readings that marked this year’s February and July lows.
One sign still points the other way. On OKX, 3.19 accounts are long for every one that is short, about the same as before the crash. Many traders are still buying the dip with leverage.
Market Intelligence: Crypto Analyst Predicts Best New Crypto to Hodl
Extreme Fear Has Rarely Marked the Exact Bottom
Extreme Fear sounds like a buy signal. History says it usually comes early. We found every time since 2018 that the index first dropped to 20 or lower after at least a month without such a reading. There were 16, and we followed Bitcoin for 90 days after each.
It kept falling 15 times out of 16. The median further drop was 23.2%, and the low came a median 44 days later.
The bottom came within a week only three times: August 2018, March 2020 and September 2021.
90 days later: Bitcoin was higher in 7 of the 16 cases, with a median move of -4.4%.
The most recent case fits the pattern. Extreme Fear first appeared on June 3 at $64,014, and Bitcoin still fell another 8.5% before it bottomed at $57,800 on July 1. Then it rallied to $87,396 in September.
For anyone reading this Bitcoin news as a buy signal, Extreme Fear says the bottom is getting closer. It has rarely said the bottom is here. A move to the 2026 lows would match the median path.
Bitcoin Price Analysis: The Daily Chart
On the daily chart, where each candle covers one day, Bitcoin sits far below both of its exponential moving averages (EMAs), averages that give recent prices more weight. The 50-day EMA is at $78,226 and the 200-day EMA at $76,325.
Resistance: $72,727, Tuesday’s low, which now caps rebounds. Then $76,325, the 200-day EMA.
Support: $67,568, Friday’s low. Below that, $64,166, the double low from August 7 and 19, and $62,535, the August 14 low.
BTCUSDT 1D chart. Source: TradingView
Bitcoin News: The Weekly Chart Is Testing the Line That Marked 2026’s Bottoms
On the weekly chart, where each candle covers one week, the key level is the 200-week EMA at $69,555. Bitcoin trades just below it, and the week closes on Sunday.
That line matters. Bitcoin closed below the 200-week EMA for 16 weeks this year, in February and March and again from June to mid-August, and both of 2026’s bottoms formed during those stretches.
Resistance: $69,555, the 200-week EMA, then $78,053, the 50-week EMA.
Support: $65,000, the March low, then $60,000, the February low, and $57,800, the July bottom.
BTCUSDT 1W chart. Source: TradingView
Outlook Trigger Level to watch Rebound A weekly close back above $69,555 and a daily close above $72,727 $76,325, the 200-day EMA Holding pattern Daily closes between $64,166 and $72,727 A base under the 200-week EMA Sell-off A daily close below $64,166 $60,000, then the $57,800 July low
The overnight flush did part of the work a bottom needs: leverage came out and funding turned negative.
For traders following Bitcoin news, the Sunday weekly close against $69,555 is the next test. History says the final low often comes weeks after the first Extreme Fear reading.
Market Intelligence: Crypto Analyst Reveals Upcoming Binance Listings
next
The post Bitcoin Price Crashes Below $69,000: Is the Worst Still to Come? appeared first on Coinspeaker.
Bitcoin trades at $68,772, down 6.7% in 24 hours and 9.1% in a week. Ether lost 5.5% and Solana 3.4% on the day.
BREAKING: Bitcoin falls below $69,000 and ETH nears $1,900 as selling pressure accelerates in crypto.
Crypto markets have now lost -$150 billion in 48 hours. pic.twitter.com/29QW0khxOh
— The Kobeissi Letter (@KobeissiLetter) November 13, 2026
Most of the damage came from liquidations, when an exchange closes a leveraged trade by force once the trader’s collateral runs out. CoinGlass data cited by several outlets put the 24-hour total at about $1.4 billion, close to 90% of it from longs, the bets that prices would rise. Those forced sales pushed Bitcoin through $70,000 in about two hours overnight.
The mood has flipped with it. The Crypto Fear & Greed Index dropped from 28 to 20 on Friday, its first Extreme Fear reading since July.
In Bitcoin news this week, the question is no longer whether the market is scared. It is whether Extreme Fear means the bottom is close, and what the daily and weekly charts say.
Liquidation Cascade: The Overnight Flush Hit Longs 11 to 1
Liquidation Map
The slide started on Thursday afternoon, when Nvidia announced that CEO Jensen Huang had resigned. It picked up speed after midnight UTC, when Bitcoin broke below the $72,727 low from Tuesday and kept falling.
We added up every forced closure in Bitcoin, Ethereum, Solana, XRP and Dogecoin futures on OKX, one of the largest exchanges, over the past 24 hours.
Longs lost $125.5 million. Shorts lost $11.2 million, so longs took about 11 times more damage.
Bitcoin alone: $76.7 million of longs were closed, most of it in two bursts. The first came at 14:00 UTC on Thursday, as the Nvidia news broke. The second came at 03:00 UTC on Friday, when Bitcoin fell through $69,000.
ETH: $33.6 million of longs, the second-biggest hit.
Investors have also kept pulling money from U.S. spot Bitcoin ETFs, funds that buy and hold the coin itself, adding to the selling.
EXPLORE: Bitcoin Price Crashes to $72,700 as Leveraged Traders Buy the Dip: Is the Bottom In?
Bitcoin News From the Futures Market: Two Bottom Signals Flash
On Thursday, we listed three signs that would point to a bottom: the fear index dropping toward the teens, the funding rate turning negative and open interest, the value of open futures bets, falling as longs give up. Overnight, two of them showed up.
Funding turned negative: The funding rate, a fee that keeps futures prices in line with spot, flipped to -0.0064% on OKX at 08:00 UTC. Shorts now pay longs for the first time since November 7.
Open interest fell: The value of all open Bitcoin futures on OKX dropped from $3.86 billion late on Thursday to $3.46 billion, a 10% cut in a few hours.
Fear reached 20: Close to the teens, though not yet at the 9 and 11 readings that marked this year’s February and July lows.
One sign still points the other way. On OKX, 3.19 accounts are long for every one that is short, about the same as before the crash. Many traders are still buying the dip with leverage.
Market Intelligence: Crypto Analyst Predicts Best New Crypto to Hodl
Extreme Fear Has Rarely Marked the Exact Bottom
Extreme Fear sounds like a buy signal. History says it usually comes early. We found every time since 2018 that the index first dropped to 20 or lower after at least a month without such a reading. There were 16, and we followed Bitcoin for 90 days after each.
It kept falling 15 times out of 16. The median further drop was 23.2%, and the low came a median 44 days later.
The bottom came within a week only three times: August 2018, March 2020 and September 2021.
90 days later: Bitcoin was higher in 7 of the 16 cases, with a median move of -4.4%.
The most recent case fits the pattern. Extreme Fear first appeared on June 3 at $64,014, and Bitcoin still fell another 8.5% before it bottomed at $57,800 on July 1. Then it rallied to $87,396 in September.
For anyone reading this Bitcoin news as a buy signal, Extreme Fear says the bottom is getting closer. It has rarely said the bottom is here. A move to the 2026 lows would match the median path.
Bitcoin Price Analysis: The Daily Chart
On the daily chart, where each candle covers one day, Bitcoin sits far below both of its exponential moving averages (EMAs), averages that give recent prices more weight. The 50-day EMA is at $78,226 and the 200-day EMA at $76,325.
Resistance: $72,727, Tuesday’s low, which now caps rebounds. Then $76,325, the 200-day EMA.
Support: $67,568, Friday’s low. Below that, $64,166, the double low from August 7 and 19, and $62,535, the August 14 low.
BTCUSDT 1D chart. Source: TradingView
Bitcoin News: The Weekly Chart Is Testing the Line That Marked 2026’s Bottoms
On the weekly chart, where each candle covers one week, the key level is the 200-week EMA at $69,555. Bitcoin trades just below it, and the week closes on Sunday.
That line matters. Bitcoin closed below the 200-week EMA for 16 weeks this year, in February and March and again from June to mid-August, and both of 2026’s bottoms formed during those stretches.
Resistance: $69,555, the 200-week EMA, then $78,053, the 50-week EMA.
Support: $65,000, the March low, then $60,000, the February low, and $57,800, the July bottom.
BTCUSDT 1W chart. Source: TradingView
Outlook Trigger Level to watch Rebound A weekly close back above $69,555 and a daily close above $72,727 $76,325, the 200-day EMA Holding pattern Daily closes between $64,166 and $72,727 A base under the 200-week EMA Sell-off A daily close below $64,166 $60,000, then the $57,800 July low
The overnight flush did part of the work a bottom needs: leverage came out and funding turned negative.
For traders following Bitcoin news, the Sunday weekly close against $69,555 is the next test. History says the final low often comes weeks after the first Extreme Fear reading.
Market Intelligence: Crypto Analyst Reveals Upcoming Binance Listings
next
The post Bitcoin Price Crashes Below $69,000: Is the Worst Still to Come? appeared first on Coinspeaker.
2
1
1.2k
·
--
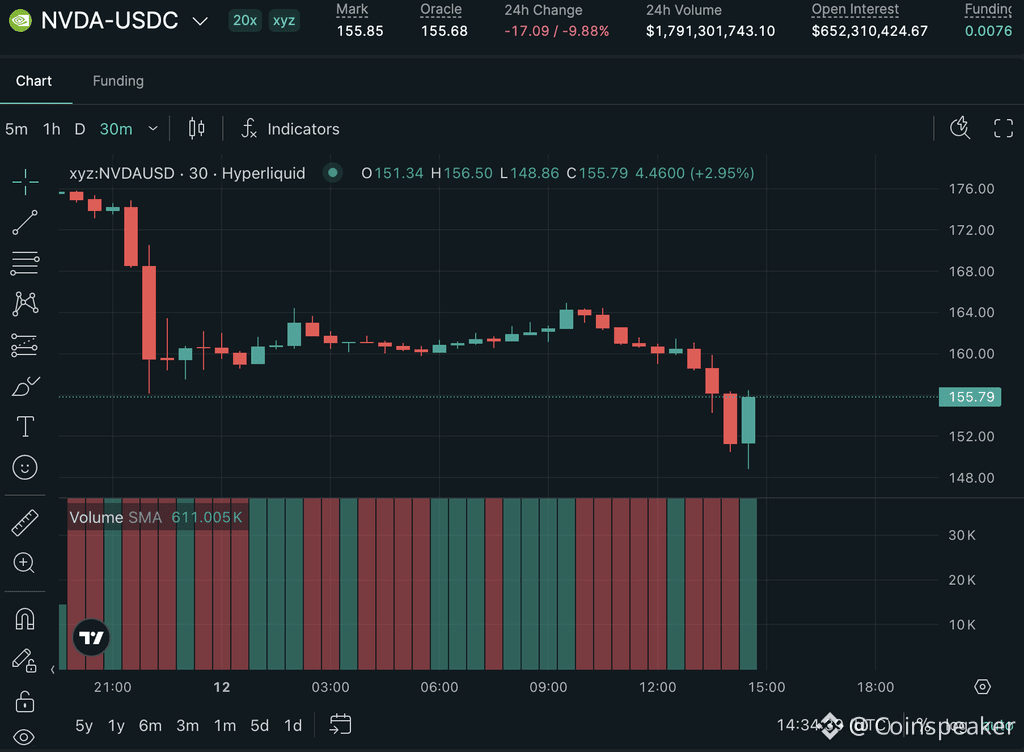
Article
Jensen Huang Resigns As Nvidia CEO After Second Affair Bombshell: Who Is Colette Kress?Today (November 12, 2026), Nvidia announced that co-founder and longtime CEO Jensen Huang has resigned as President, Chief Executive Officer, and Board member, effective immediately.
The decision follows intense scrutiny over personal and potential national-security-related controversies. Chief Financial Officer Colette Kress has been appointed Interim CEO while remaining CFO. https://www.youtube.com/watch?v=aioLZFt2Xwc The board has also named longtime director Harvey C. Jones as its first-ever Chair and launched a search for a permanent successor, with a high-profile Apple exec tipped as an early frontrunner.
Nvidia shares reacted sharply, falling more than -10% in premarket trading and extending recent losses that have erased hundreds of billions in market value. As of midday trading, NVDA was fluctuating near the mid-$150s to low-$160s range.
What Was the Scandal that Led to Jensen Huang’s Resignation as Nvidia CEO?
Nvidia CEO Jensen Huang allegedly has a second affair on top of the suspected Chinese spy. He also had a romantic relationship with Kimberly Powell, someone who worked at Nvidia since 2008, according to a New York Times report. pic.twitter.com/QJRTnJb8c6
— Pubity (@pubity) November 11, 2026
The resignation stems from revelations of two extramarital affairs. The first involved Alice Huang, a businesswoman linked to the Singapore-based AI company Megaspeed, a significant Nvidia customer. US authorities have identified her as a suspected asset of China’s Ministry of State Security.
Reports indicated Huang had been photographed with her on multiple occasions, raising concerns about potential intelligence targeting of the Nvidia CEO.
Huang publicly apologized to employees for being unfaithful to his wife but denied compromising national security or company secrets. The situation escalated further when additional reporting alleged a second relationship with Kimberly Powell, Nvidia’s vice president of healthcare and a direct report to Huang.
These dual revelations prompted Nvidia’s board to open an internal investigation and ultimately accept Huang’s resignation after a late-night meeting.
The combination of personal misconduct involving a subordinate and the national-security implications surrounding the alleged Chinese intelligence connection proved decisive.
Who Is Colette Kress and Who Is the Apple Exec Tipped for the Permanent CEO Role?
https://twitter.com/JesseCohenInv/status/2120779503119012207 Colette Kress has served as Nvidia’s Executive Vice President and Chief Financial Officer since September 2013. Before joining the company, she spent nearly 25 years in senior finance roles at major technology firms,
These firms include Cisco (where she was CFO of the Business Technology and Operations organization) and Microsoft (where she was CFO of the Server and Tools division), as well as earlier positions at Texas Instruments.
She holds a bachelor’s degree in finance from the University of Arizona and an MBA from Southern Methodist University. During her tenure as CFO, Nvidia’s revenue grew dramatically from roughly $4Bn to over $200Bn as the company became the dominant force in AI accelerators.
As Interim CEO, she is tasked with providing continuity while the board searches for a permanent replacement, with Apple’s Johny Srouji tipped as an early frontrunner. Market Intelligence: Crypto Analyst Reveals Upcoming Coinbase Listings
Hyperliquid’s NVDA Tokenized/Perpetual Exposure and Technical Analysis
Hyperliquid: NVDA
Hyperliquid offers leveraged perpetual contracts tied to Nvidia’s share price, allowing traders 24/7 exposure without holding actual shares. These instruments track the underlying stock closely and have seen heavy volume during the scandal.
Since the initial reports of the affair and board investigation emerged in early November, the Hyperliquid NVDA perpetual has mirrored the traditional stock’s sharp decline.
The mark price has dropped from near or above $170–$175 to the mid-$150s, settling around $158–$160 by November 12, representing roughly a 9–11% decline in the most recent sessions alone and larger cumulative losses from pre-scandal highs.
Open interest has remained elevated (hundreds of millions of dollars), reflecting active speculative positioning, while funding rates have fluctuated as longs and shorts adjust.
Volume spiked significantly on the resignation news, consistent with forced liquidations and rapid repositioning. Technically, the contract has broken key short-term support levels, with momentum indicators deeply oversold in the near term.
Any stabilization in traditional NVDA stock would likely be reflected quickly on Hyperliquid, though the platform’s high-leverage environment amplifies both downside volatility and the potential magnitude of a bounce.
Market Intelligence: Crypto Analyst Predicts Best Low-Cap Crypto
next
The post Jensen Huang Resigns as Nvidia CEO After Second Affair Bombshell: Who Is Colette Kress? appeared first on Coinspeaker.
Jensen Huang Resigns As Nvidia CEO After Second Affair Bombshell: Who Is Colette Kress?
Today (November 12, 2026), Nvidia announced that co-founder and longtime CEO Jensen Huang has resigned as President, Chief Executive Officer, and Board member, effective immediately.
The decision follows intense scrutiny over personal and potential national-security-related controversies. Chief Financial Officer Colette Kress has been appointed Interim CEO while remaining CFO. https://www.youtube.com/watch?v=aioLZFt2Xwc The board has also named longtime director Harvey C. Jones as its first-ever Chair and launched a search for a permanent successor, with a high-profile Apple exec tipped as an early frontrunner.
Nvidia shares reacted sharply, falling more than -10% in premarket trading and extending recent losses that have erased hundreds of billions in market value. As of midday trading, NVDA was fluctuating near the mid-$150s to low-$160s range.
What Was the Scandal that Led to Jensen Huang’s Resignation as Nvidia CEO?
Nvidia CEO Jensen Huang allegedly has a second affair on top of the suspected Chinese spy. He also had a romantic relationship with Kimberly Powell, someone who worked at Nvidia since 2008, according to a New York Times report. pic.twitter.com/QJRTnJb8c6
— Pubity (@pubity) November 11, 2026
The resignation stems from revelations of two extramarital affairs. The first involved Alice Huang, a businesswoman linked to the Singapore-based AI company Megaspeed, a significant Nvidia customer. US authorities have identified her as a suspected asset of China’s Ministry of State Security.
Reports indicated Huang had been photographed with her on multiple occasions, raising concerns about potential intelligence targeting of the Nvidia CEO.
Huang publicly apologized to employees for being unfaithful to his wife but denied compromising national security or company secrets. The situation escalated further when additional reporting alleged a second relationship with Kimberly Powell, Nvidia’s vice president of healthcare and a direct report to Huang.
These dual revelations prompted Nvidia’s board to open an internal investigation and ultimately accept Huang’s resignation after a late-night meeting.
The combination of personal misconduct involving a subordinate and the national-security implications surrounding the alleged Chinese intelligence connection proved decisive.
Who Is Colette Kress and Who Is the Apple Exec Tipped for the Permanent CEO Role?
https://twitter.com/JesseCohenInv/status/2120779503119012207 Colette Kress has served as Nvidia’s Executive Vice President and Chief Financial Officer since September 2013. Before joining the company, she spent nearly 25 years in senior finance roles at major technology firms,
These firms include Cisco (where she was CFO of the Business Technology and Operations organization) and Microsoft (where she was CFO of the Server and Tools division), as well as earlier positions at Texas Instruments.
She holds a bachelor’s degree in finance from the University of Arizona and an MBA from Southern Methodist University. During her tenure as CFO, Nvidia’s revenue grew dramatically from roughly $4Bn to over $200Bn as the company became the dominant force in AI accelerators.
As Interim CEO, she is tasked with providing continuity while the board searches for a permanent replacement, with Apple’s Johny Srouji tipped as an early frontrunner. Market Intelligence: Crypto Analyst Reveals Upcoming Coinbase Listings
Hyperliquid’s NVDA Tokenized/Perpetual Exposure and Technical Analysis
Hyperliquid: NVDA
Hyperliquid offers leveraged perpetual contracts tied to Nvidia’s share price, allowing traders 24/7 exposure without holding actual shares. These instruments track the underlying stock closely and have seen heavy volume during the scandal.
Since the initial reports of the affair and board investigation emerged in early November, the Hyperliquid NVDA perpetual has mirrored the traditional stock’s sharp decline.
The mark price has dropped from near or above $170–$175 to the mid-$150s, settling around $158–$160 by November 12, representing roughly a 9–11% decline in the most recent sessions alone and larger cumulative losses from pre-scandal highs.
Open interest has remained elevated (hundreds of millions of dollars), reflecting active speculative positioning, while funding rates have fluctuated as longs and shorts adjust.
Volume spiked significantly on the resignation news, consistent with forced liquidations and rapid repositioning. Technically, the contract has broken key short-term support levels, with momentum indicators deeply oversold in the near term.
Any stabilization in traditional NVDA stock would likely be reflected quickly on Hyperliquid, though the platform’s high-leverage environment amplifies both downside volatility and the potential magnitude of a bounce.
Market Intelligence: Crypto Analyst Predicts Best Low-Cap Crypto
next
The post Jensen Huang Resigns as Nvidia CEO After Second Affair Bombshell: Who Is Colette Kress? appeared first on Coinspeaker.
The decision follows intense scrutiny over personal and potential national-security-related controversies. Chief Financial Officer Colette Kress has been appointed Interim CEO while remaining CFO. https://www.youtube.com/watch?v=aioLZFt2Xwc The board has also named longtime director Harvey C. Jones as its first-ever Chair and launched a search for a permanent successor, with a high-profile Apple exec tipped as an early frontrunner.
Nvidia shares reacted sharply, falling more than -10% in premarket trading and extending recent losses that have erased hundreds of billions in market value. As of midday trading, NVDA was fluctuating near the mid-$150s to low-$160s range.
What Was the Scandal that Led to Jensen Huang’s Resignation as Nvidia CEO?
Nvidia CEO Jensen Huang allegedly has a second affair on top of the suspected Chinese spy. He also had a romantic relationship with Kimberly Powell, someone who worked at Nvidia since 2008, according to a New York Times report. pic.twitter.com/QJRTnJb8c6
— Pubity (@pubity) November 11, 2026
The resignation stems from revelations of two extramarital affairs. The first involved Alice Huang, a businesswoman linked to the Singapore-based AI company Megaspeed, a significant Nvidia customer. US authorities have identified her as a suspected asset of China’s Ministry of State Security.
Reports indicated Huang had been photographed with her on multiple occasions, raising concerns about potential intelligence targeting of the Nvidia CEO.
Huang publicly apologized to employees for being unfaithful to his wife but denied compromising national security or company secrets. The situation escalated further when additional reporting alleged a second relationship with Kimberly Powell, Nvidia’s vice president of healthcare and a direct report to Huang.
These dual revelations prompted Nvidia’s board to open an internal investigation and ultimately accept Huang’s resignation after a late-night meeting.
The combination of personal misconduct involving a subordinate and the national-security implications surrounding the alleged Chinese intelligence connection proved decisive.
Who Is Colette Kress and Who Is the Apple Exec Tipped for the Permanent CEO Role?
https://twitter.com/JesseCohenInv/status/2120779503119012207 Colette Kress has served as Nvidia’s Executive Vice President and Chief Financial Officer since September 2013. Before joining the company, she spent nearly 25 years in senior finance roles at major technology firms,
These firms include Cisco (where she was CFO of the Business Technology and Operations organization) and Microsoft (where she was CFO of the Server and Tools division), as well as earlier positions at Texas Instruments.
She holds a bachelor’s degree in finance from the University of Arizona and an MBA from Southern Methodist University. During her tenure as CFO, Nvidia’s revenue grew dramatically from roughly $4Bn to over $200Bn as the company became the dominant force in AI accelerators.
As Interim CEO, she is tasked with providing continuity while the board searches for a permanent replacement, with Apple’s Johny Srouji tipped as an early frontrunner. Market Intelligence: Crypto Analyst Reveals Upcoming Coinbase Listings
Hyperliquid’s NVDA Tokenized/Perpetual Exposure and Technical Analysis
Hyperliquid: NVDA
Hyperliquid offers leveraged perpetual contracts tied to Nvidia’s share price, allowing traders 24/7 exposure without holding actual shares. These instruments track the underlying stock closely and have seen heavy volume during the scandal.
Since the initial reports of the affair and board investigation emerged in early November, the Hyperliquid NVDA perpetual has mirrored the traditional stock’s sharp decline.
The mark price has dropped from near or above $170–$175 to the mid-$150s, settling around $158–$160 by November 12, representing roughly a 9–11% decline in the most recent sessions alone and larger cumulative losses from pre-scandal highs.
Open interest has remained elevated (hundreds of millions of dollars), reflecting active speculative positioning, while funding rates have fluctuated as longs and shorts adjust.
Volume spiked significantly on the resignation news, consistent with forced liquidations and rapid repositioning. Technically, the contract has broken key short-term support levels, with momentum indicators deeply oversold in the near term.
Any stabilization in traditional NVDA stock would likely be reflected quickly on Hyperliquid, though the platform’s high-leverage environment amplifies both downside volatility and the potential magnitude of a bounce.
Market Intelligence: Crypto Analyst Predicts Best Low-Cap Crypto
next
The post Jensen Huang Resigns as Nvidia CEO After Second Affair Bombshell: Who Is Colette Kress? appeared first on Coinspeaker.
323
·
--
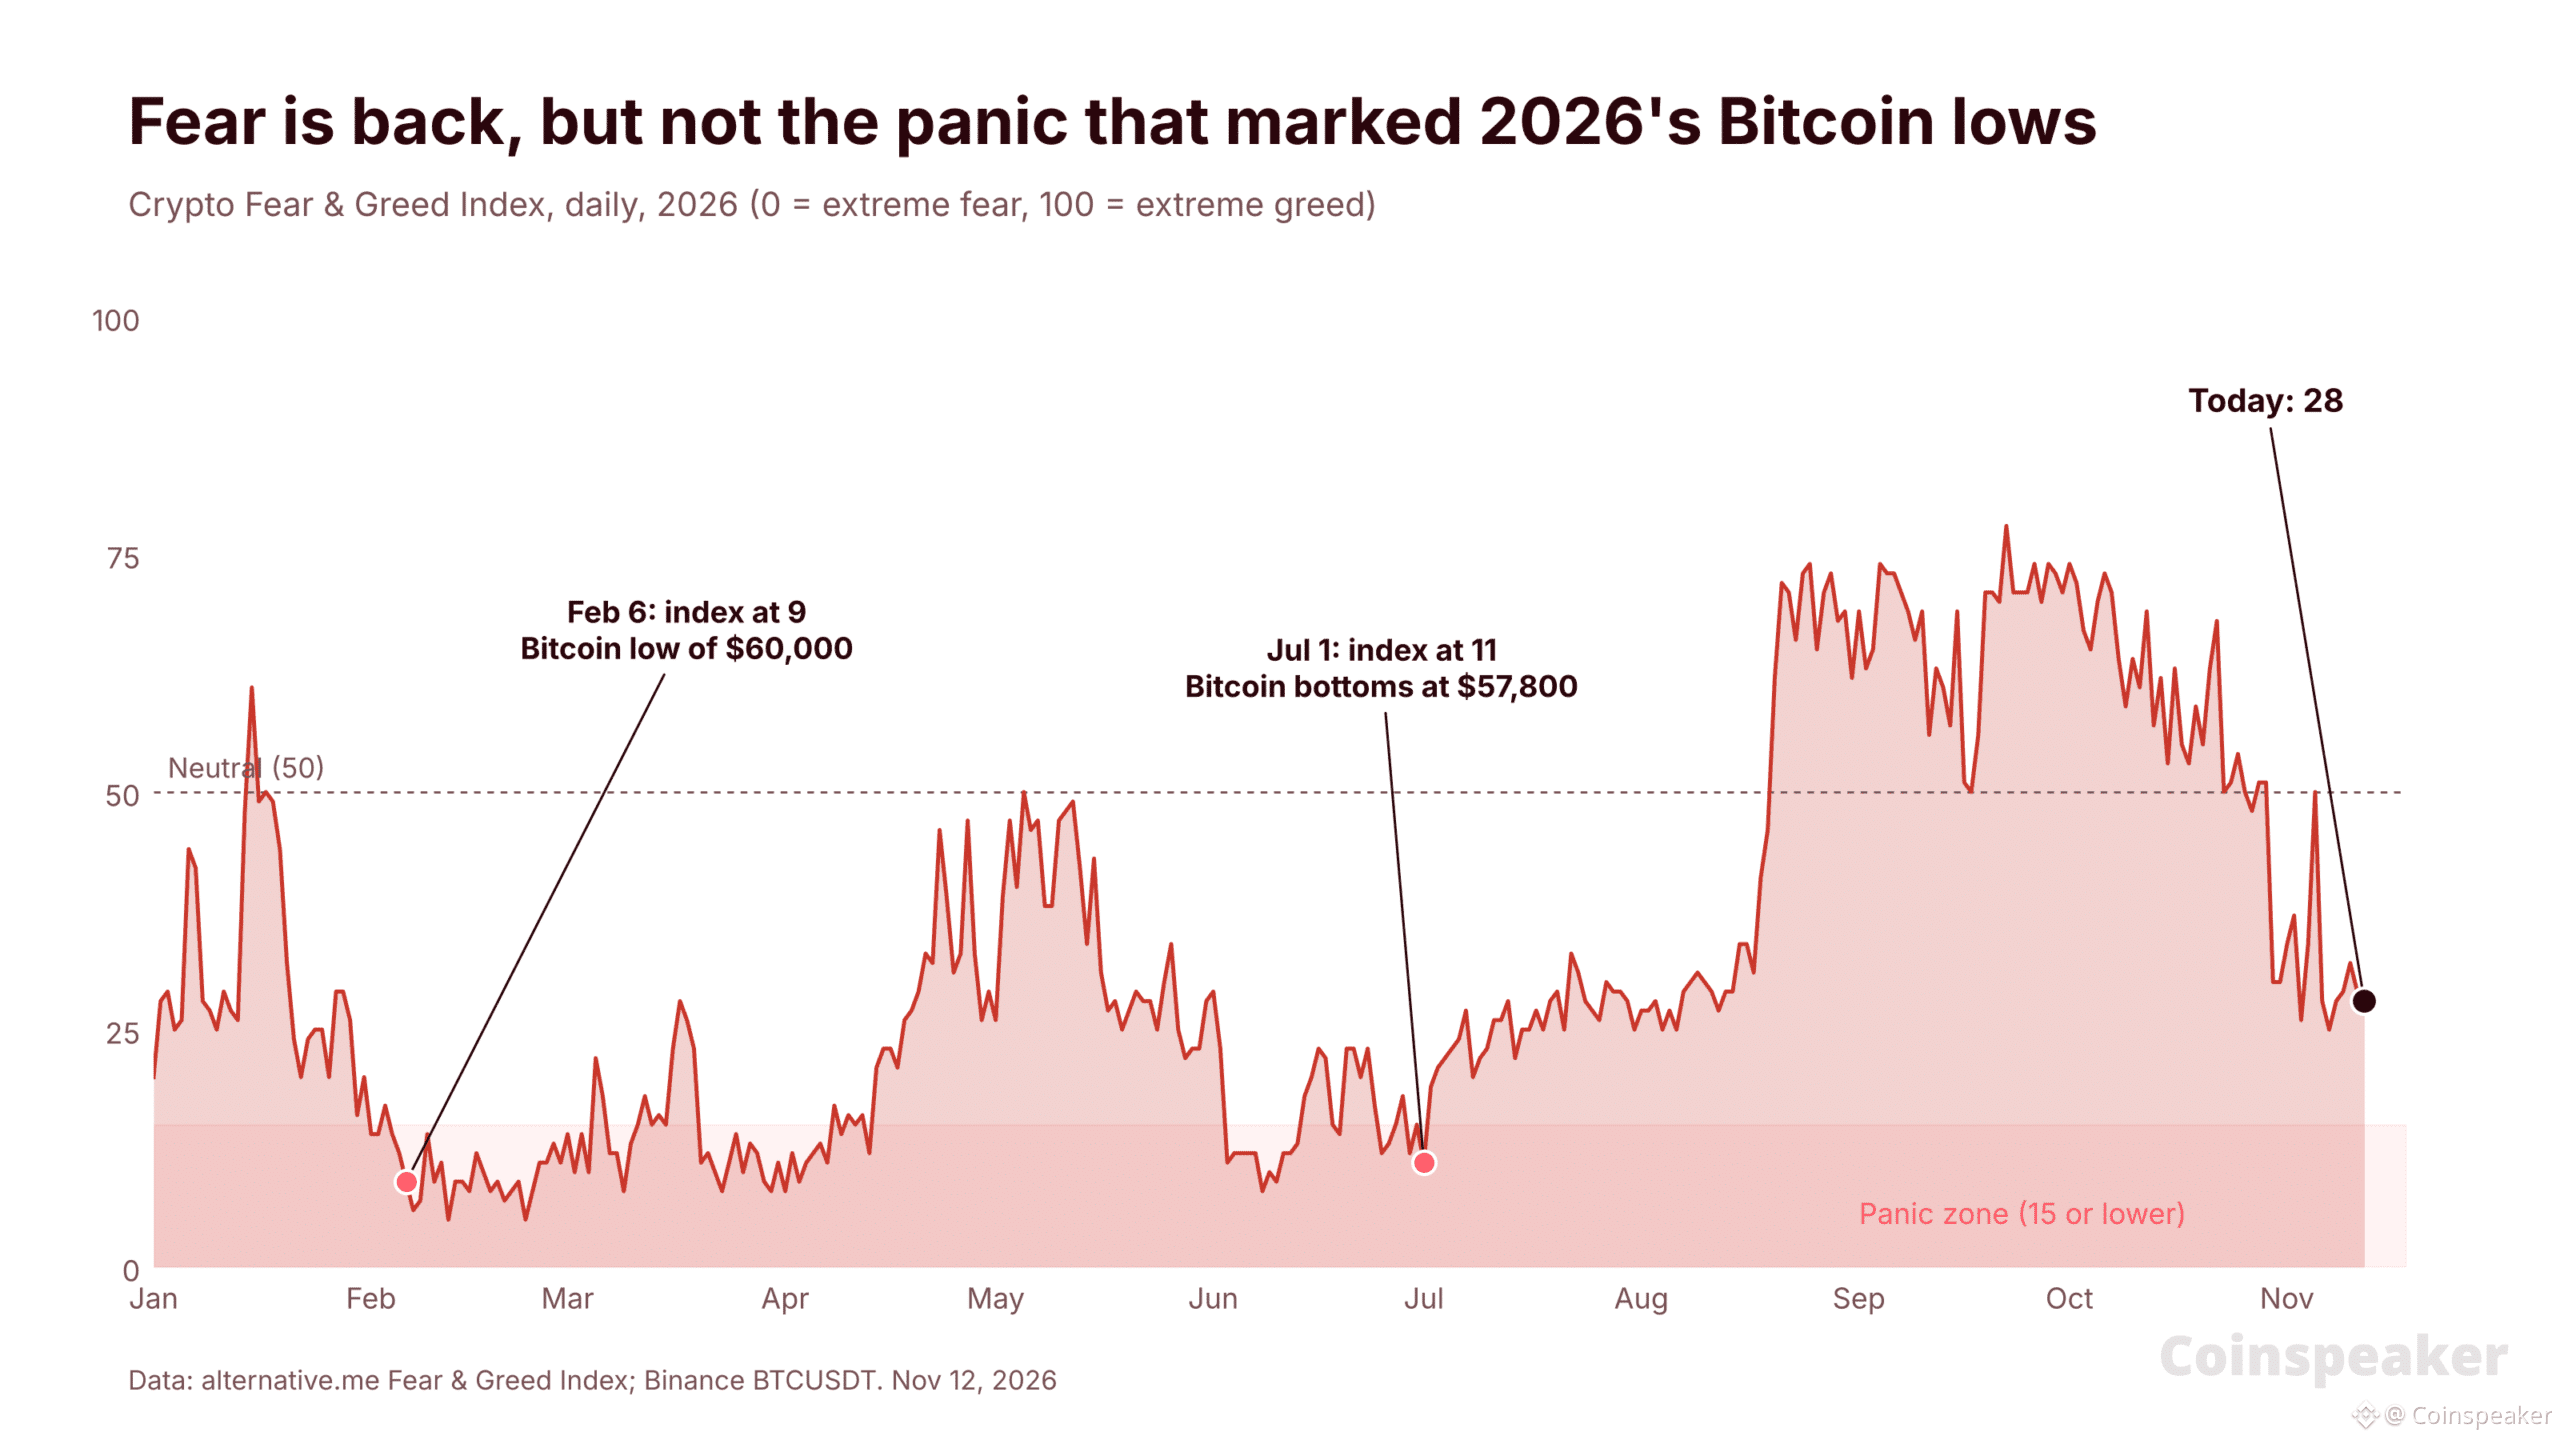
Article
Bitcoin Price Crashes to $72,700 As Leveraged Traders Buy the Dip: Is the Bottom In?Bitcoin fell below $73,000 on Thursday, November 12, extending a week-long crypto market crash in which traders who bet on a rebound were forced out of their positions again and again.
Bitcoin touched $72,735 on Binance, a hair above Tuesday’s $72,727 low and its weakest price since August 20. It trades at $72,969, down 9.4% from the November 4 close.
BREAKING: $BTC just fell to its lowest level since August.
Over $210 million worth of longs liquidated in the past 24 hours.
The dumping continues… pic.twitter.com/R7NVGivFnD
— Crypto Rover (@cryptorover) November 12, 2026
The altcoins are doing worse. Over seven days, Ethereum has lost 16.4%, Solana 14.7% and XRP 21.3%. CoinGecko values the whole crypto market at $2.42 trillion on Thursday, and Bitcoin makes up 60.5% of it.
Leverage made every drop bigger. More than $1 billion of bets were liquidated on Monday alone, almost all of them longs, the positions that profit only if prices rise. Liquidation means the exchange closes a trade by force once the trader’s collateral runs out, and those forced sales push the price down further.
So is this the flush that ends the crypto market slide, or is there more to come? The data has an answer, and it is not a comforting one.
Four Shocks in Four Days Hit the Crypto Market Crash
The sell-off had no single cause. Four pieces of bad news landed one after another:
Monday, November 9: Reports of a probe involving Nvidia CEO Jensen Huang and stalled U.S.-Iran talks hit risk assets. More than $1.15 billion of crypto positions were liquidated, about $1.04 billion of them longs.
Tuesday, November 10: A hot inflation report raised the odds that the Federal Reserve hikes interest rates in December. Another $723 million was liquidated, roughly $570 million from longs.
Wednesday, November 11: MSCI said it will drop Strategy, the biggest corporate Bitcoin holder, from its stock indexes. After the bell, Nvidia fell 9% as its board weighed removing Huang.
All week: Investors pulled money from U.S. spot Bitcoin ETFs, funds that hold the coin itself, on seven of the first eight trading days of November, about $1.88 billion in all.
Each hit forced out more leveraged longs across the crypto market. Thursday’s slide continued the pattern on a smaller scale. We added up every forced closure in Bitcoin, Ether, Solana, XRP and Dogecoin futures on OKX, one of the largest exchanges, over the past 24 hours. Longs lost $27.6 million, against $12.3 million for shorts.
EXPLORE: Bitcoin Price Slides Toward $73K as Nvidia Plunges 9% and MSCI Drops Saylor’s Strategy
Traders Keep Buying the Dip With Leverage
Big liquidations usually clear out the crowd. This time, the crowd came back.
More traders are long: On OKX, 3.11 accounts hold Bitcoin longs for every account that is short. That ratio was 2.43 on November 4, before the slide began.
Longs still pay: The funding rate, a fee that keeps futures prices close to spot, is positive. Longs pay shorts 0.0092% every eight hours on OKX, about 6% a year over the past week.
Open bets haven’t shrunk: Open interest on OKX’s Bitcoin futures, the value of all open positions, stands at $3.85 billion, the same as before Monday’s flush.
In plain terms, traders keep buying every dip with borrowed money. That leaves fuel for another round of forced selling if Bitcoin drops through the next support. Bottoms tend to come when funding turns negative and open interest falls hard, a sign that leveraged buyers have given up.
Market Intelligence: Crypto Analyst Predicts Next Crypto to Hit 1 Dollar
Crypto Market Sentiment: Fear at 28 Has Not Marked a Bottom Before
The Crypto Fear & Greed Index, which scores market mood from 0 (extreme fear) to 100 (extreme greed), reads 28 today. Fear is usually read as a buy signal. The history says it is not enough on its own.
We checked every day since February 2018 when the index sat at 28 or lower, 943 days in all, and where Bitcoin stood later.
30 days later: Bitcoin was higher 55% of the time, by a median 1.1%.
90 days later: It was higher only 48% of the time, with a median loss of 2.8%.
Any day, for comparison: Bitcoin was higher 90 days later 54% of the time, by a median 3.6%.
This year’s two bottoms came with real panic. When Bitcoin hit $60,000 on February 6, the index read 9. When it bottomed at $57,800 on July 1, it read 11. Today’s 28 is fear, but it is not capitulation, the moment sellers give up all at once.
Bitcoin Price Analysis: The 2026 Range Puts the Next Floor at $69,600
On the weekly chart, where each candle covers one week, Bitcoin has spent 2026 in a wide range. The low is $57,800 from July 1 and the high is $87,396 from late September. The midpoint is $72,598, almost exactly where Bitcoin trades now.
The price lost its 50-week exponential moving average (EMA), an average that gives recent prices more weight, at $78,219. Its 200-week EMA sits at $69,597. Bitcoin closed below that line for 16 weeks this year, in February and March and again from June to mid-August, and both of the year’s bottoms formed during those stretches.
Resistance: $78,219, the 50-week EMA, then $82,850, the May high, and $87,396, the top of the range.
Support: $69,597, the 200-week EMA, then $65,000, the March low. Below that, $60,000, the February low, and $57,800, the July bottom.
BTCUSDT 1W chart. Source: TradingView.
Outlook Trigger Level to watch Rebound A weekly close back above $78,219 $82,850, the May high, then $87,396 Holding pattern Weekly closes between $69,597 and $78,219 A range around the $72,598 midpoint Sell-off A weekly close below $69,597 $65,000, then the $60,000 and $57,800 lows
For the crypto market, three signs would say the bottom is close: the fear index dropping toward the teens, funding turning negative, and open interest falling as longs give up. None has shown up yet. Until they do, the 200-week EMA at $69,597 is the line that separates a pullback inside the 2026 range from a retest of the summer lows.
Market Intelligence: Crypto Analyst Predicts Top Solana Meme Coins to Bid
next
The post Bitcoin Price Crashes to $72,700 as Leveraged Traders Buy the Dip: Is the Bottom In? appeared first on Coinspeaker.
Bitcoin Price Crashes to $72,700 As Leveraged Traders Buy the Dip: Is the Bottom In?
Bitcoin fell below $73,000 on Thursday, November 12, extending a week-long crypto market crash in which traders who bet on a rebound were forced out of their positions again and again.
Bitcoin touched $72,735 on Binance, a hair above Tuesday’s $72,727 low and its weakest price since August 20. It trades at $72,969, down 9.4% from the November 4 close.
BREAKING: $BTC just fell to its lowest level since August.
Over $210 million worth of longs liquidated in the past 24 hours.
The dumping continues… pic.twitter.com/R7NVGivFnD
— Crypto Rover (@cryptorover) November 12, 2026
The altcoins are doing worse. Over seven days, Ethereum has lost 16.4%, Solana 14.7% and XRP 21.3%. CoinGecko values the whole crypto market at $2.42 trillion on Thursday, and Bitcoin makes up 60.5% of it.
Leverage made every drop bigger. More than $1 billion of bets were liquidated on Monday alone, almost all of them longs, the positions that profit only if prices rise. Liquidation means the exchange closes a trade by force once the trader’s collateral runs out, and those forced sales push the price down further.
So is this the flush that ends the crypto market slide, or is there more to come? The data has an answer, and it is not a comforting one.
Four Shocks in Four Days Hit the Crypto Market Crash
The sell-off had no single cause. Four pieces of bad news landed one after another:
Monday, November 9: Reports of a probe involving Nvidia CEO Jensen Huang and stalled U.S.-Iran talks hit risk assets. More than $1.15 billion of crypto positions were liquidated, about $1.04 billion of them longs.
Tuesday, November 10: A hot inflation report raised the odds that the Federal Reserve hikes interest rates in December. Another $723 million was liquidated, roughly $570 million from longs.
Wednesday, November 11: MSCI said it will drop Strategy, the biggest corporate Bitcoin holder, from its stock indexes. After the bell, Nvidia fell 9% as its board weighed removing Huang.
All week: Investors pulled money from U.S. spot Bitcoin ETFs, funds that hold the coin itself, on seven of the first eight trading days of November, about $1.88 billion in all.
Each hit forced out more leveraged longs across the crypto market. Thursday’s slide continued the pattern on a smaller scale. We added up every forced closure in Bitcoin, Ether, Solana, XRP and Dogecoin futures on OKX, one of the largest exchanges, over the past 24 hours. Longs lost $27.6 million, against $12.3 million for shorts.
EXPLORE: Bitcoin Price Slides Toward $73K as Nvidia Plunges 9% and MSCI Drops Saylor’s Strategy
Traders Keep Buying the Dip With Leverage
Big liquidations usually clear out the crowd. This time, the crowd came back.
More traders are long: On OKX, 3.11 accounts hold Bitcoin longs for every account that is short. That ratio was 2.43 on November 4, before the slide began.
Longs still pay: The funding rate, a fee that keeps futures prices close to spot, is positive. Longs pay shorts 0.0092% every eight hours on OKX, about 6% a year over the past week.
Open bets haven’t shrunk: Open interest on OKX’s Bitcoin futures, the value of all open positions, stands at $3.85 billion, the same as before Monday’s flush.
In plain terms, traders keep buying every dip with borrowed money. That leaves fuel for another round of forced selling if Bitcoin drops through the next support. Bottoms tend to come when funding turns negative and open interest falls hard, a sign that leveraged buyers have given up.
Market Intelligence: Crypto Analyst Predicts Next Crypto to Hit 1 Dollar
Crypto Market Sentiment: Fear at 28 Has Not Marked a Bottom Before
The Crypto Fear & Greed Index, which scores market mood from 0 (extreme fear) to 100 (extreme greed), reads 28 today. Fear is usually read as a buy signal. The history says it is not enough on its own.
We checked every day since February 2018 when the index sat at 28 or lower, 943 days in all, and where Bitcoin stood later.
30 days later: Bitcoin was higher 55% of the time, by a median 1.1%.
90 days later: It was higher only 48% of the time, with a median loss of 2.8%.
Any day, for comparison: Bitcoin was higher 90 days later 54% of the time, by a median 3.6%.
This year’s two bottoms came with real panic. When Bitcoin hit $60,000 on February 6, the index read 9. When it bottomed at $57,800 on July 1, it read 11. Today’s 28 is fear, but it is not capitulation, the moment sellers give up all at once.
Bitcoin Price Analysis: The 2026 Range Puts the Next Floor at $69,600
On the weekly chart, where each candle covers one week, Bitcoin has spent 2026 in a wide range. The low is $57,800 from July 1 and the high is $87,396 from late September. The midpoint is $72,598, almost exactly where Bitcoin trades now.
The price lost its 50-week exponential moving average (EMA), an average that gives recent prices more weight, at $78,219. Its 200-week EMA sits at $69,597. Bitcoin closed below that line for 16 weeks this year, in February and March and again from June to mid-August, and both of the year’s bottoms formed during those stretches.
Resistance: $78,219, the 50-week EMA, then $82,850, the May high, and $87,396, the top of the range.
Support: $69,597, the 200-week EMA, then $65,000, the March low. Below that, $60,000, the February low, and $57,800, the July bottom.
BTCUSDT 1W chart. Source: TradingView.
Outlook Trigger Level to watch Rebound A weekly close back above $78,219 $82,850, the May high, then $87,396 Holding pattern Weekly closes between $69,597 and $78,219 A range around the $72,598 midpoint Sell-off A weekly close below $69,597 $65,000, then the $60,000 and $57,800 lows
For the crypto market, three signs would say the bottom is close: the fear index dropping toward the teens, funding turning negative, and open interest falling as longs give up. None has shown up yet. Until they do, the 200-week EMA at $69,597 is the line that separates a pullback inside the 2026 range from a retest of the summer lows.
Market Intelligence: Crypto Analyst Predicts Top Solana Meme Coins to Bid
next
The post Bitcoin Price Crashes to $72,700 as Leveraged Traders Buy the Dip: Is the Bottom In? appeared first on Coinspeaker.
Bitcoin touched $72,735 on Binance, a hair above Tuesday’s $72,727 low and its weakest price since August 20. It trades at $72,969, down 9.4% from the November 4 close.
BREAKING: $BTC just fell to its lowest level since August.
Over $210 million worth of longs liquidated in the past 24 hours.
The dumping continues… pic.twitter.com/R7NVGivFnD
— Crypto Rover (@cryptorover) November 12, 2026
The altcoins are doing worse. Over seven days, Ethereum has lost 16.4%, Solana 14.7% and XRP 21.3%. CoinGecko values the whole crypto market at $2.42 trillion on Thursday, and Bitcoin makes up 60.5% of it.
Leverage made every drop bigger. More than $1 billion of bets were liquidated on Monday alone, almost all of them longs, the positions that profit only if prices rise. Liquidation means the exchange closes a trade by force once the trader’s collateral runs out, and those forced sales push the price down further.
So is this the flush that ends the crypto market slide, or is there more to come? The data has an answer, and it is not a comforting one.
Four Shocks in Four Days Hit the Crypto Market Crash
The sell-off had no single cause. Four pieces of bad news landed one after another:
Monday, November 9: Reports of a probe involving Nvidia CEO Jensen Huang and stalled U.S.-Iran talks hit risk assets. More than $1.15 billion of crypto positions were liquidated, about $1.04 billion of them longs.
Tuesday, November 10: A hot inflation report raised the odds that the Federal Reserve hikes interest rates in December. Another $723 million was liquidated, roughly $570 million from longs.
Wednesday, November 11: MSCI said it will drop Strategy, the biggest corporate Bitcoin holder, from its stock indexes. After the bell, Nvidia fell 9% as its board weighed removing Huang.
All week: Investors pulled money from U.S. spot Bitcoin ETFs, funds that hold the coin itself, on seven of the first eight trading days of November, about $1.88 billion in all.
Each hit forced out more leveraged longs across the crypto market. Thursday’s slide continued the pattern on a smaller scale. We added up every forced closure in Bitcoin, Ether, Solana, XRP and Dogecoin futures on OKX, one of the largest exchanges, over the past 24 hours. Longs lost $27.6 million, against $12.3 million for shorts.
EXPLORE: Bitcoin Price Slides Toward $73K as Nvidia Plunges 9% and MSCI Drops Saylor’s Strategy
Traders Keep Buying the Dip With Leverage
Big liquidations usually clear out the crowd. This time, the crowd came back.
More traders are long: On OKX, 3.11 accounts hold Bitcoin longs for every account that is short. That ratio was 2.43 on November 4, before the slide began.
Longs still pay: The funding rate, a fee that keeps futures prices close to spot, is positive. Longs pay shorts 0.0092% every eight hours on OKX, about 6% a year over the past week.
Open bets haven’t shrunk: Open interest on OKX’s Bitcoin futures, the value of all open positions, stands at $3.85 billion, the same as before Monday’s flush.
In plain terms, traders keep buying every dip with borrowed money. That leaves fuel for another round of forced selling if Bitcoin drops through the next support. Bottoms tend to come when funding turns negative and open interest falls hard, a sign that leveraged buyers have given up.
Market Intelligence: Crypto Analyst Predicts Next Crypto to Hit 1 Dollar
Crypto Market Sentiment: Fear at 28 Has Not Marked a Bottom Before
The Crypto Fear & Greed Index, which scores market mood from 0 (extreme fear) to 100 (extreme greed), reads 28 today. Fear is usually read as a buy signal. The history says it is not enough on its own.
We checked every day since February 2018 when the index sat at 28 or lower, 943 days in all, and where Bitcoin stood later.
30 days later: Bitcoin was higher 55% of the time, by a median 1.1%.
90 days later: It was higher only 48% of the time, with a median loss of 2.8%.
Any day, for comparison: Bitcoin was higher 90 days later 54% of the time, by a median 3.6%.
This year’s two bottoms came with real panic. When Bitcoin hit $60,000 on February 6, the index read 9. When it bottomed at $57,800 on July 1, it read 11. Today’s 28 is fear, but it is not capitulation, the moment sellers give up all at once.
Bitcoin Price Analysis: The 2026 Range Puts the Next Floor at $69,600
On the weekly chart, where each candle covers one week, Bitcoin has spent 2026 in a wide range. The low is $57,800 from July 1 and the high is $87,396 from late September. The midpoint is $72,598, almost exactly where Bitcoin trades now.
The price lost its 50-week exponential moving average (EMA), an average that gives recent prices more weight, at $78,219. Its 200-week EMA sits at $69,597. Bitcoin closed below that line for 16 weeks this year, in February and March and again from June to mid-August, and both of the year’s bottoms formed during those stretches.
Resistance: $78,219, the 50-week EMA, then $82,850, the May high, and $87,396, the top of the range.
Support: $69,597, the 200-week EMA, then $65,000, the March low. Below that, $60,000, the February low, and $57,800, the July bottom.
BTCUSDT 1W chart. Source: TradingView.
Outlook Trigger Level to watch Rebound A weekly close back above $78,219 $82,850, the May high, then $87,396 Holding pattern Weekly closes between $69,597 and $78,219 A range around the $72,598 midpoint Sell-off A weekly close below $69,597 $65,000, then the $60,000 and $57,800 lows
For the crypto market, three signs would say the bottom is close: the fear index dropping toward the teens, funding turning negative, and open interest falling as longs give up. None has shown up yet. Until they do, the 200-week EMA at $69,597 is the line that separates a pullback inside the 2026 range from a retest of the summer lows.
Market Intelligence: Crypto Analyst Predicts Top Solana Meme Coins to Bid
next
The post Bitcoin Price Crashes to $72,700 as Leveraged Traders Buy the Dip: Is the Bottom In? appeared first on Coinspeaker.
439
·
--

Article
Perplexity AI Predicts a Huge Move Pudgy Penguins: Is PENGU Set to 150X?Perplexity AI predicts an intriguing development regarding Pudgy Penguins (PENGU). This forecast is not a typical bullish outlook; instead, it outlines an extreme, highly imaginative scenario based on a hypothetical landmark event. While the outcome isn’t impossible, it remains quite unlikely.
The prediction suggests that Pudgy Penguins could secure a significant multi-year partnership with a major global entertainment and consumer brand conglomerate. This partnership would elevate the Penguins’ intellectual property (IP) to a mainstream cultural franchise.
Such a development could include producing large-scale animated content, launching global retail product lines, and integrating the PENGU token into fan engagement, merchandise, and digital experiences. This transformation would shift the PENGU token from being a crypto-native meme asset to a widely recognized consumer brand token.
(SOURCE: Perplexity AI Predicts a PENGU Explosion)
PENGU Technical Analysis: Can Pudgy Penguins Reclaim $0.01 in November?
On higher timeframes, PENGU has been consolidating in the $0.0059 to $0.0062 range after a prolonged downtrend from earlier peaks. Price continues to hold above recent lows but faces overhead resistance in the $0.007 to $0.008 zone.
In a typical bull market, a sustained breakout above the $0.012 to $0.015 range would indicate intermediate strength and pave the way for higher recovery targets.
(SOURCE: TradingView)
If mainstream entertainment and retail franchise adoption become extreme, breaking through key resistance levels could trigger powerful measured-move extensions and multi-cycle Fibonacci projections based on the longer-term foundation.
Currently, momentum indicators are neutral to oversold, leaving substantial room for upward movement into the extreme overbought readings often seen during parabolic advances in meme assets.
Key near-term support levels are around $0.00680 to $0.006. Holding above these levels would help maintain the broader market structure.
Market Intelligence: Crypto Analyst Predicts Best Low-Cap Crypto
Recent PENGU Announcements that Could Supercharge a Pudgy Penguins Move
Pudgy Penguins launches new product for its community.@pudgypenguins has just dropped the 'Flake Finder' tool, designed to let its community rediscover forgotten crypto.
By entering their wallet addresses, participants can use the tool to identify idle and forgotten crypto… pic.twitter.com/F9c2yN6x25
— BSCN (@BSCNews) November 9, 2026
Pudgy Penguins (PENGU) continues to expand beyond NFTs into mainstream consumer products and retail, providing several constructive catalysts. In October 2026, the project launched The Huddle, a central community hub for holders and fans.
PENGU became available on SoFi, a U.S. banking app with more than 15 million members, improving accessibility for traditional finance users.
High-profile partnerships included a limited-edition collaboration with LINE FRIENDS that placed merchandise in flagship stores in Seoul, Shanghai, and Tokyo, plus a deal with Kung Fu Tea across roughly 330 U.S. locations featuring branded drinks and exclusive items.
The brand also appeared at New York Comic Con and secured placement in Walmart’s holiday toy catalog. Looking ahead, a Medicom Toy BE@RBRICK collaboration is scheduled for December 12, 2026, while the team continues rolling out trading-card game expansions and physical collectibles.
These real-world brand-building efforts and growing retail distribution could support renewed interest and a more bullish outlook for PENGU.
Perplexity AI Predicts Pudgy Penguins Rally: Could PENGU Moon 150x by 2027?
Under this highly speculative scenario, and assuming a full-blown crypto bull market returns, Perplexity AI predicts that Pudgy Penguins (PENGU) could reach somewhere between $0.5 and $0.8, with a stretch target of $1.40+ by January 1, 2027.
This remains pure speculation and entertainment, not a realistic base-case outlook. The catalyst would require extraordinary mainstream brand and entertainment adoption that is currently highly unlikely.
EXPLORE: Why Is Crypto Crashing Today? Bitcoin Falls Below $73K as Zcash (ZEC) Leads Crypto Losses
next
The post Perplexity AI Predicts a Huge Move Pudgy Penguins: Is PENGU Set to 150X? appeared first on Coinspeaker.
Perplexity AI Predicts a Huge Move Pudgy Penguins: Is PENGU Set to 150X?
Perplexity AI predicts an intriguing development regarding Pudgy Penguins (PENGU). This forecast is not a typical bullish outlook; instead, it outlines an extreme, highly imaginative scenario based on a hypothetical landmark event. While the outcome isn’t impossible, it remains quite unlikely.
The prediction suggests that Pudgy Penguins could secure a significant multi-year partnership with a major global entertainment and consumer brand conglomerate. This partnership would elevate the Penguins’ intellectual property (IP) to a mainstream cultural franchise.
Such a development could include producing large-scale animated content, launching global retail product lines, and integrating the PENGU token into fan engagement, merchandise, and digital experiences. This transformation would shift the PENGU token from being a crypto-native meme asset to a widely recognized consumer brand token.
(SOURCE: Perplexity AI Predicts a PENGU Explosion)
PENGU Technical Analysis: Can Pudgy Penguins Reclaim $0.01 in November?
On higher timeframes, PENGU has been consolidating in the $0.0059 to $0.0062 range after a prolonged downtrend from earlier peaks. Price continues to hold above recent lows but faces overhead resistance in the $0.007 to $0.008 zone.
In a typical bull market, a sustained breakout above the $0.012 to $0.015 range would indicate intermediate strength and pave the way for higher recovery targets.
(SOURCE: TradingView)
If mainstream entertainment and retail franchise adoption become extreme, breaking through key resistance levels could trigger powerful measured-move extensions and multi-cycle Fibonacci projections based on the longer-term foundation.
Currently, momentum indicators are neutral to oversold, leaving substantial room for upward movement into the extreme overbought readings often seen during parabolic advances in meme assets.
Key near-term support levels are around $0.00680 to $0.006. Holding above these levels would help maintain the broader market structure.
Market Intelligence: Crypto Analyst Predicts Best Low-Cap Crypto
Recent PENGU Announcements that Could Supercharge a Pudgy Penguins Move
Pudgy Penguins launches new product for its community.@pudgypenguins has just dropped the 'Flake Finder' tool, designed to let its community rediscover forgotten crypto.
By entering their wallet addresses, participants can use the tool to identify idle and forgotten crypto… pic.twitter.com/F9c2yN6x25
— BSCN (@BSCNews) November 9, 2026
Pudgy Penguins (PENGU) continues to expand beyond NFTs into mainstream consumer products and retail, providing several constructive catalysts. In October 2026, the project launched The Huddle, a central community hub for holders and fans.
PENGU became available on SoFi, a U.S. banking app with more than 15 million members, improving accessibility for traditional finance users.
High-profile partnerships included a limited-edition collaboration with LINE FRIENDS that placed merchandise in flagship stores in Seoul, Shanghai, and Tokyo, plus a deal with Kung Fu Tea across roughly 330 U.S. locations featuring branded drinks and exclusive items.
The brand also appeared at New York Comic Con and secured placement in Walmart’s holiday toy catalog. Looking ahead, a Medicom Toy BE@RBRICK collaboration is scheduled for December 12, 2026, while the team continues rolling out trading-card game expansions and physical collectibles.
These real-world brand-building efforts and growing retail distribution could support renewed interest and a more bullish outlook for PENGU.
Perplexity AI Predicts Pudgy Penguins Rally: Could PENGU Moon 150x by 2027?
Under this highly speculative scenario, and assuming a full-blown crypto bull market returns, Perplexity AI predicts that Pudgy Penguins (PENGU) could reach somewhere between $0.5 and $0.8, with a stretch target of $1.40+ by January 1, 2027.
This remains pure speculation and entertainment, not a realistic base-case outlook. The catalyst would require extraordinary mainstream brand and entertainment adoption that is currently highly unlikely.
EXPLORE: Why Is Crypto Crashing Today? Bitcoin Falls Below $73K as Zcash (ZEC) Leads Crypto Losses
next
The post Perplexity AI Predicts a Huge Move Pudgy Penguins: Is PENGU Set to 150X? appeared first on Coinspeaker.
The prediction suggests that Pudgy Penguins could secure a significant multi-year partnership with a major global entertainment and consumer brand conglomerate. This partnership would elevate the Penguins’ intellectual property (IP) to a mainstream cultural franchise.
Such a development could include producing large-scale animated content, launching global retail product lines, and integrating the PENGU token into fan engagement, merchandise, and digital experiences. This transformation would shift the PENGU token from being a crypto-native meme asset to a widely recognized consumer brand token.
(SOURCE: Perplexity AI Predicts a PENGU Explosion)
PENGU Technical Analysis: Can Pudgy Penguins Reclaim $0.01 in November?
On higher timeframes, PENGU has been consolidating in the $0.0059 to $0.0062 range after a prolonged downtrend from earlier peaks. Price continues to hold above recent lows but faces overhead resistance in the $0.007 to $0.008 zone.
In a typical bull market, a sustained breakout above the $0.012 to $0.015 range would indicate intermediate strength and pave the way for higher recovery targets.
(SOURCE: TradingView)
If mainstream entertainment and retail franchise adoption become extreme, breaking through key resistance levels could trigger powerful measured-move extensions and multi-cycle Fibonacci projections based on the longer-term foundation.
Currently, momentum indicators are neutral to oversold, leaving substantial room for upward movement into the extreme overbought readings often seen during parabolic advances in meme assets.
Key near-term support levels are around $0.00680 to $0.006. Holding above these levels would help maintain the broader market structure.
Market Intelligence: Crypto Analyst Predicts Best Low-Cap Crypto
Recent PENGU Announcements that Could Supercharge a Pudgy Penguins Move
Pudgy Penguins launches new product for its community.@pudgypenguins has just dropped the 'Flake Finder' tool, designed to let its community rediscover forgotten crypto.
By entering their wallet addresses, participants can use the tool to identify idle and forgotten crypto… pic.twitter.com/F9c2yN6x25
— BSCN (@BSCNews) November 9, 2026
Pudgy Penguins (PENGU) continues to expand beyond NFTs into mainstream consumer products and retail, providing several constructive catalysts. In October 2026, the project launched The Huddle, a central community hub for holders and fans.
PENGU became available on SoFi, a U.S. banking app with more than 15 million members, improving accessibility for traditional finance users.
High-profile partnerships included a limited-edition collaboration with LINE FRIENDS that placed merchandise in flagship stores in Seoul, Shanghai, and Tokyo, plus a deal with Kung Fu Tea across roughly 330 U.S. locations featuring branded drinks and exclusive items.
The brand also appeared at New York Comic Con and secured placement in Walmart’s holiday toy catalog. Looking ahead, a Medicom Toy BE@RBRICK collaboration is scheduled for December 12, 2026, while the team continues rolling out trading-card game expansions and physical collectibles.
These real-world brand-building efforts and growing retail distribution could support renewed interest and a more bullish outlook for PENGU.
Perplexity AI Predicts Pudgy Penguins Rally: Could PENGU Moon 150x by 2027?
Under this highly speculative scenario, and assuming a full-blown crypto bull market returns, Perplexity AI predicts that Pudgy Penguins (PENGU) could reach somewhere between $0.5 and $0.8, with a stretch target of $1.40+ by January 1, 2027.
This remains pure speculation and entertainment, not a realistic base-case outlook. The catalyst would require extraordinary mainstream brand and entertainment adoption that is currently highly unlikely.
EXPLORE: Why Is Crypto Crashing Today? Bitcoin Falls Below $73K as Zcash (ZEC) Leads Crypto Losses
next
The post Perplexity AI Predicts a Huge Move Pudgy Penguins: Is PENGU Set to 150X? appeared first on Coinspeaker.
3
795
·
--
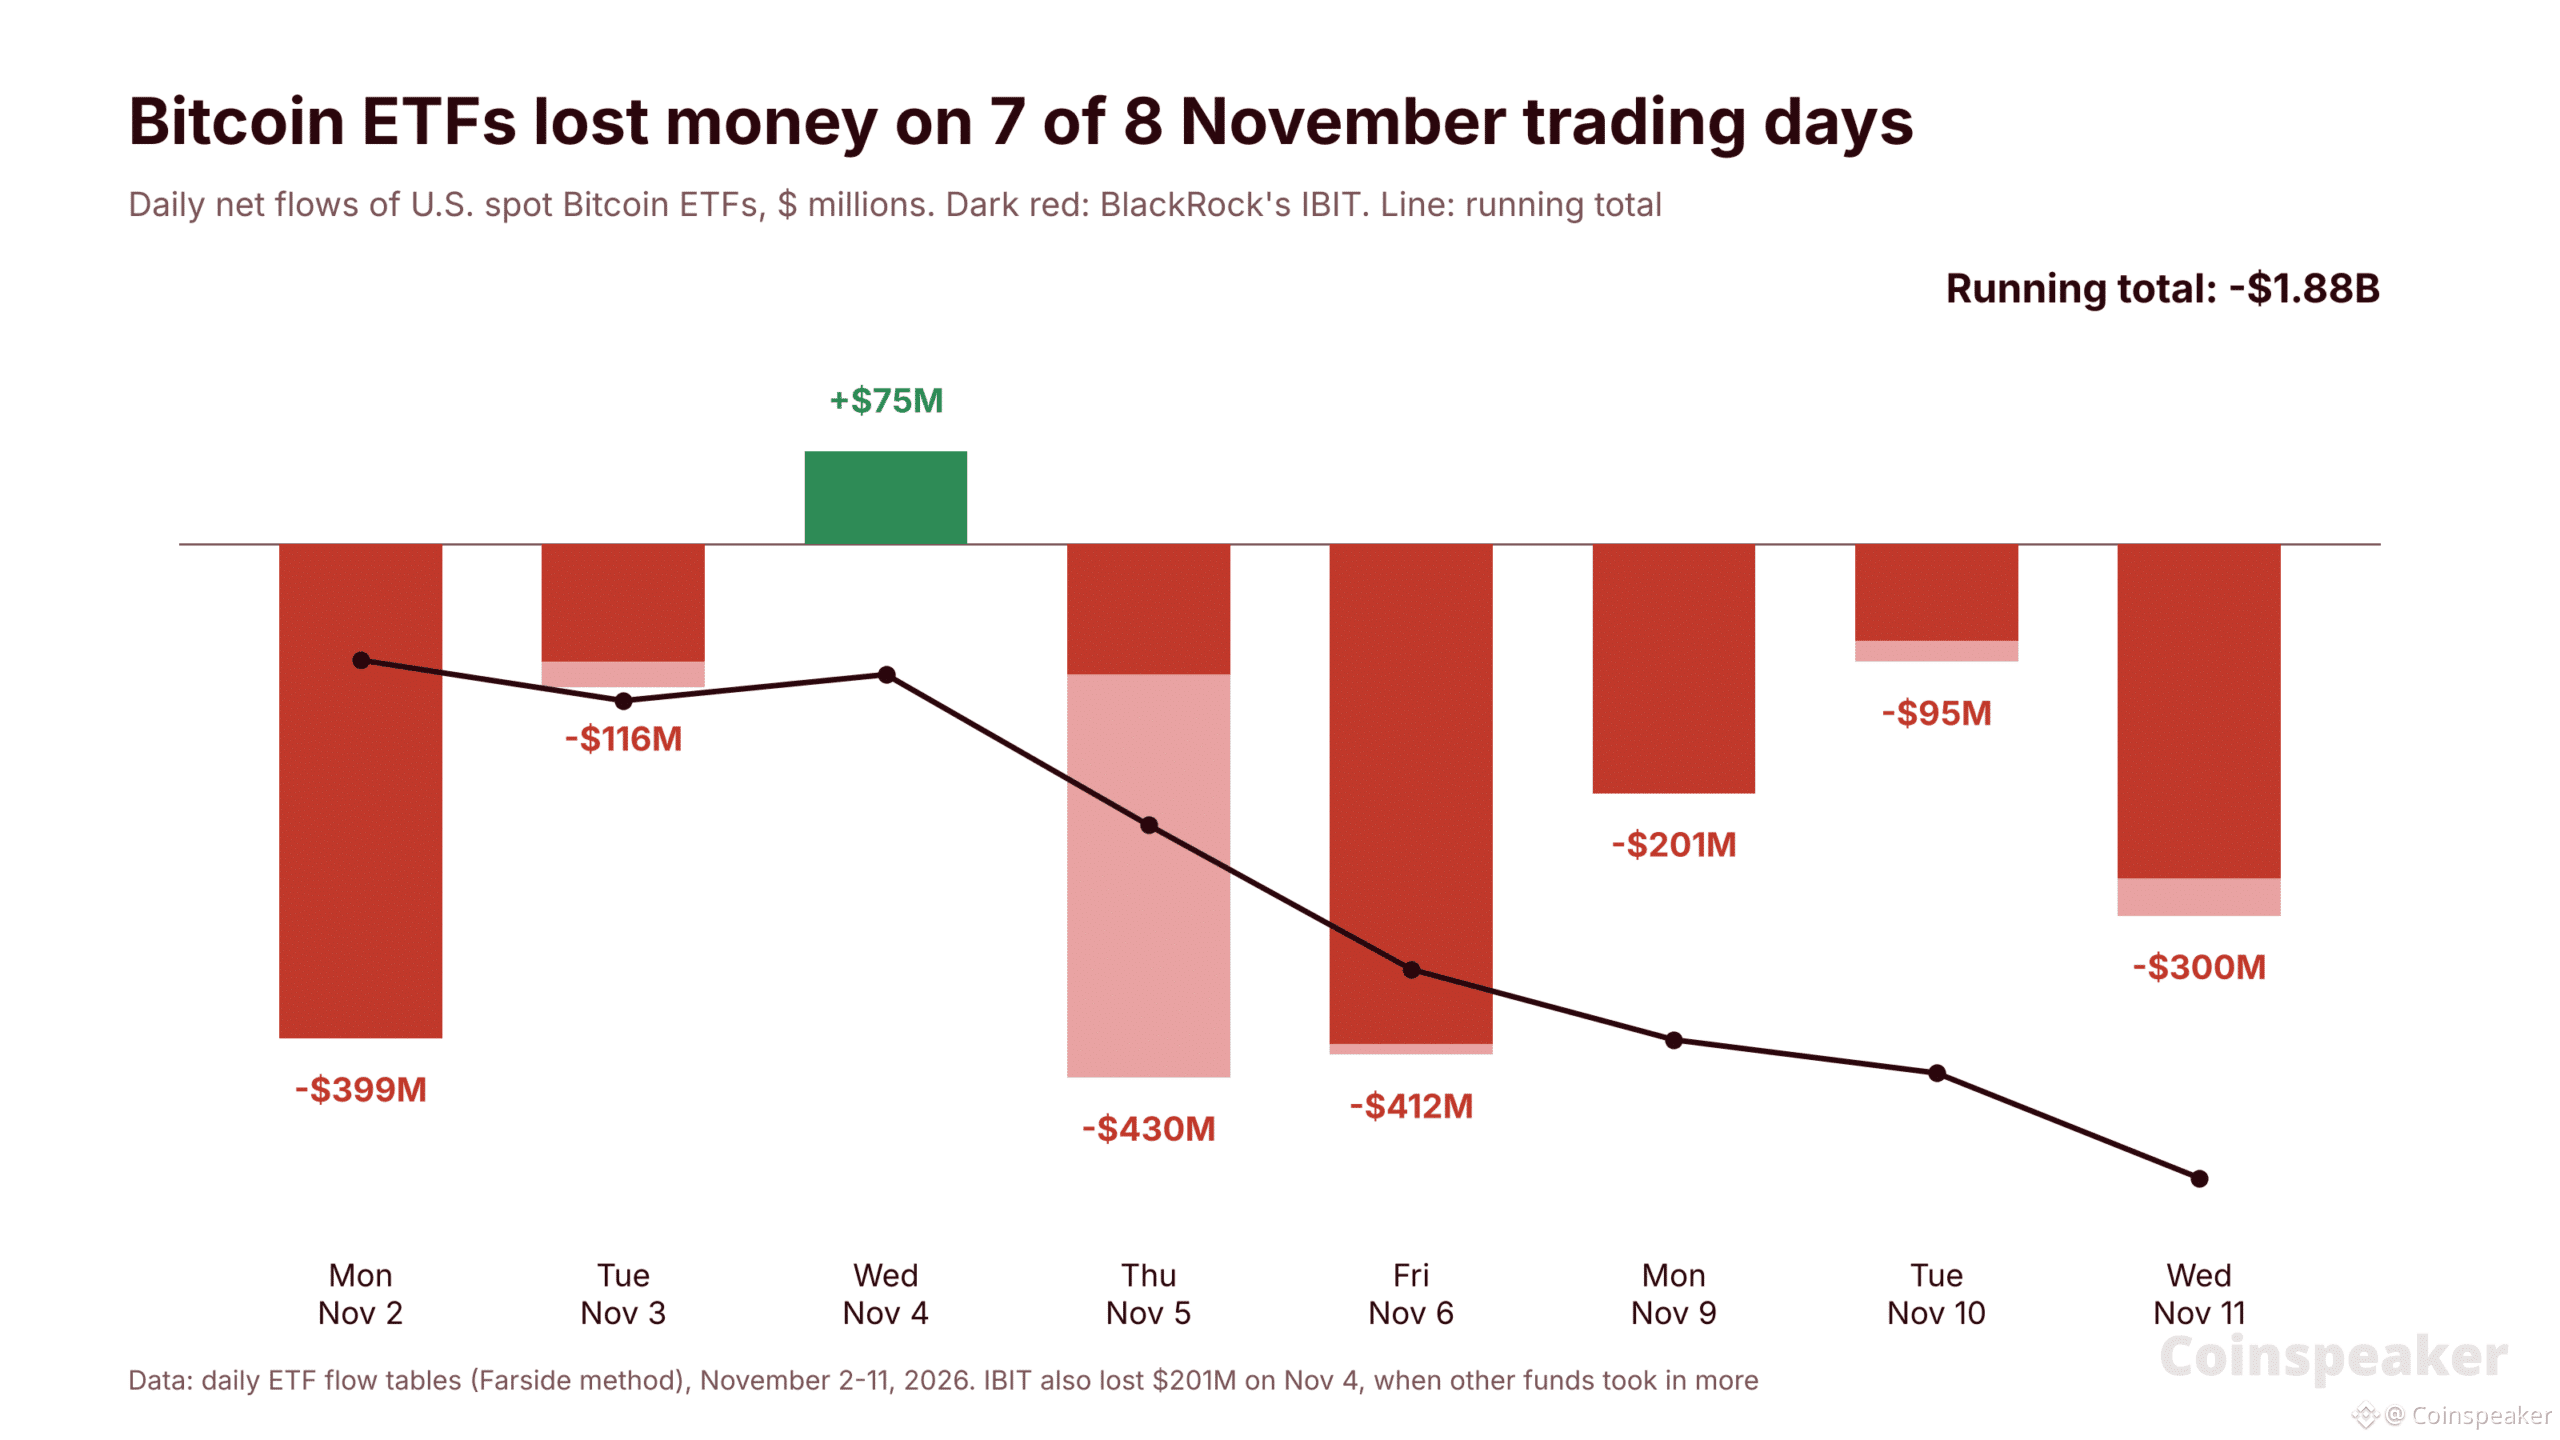
Article
Bitcoin Price Slides Toward $73K As Nvidia Plunges 9% and MSCI Drops Saylor’s StrategyIn Bitcoin news, the coin fell from $74,811 to $73,480 within two hours of the U.S. close. Bitcoin slipped overnight after two shocks hit U.S. markets after Wednesday’s close. Nvidia shares fell about 9% in after-hours trading on a new report about CEO Jensen Huang. Index provider MSCI also confirmed it will remove Strategy, the largest corporate Bitcoin holder, from its global indexes.
It trades at $73,588 on Binance on Thursday morning, down 0.4% in 24 hours and 5.8% in a week.
The funds are not helping. U.S. spot Bitcoin exchange-traded funds (ETFs) lost $299.8 million on Wednesday, their fifth straight day of outflows. Nasdaq futures are down 0.9%.
Bitcoin ETFs Shed $300 Million, Ether Funds Lose $145 Million
According to SoSoValue, U.S. spot Bitcoin ETFs recorded $300 million in net outflows on November 11, while Morgan Stanley's MSBT led individual fund inflows with $8.96 million. Spot Ethereum ETFs saw $145 million in… pic.twitter.com/5sn88B2JQX
— Wu Blockchain (@WuBlockchain) November 12, 2026
So what happened, and how much of the selling comes from the ETFs?
Two Shocks After the Close: Nvidia and MSCI
The first hit came from Nvidia, the world’s most valuable chipmaker. The New York Times reported on Wednesday evening that Huang had a second relationship with a senior employee who reports to him. The Wall Street Journal reported that Nvidia’s board is preparing to remove him as CEO.
Nvidia had closed the day up 2.9% at $173.73. Within two hours, it traded at $157.99, down 9.1%. It is still down 8.6% before Thursday’s open. Nvidia has lost about 15% since last Friday. It first fell on Monday, after its board opened a separate probe into reports that Huang was the target of a foreign intelligence effort.
Bitcoin has traded closely with tech stocks this year, and it fell with them. Nasdaq 100 futures dropped 1.1% in the same two hours.
The second hit is closer to crypto. MSCI, whose indexes guide trillions of dollars in index funds, will delete Strategy from its global indexes after the market close on November 30. It ruled that Strategy looks more like an investment fund holding Bitcoin than an operating business. Japan’s Metaplanet and Upexi are also being removed.
Funds that track those indexes will have to sell their Strategy shares. JPMorgan earlier estimated that selling at about $2.8 billion. Strategy says the funds hold about 13 million shares, 3.1% of its stock. Its shares are down 1.8% before the open.
For Bitcoin news, that matters beyond one stock. Strategy is the steadiest corporate buyer of Bitcoin. Fewer index buyers for its shares could make it harder and more costly to raise money for new purchases.
Market Intelligence: Crypto Analyst Predicts Best Low-Cap Crypto
Bitcoin News From the ETFs: Seven Red Days Out of Eight
The ETF selling started before either shock. To see how big the ETF side of this Bitcoin news is, we added up the daily net flows of the U.S. spot Bitcoin ETFs for every trading day in November.
Red days: seven of the eight trading days so far. Only November 4 saw net money come in, $74.6 million.
Total: $1.88 billion has left the funds this month. The last five days alone account for $1.44 billion.
Who is selling: BlackRock’s iShares Bitcoin Trust (IBIT), the largest fund, lost $1.77 billion. That is 94% of the total. On Wednesday it lost $269.7 million of the $299.8 million.
The streak is not a record yet. The longest run of outflows this year lasted 13 trading days in May and June, just before Bitcoin fell below $60,000.
The Fed adds to the pressure. October’s hot inflation report on Tuesday pushed the odds of a December rate hike on Polymarket to about 97%. Higher rates make cash and bonds pay more, which tends to pull money out of funds like these.
EXPLORE: Why Is Crypto Crashing Today? Bitcoin Falls Below $73K as Zcash (ZEC) Leads Crypto Losses
Bitcoin Price Analysis: Can BTC Hold $72,727?
BTC trades at $73,588, holding above Tuesday’s low of $72,727, its lowest price since August 20. On the daily chart, where each candle covers one day, it sits below both of its exponential moving averages (EMAs), averages that give recent prices more weight. The 50-day EMA stands at $78,696 and the 200-day EMA at $76,422.
Resistance: $74,811, Wednesday’s high, then $76,422, the 200-day EMA. Above that, $78,696, the 50-day EMA.
Support: $73,390, Wednesday’s low, then $72,727, Tuesday’s low. Below that, $68,902, the August 20 low.
BTCUSDT 1D chart. Source: TradingView.
Outlook Trigger Level to watch Rebound A daily close above $74,811 and ETF inflows return The 200-day EMA at $76,422 Holding pattern BTC stays between $72,727 and $74,811 A range until the Nvidia and ETF selling fades Sell-off A daily close below $72,727 $68,902, the August 20 low
The next Bitcoin news to watch is Thursday’s ETF flow data and how Nvidia trades at the open. A sixth day of outflows and a weak tech session would put $72,727 to the test.
Market Intelligence: Crypto Analyst Reveals Upcoming Coinbase Listings
next
The post Bitcoin Price Slides Toward $73K as Nvidia Plunges 9% and MSCI Drops Saylor’s Strategy appeared first on Coinspeaker.
Bitcoin Price Slides Toward $73K As Nvidia Plunges 9% and MSCI Drops Saylor’s Strategy
In Bitcoin news, the coin fell from $74,811 to $73,480 within two hours of the U.S. close. Bitcoin slipped overnight after two shocks hit U.S. markets after Wednesday’s close. Nvidia shares fell about 9% in after-hours trading on a new report about CEO Jensen Huang. Index provider MSCI also confirmed it will remove Strategy, the largest corporate Bitcoin holder, from its global indexes.
It trades at $73,588 on Binance on Thursday morning, down 0.4% in 24 hours and 5.8% in a week.
The funds are not helping. U.S. spot Bitcoin exchange-traded funds (ETFs) lost $299.8 million on Wednesday, their fifth straight day of outflows. Nasdaq futures are down 0.9%.
Bitcoin ETFs Shed $300 Million, Ether Funds Lose $145 Million
According to SoSoValue, U.S. spot Bitcoin ETFs recorded $300 million in net outflows on November 11, while Morgan Stanley's MSBT led individual fund inflows with $8.96 million. Spot Ethereum ETFs saw $145 million in… pic.twitter.com/5sn88B2JQX
— Wu Blockchain (@WuBlockchain) November 12, 2026
So what happened, and how much of the selling comes from the ETFs?
Two Shocks After the Close: Nvidia and MSCI
The first hit came from Nvidia, the world’s most valuable chipmaker. The New York Times reported on Wednesday evening that Huang had a second relationship with a senior employee who reports to him. The Wall Street Journal reported that Nvidia’s board is preparing to remove him as CEO.
Nvidia had closed the day up 2.9% at $173.73. Within two hours, it traded at $157.99, down 9.1%. It is still down 8.6% before Thursday’s open. Nvidia has lost about 15% since last Friday. It first fell on Monday, after its board opened a separate probe into reports that Huang was the target of a foreign intelligence effort.
Bitcoin has traded closely with tech stocks this year, and it fell with them. Nasdaq 100 futures dropped 1.1% in the same two hours.
The second hit is closer to crypto. MSCI, whose indexes guide trillions of dollars in index funds, will delete Strategy from its global indexes after the market close on November 30. It ruled that Strategy looks more like an investment fund holding Bitcoin than an operating business. Japan’s Metaplanet and Upexi are also being removed.
Funds that track those indexes will have to sell their Strategy shares. JPMorgan earlier estimated that selling at about $2.8 billion. Strategy says the funds hold about 13 million shares, 3.1% of its stock. Its shares are down 1.8% before the open.
For Bitcoin news, that matters beyond one stock. Strategy is the steadiest corporate buyer of Bitcoin. Fewer index buyers for its shares could make it harder and more costly to raise money for new purchases.
Market Intelligence: Crypto Analyst Predicts Best Low-Cap Crypto
Bitcoin News From the ETFs: Seven Red Days Out of Eight
The ETF selling started before either shock. To see how big the ETF side of this Bitcoin news is, we added up the daily net flows of the U.S. spot Bitcoin ETFs for every trading day in November.
Red days: seven of the eight trading days so far. Only November 4 saw net money come in, $74.6 million.
Total: $1.88 billion has left the funds this month. The last five days alone account for $1.44 billion.
Who is selling: BlackRock’s iShares Bitcoin Trust (IBIT), the largest fund, lost $1.77 billion. That is 94% of the total. On Wednesday it lost $269.7 million of the $299.8 million.
The streak is not a record yet. The longest run of outflows this year lasted 13 trading days in May and June, just before Bitcoin fell below $60,000.
The Fed adds to the pressure. October’s hot inflation report on Tuesday pushed the odds of a December rate hike on Polymarket to about 97%. Higher rates make cash and bonds pay more, which tends to pull money out of funds like these.
EXPLORE: Why Is Crypto Crashing Today? Bitcoin Falls Below $73K as Zcash (ZEC) Leads Crypto Losses
Bitcoin Price Analysis: Can BTC Hold $72,727?
BTC trades at $73,588, holding above Tuesday’s low of $72,727, its lowest price since August 20. On the daily chart, where each candle covers one day, it sits below both of its exponential moving averages (EMAs), averages that give recent prices more weight. The 50-day EMA stands at $78,696 and the 200-day EMA at $76,422.
Resistance: $74,811, Wednesday’s high, then $76,422, the 200-day EMA. Above that, $78,696, the 50-day EMA.
Support: $73,390, Wednesday’s low, then $72,727, Tuesday’s low. Below that, $68,902, the August 20 low.
BTCUSDT 1D chart. Source: TradingView.
Outlook Trigger Level to watch Rebound A daily close above $74,811 and ETF inflows return The 200-day EMA at $76,422 Holding pattern BTC stays between $72,727 and $74,811 A range until the Nvidia and ETF selling fades Sell-off A daily close below $72,727 $68,902, the August 20 low
The next Bitcoin news to watch is Thursday’s ETF flow data and how Nvidia trades at the open. A sixth day of outflows and a weak tech session would put $72,727 to the test.
Market Intelligence: Crypto Analyst Reveals Upcoming Coinbase Listings
next
The post Bitcoin Price Slides Toward $73K as Nvidia Plunges 9% and MSCI Drops Saylor’s Strategy appeared first on Coinspeaker.
It trades at $73,588 on Binance on Thursday morning, down 0.4% in 24 hours and 5.8% in a week.
The funds are not helping. U.S. spot Bitcoin exchange-traded funds (ETFs) lost $299.8 million on Wednesday, their fifth straight day of outflows. Nasdaq futures are down 0.9%.
Bitcoin ETFs Shed $300 Million, Ether Funds Lose $145 Million
According to SoSoValue, U.S. spot Bitcoin ETFs recorded $300 million in net outflows on November 11, while Morgan Stanley's MSBT led individual fund inflows with $8.96 million. Spot Ethereum ETFs saw $145 million in… pic.twitter.com/5sn88B2JQX
— Wu Blockchain (@WuBlockchain) November 12, 2026
So what happened, and how much of the selling comes from the ETFs?
Two Shocks After the Close: Nvidia and MSCI
The first hit came from Nvidia, the world’s most valuable chipmaker. The New York Times reported on Wednesday evening that Huang had a second relationship with a senior employee who reports to him. The Wall Street Journal reported that Nvidia’s board is preparing to remove him as CEO.
Nvidia had closed the day up 2.9% at $173.73. Within two hours, it traded at $157.99, down 9.1%. It is still down 8.6% before Thursday’s open. Nvidia has lost about 15% since last Friday. It first fell on Monday, after its board opened a separate probe into reports that Huang was the target of a foreign intelligence effort.
Bitcoin has traded closely with tech stocks this year, and it fell with them. Nasdaq 100 futures dropped 1.1% in the same two hours.
The second hit is closer to crypto. MSCI, whose indexes guide trillions of dollars in index funds, will delete Strategy from its global indexes after the market close on November 30. It ruled that Strategy looks more like an investment fund holding Bitcoin than an operating business. Japan’s Metaplanet and Upexi are also being removed.
Funds that track those indexes will have to sell their Strategy shares. JPMorgan earlier estimated that selling at about $2.8 billion. Strategy says the funds hold about 13 million shares, 3.1% of its stock. Its shares are down 1.8% before the open.
For Bitcoin news, that matters beyond one stock. Strategy is the steadiest corporate buyer of Bitcoin. Fewer index buyers for its shares could make it harder and more costly to raise money for new purchases.
Market Intelligence: Crypto Analyst Predicts Best Low-Cap Crypto
Bitcoin News From the ETFs: Seven Red Days Out of Eight
The ETF selling started before either shock. To see how big the ETF side of this Bitcoin news is, we added up the daily net flows of the U.S. spot Bitcoin ETFs for every trading day in November.
Red days: seven of the eight trading days so far. Only November 4 saw net money come in, $74.6 million.
Total: $1.88 billion has left the funds this month. The last five days alone account for $1.44 billion.
Who is selling: BlackRock’s iShares Bitcoin Trust (IBIT), the largest fund, lost $1.77 billion. That is 94% of the total. On Wednesday it lost $269.7 million of the $299.8 million.
The streak is not a record yet. The longest run of outflows this year lasted 13 trading days in May and June, just before Bitcoin fell below $60,000.
The Fed adds to the pressure. October’s hot inflation report on Tuesday pushed the odds of a December rate hike on Polymarket to about 97%. Higher rates make cash and bonds pay more, which tends to pull money out of funds like these.
EXPLORE: Why Is Crypto Crashing Today? Bitcoin Falls Below $73K as Zcash (ZEC) Leads Crypto Losses
Bitcoin Price Analysis: Can BTC Hold $72,727?
BTC trades at $73,588, holding above Tuesday’s low of $72,727, its lowest price since August 20. On the daily chart, where each candle covers one day, it sits below both of its exponential moving averages (EMAs), averages that give recent prices more weight. The 50-day EMA stands at $78,696 and the 200-day EMA at $76,422.
Resistance: $74,811, Wednesday’s high, then $76,422, the 200-day EMA. Above that, $78,696, the 50-day EMA.
Support: $73,390, Wednesday’s low, then $72,727, Tuesday’s low. Below that, $68,902, the August 20 low.
BTCUSDT 1D chart. Source: TradingView.
Outlook Trigger Level to watch Rebound A daily close above $74,811 and ETF inflows return The 200-day EMA at $76,422 Holding pattern BTC stays between $72,727 and $74,811 A range until the Nvidia and ETF selling fades Sell-off A daily close below $72,727 $68,902, the August 20 low
The next Bitcoin news to watch is Thursday’s ETF flow data and how Nvidia trades at the open. A sixth day of outflows and a weak tech session would put $72,727 to the test.
Market Intelligence: Crypto Analyst Reveals Upcoming Coinbase Listings
next
The post Bitcoin Price Slides Toward $73K as Nvidia Plunges 9% and MSCI Drops Saylor’s Strategy appeared first on Coinspeaker.
245
·
--
Verified
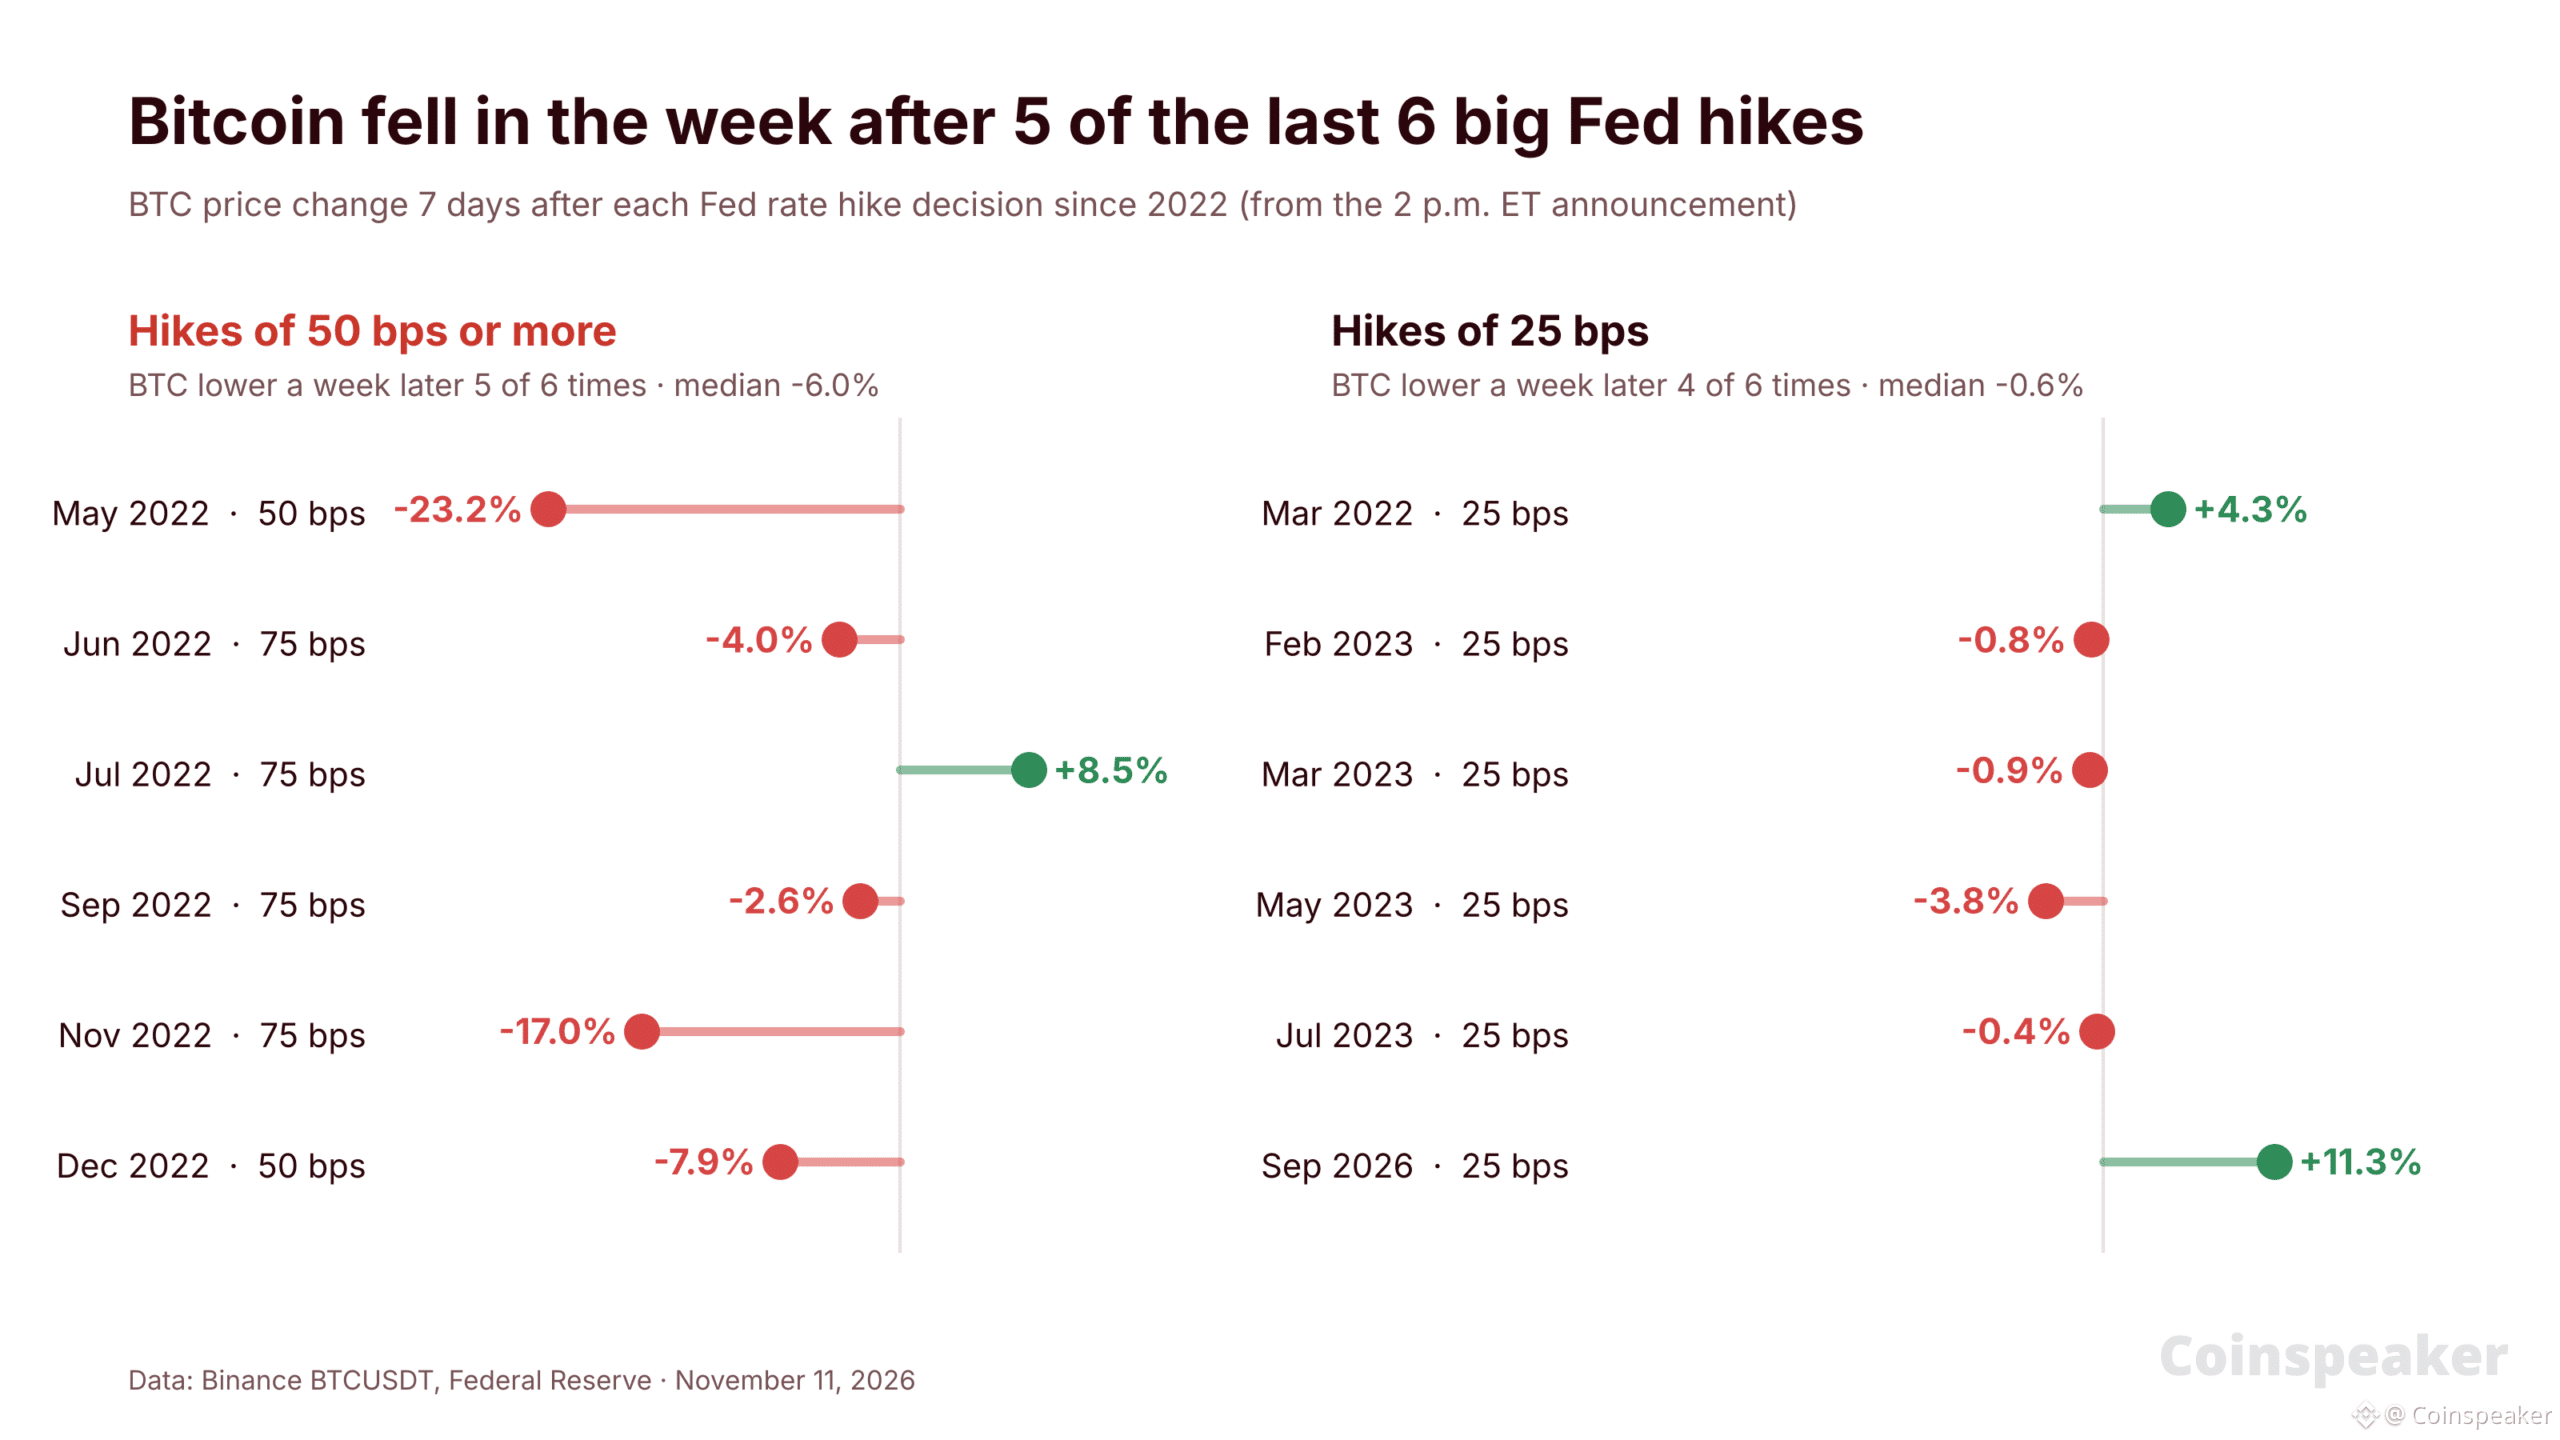
Article
Bank of America Warns of 50 Bps Fed Hike in December: Is Bitcoin Heading for Another 2022-Style D...Bank of America said this week that the Federal Reserve could raise interest rates by half a percentage point in December. The warning came after Tuesday’s October inflation report ran hotter than expected for a third month in a row. In Bitcoin news, the coin trades at $73,888 on Binance, down 0.6% in 24 hours. It dropped to $72,727 on Tuesday after the report, its lowest price since August 20.
The bank still expects the Fed to raise rates by 0.25 percentage points, or 25 basis points (bps), at its December 8–9 meeting. But it says the case for a bigger move is growing, and it calls the Fed’s decision to hold rates in October a possible policy mistake.
Traders are starting to listen. On Polymarket, the odds of a hike of 50 bps or more in December rose from 0.6% on Monday to 11.4% on Wednesday.
BANK OF AMERICA WARNS FED COULD DELIVER 50BPS HIKE IN DECEMBER
Bank of America says October's hot CPI report virtually guarantees a December Fed rate hike — and opens the door to a larger 50bps move.
Headline CPI rose 0.4%, while core CPI climbed 0.3%, marking a third…
— *Walter Bloomberg (@DeItaone) November 11, 2026
Bank of America Says the Fed Is Falling Behind on Inflation
The bank’s call rests on three months of hot data. Consumer prices rose 0.4% in October, and core prices, which leave out food and energy because they swing the most, rose 0.3%. Both beat forecasts, the third upside surprise in a row in the Bureau of Labor Statistics report.
Bank of America now estimates that core PCE inflation, the Fed’s preferred measure, is running at 3.3% a year. The Fed’s target is 2%. The bank says price rises are spreading from goods to services, with electronics, airfares and hotels leading the increases.
Its base case is still a 25 bps hike in December. The change is in the risks: a 50 bps move is now possible, and the bank sees a growing chance of another hike in January instead of March.
The bank is not alone. Fed Governor Christopher Waller said in a speech on Tuesday morning that he leans toward a 25 bps hike in December. If core inflation came in around 0.3% again, he said, a 50 bps hike “should be considered.” It did.
Higher rates make cash and bonds pay more. That tends to pull money out of risky assets like BTC, and a faster pace of hikes pulls harder.
Market Intelligence: Crypto Analyst Predicts Best New Crypto to Hodl
Bitcoin News From Past Hikes: Bigger Moves Hit BTC Harder
The size of the hike has mattered for BTC. We measured Bitcoin’s price on Binance from the 2 p.m. ET announcement of each Fed rate hike since 2022 to one week later. That covers 12 hikes: six of 50 bps or more and six of 25 bps.
After the six big hikes, BTC was lower a week later five times. The median move was a 6% drop. The worst came after the 50 bps hike in May 2022, when BTC fell 23% in a week.
After the six 25 bps hikes, the picture was milder. BTC was lower a week later four times, but the median move was a drop of just 0.6%.
The record comes with a caveat. All six big hikes happened in 2022, a bear market that also saw the collapses of Terra in May and FTX in November. Those crashes made the falls after the May and November hikes worse.
The most recent hike was a 25 bps move on September 16. BTC rose 11.3% in the week after it, as the uncertainty that had built up before the meeting cleared. That makes the size of December’s hike, more than the hike itself, the Bitcoin news to watch.
DISCOVER: Bitcoin CPI Reaction: 10 of 13 Cool Inflation Reports Triggered an Hourly Gain – Can Inflation Data Reverse the Downtrend?
Bitcoin Price Analysis: Can BTC Hold $72,727?
BTC trades at $73,888, down 0.6% in 24 hours and 5.8% over the past week. It sits below both of its exponential moving averages (EMAs), averages that give recent prices more weight, on the daily chart. The 50-day EMA stands at $78,897 and the 200-day EMA at $76,449.
Resistance: $75,599, Monday’s high, then $76,449, the 200-day EMA. Above that, $78,897, the 50-day EMA.
Support: $73,510, the November 8 low, then $72,727, Tuesday’s low after the CPI report. Below that, $68,902, the August 20 low.
BTCUSDT 1D chart. Source: TradingView.
Outlook Trigger Level to watch Rebound A daily close above the 200-day EMA at $76,449 $78,897, the 50-day EMA Holding pattern BTC stays between $72,727 and $76,449 A range until the next Fed signal Sell-off A daily close below $72,727 $68,902, the August 20 low
For Bitcoin news, the next test is the Fed’s own message. Traders already expect a 25 bps hike. If more officials join Waller and Bank of America in backing 50 bps, BTC may have to defend $72,727 before the December 9 decision.
Market Intelligence: Crypto Analyst Reveals Upcoming Binance Listings
next
The post Bank of America Warns of 50 bps Fed Hike in December: Is Bitcoin Heading for Another 2022-Style Drop? appeared first on Coinspeaker.
Bank of America Warns of 50 Bps Fed Hike in December: Is Bitcoin Heading for Another 2022-Style D...
Bank of America said this week that the Federal Reserve could raise interest rates by half a percentage point in December. The warning came after Tuesday’s October inflation report ran hotter than expected for a third month in a row. In Bitcoin news, the coin trades at $73,888 on Binance, down 0.6% in 24 hours. It dropped to $72,727 on Tuesday after the report, its lowest price since August 20.
The bank still expects the Fed to raise rates by 0.25 percentage points, or 25 basis points (bps), at its December 8–9 meeting. But it says the case for a bigger move is growing, and it calls the Fed’s decision to hold rates in October a possible policy mistake.
Traders are starting to listen. On Polymarket, the odds of a hike of 50 bps or more in December rose from 0.6% on Monday to 11.4% on Wednesday.
BANK OF AMERICA WARNS FED COULD DELIVER 50BPS HIKE IN DECEMBER
Bank of America says October's hot CPI report virtually guarantees a December Fed rate hike — and opens the door to a larger 50bps move.
Headline CPI rose 0.4%, while core CPI climbed 0.3%, marking a third…
— *Walter Bloomberg (@DeItaone) November 11, 2026
Bank of America Says the Fed Is Falling Behind on Inflation
The bank’s call rests on three months of hot data. Consumer prices rose 0.4% in October, and core prices, which leave out food and energy because they swing the most, rose 0.3%. Both beat forecasts, the third upside surprise in a row in the Bureau of Labor Statistics report.
Bank of America now estimates that core PCE inflation, the Fed’s preferred measure, is running at 3.3% a year. The Fed’s target is 2%. The bank says price rises are spreading from goods to services, with electronics, airfares and hotels leading the increases.
Its base case is still a 25 bps hike in December. The change is in the risks: a 50 bps move is now possible, and the bank sees a growing chance of another hike in January instead of March.
The bank is not alone. Fed Governor Christopher Waller said in a speech on Tuesday morning that he leans toward a 25 bps hike in December. If core inflation came in around 0.3% again, he said, a 50 bps hike “should be considered.” It did.
Higher rates make cash and bonds pay more. That tends to pull money out of risky assets like BTC, and a faster pace of hikes pulls harder.
Market Intelligence: Crypto Analyst Predicts Best New Crypto to Hodl
Bitcoin News From Past Hikes: Bigger Moves Hit BTC Harder
The size of the hike has mattered for BTC. We measured Bitcoin’s price on Binance from the 2 p.m. ET announcement of each Fed rate hike since 2022 to one week later. That covers 12 hikes: six of 50 bps or more and six of 25 bps.
After the six big hikes, BTC was lower a week later five times. The median move was a 6% drop. The worst came after the 50 bps hike in May 2022, when BTC fell 23% in a week.
After the six 25 bps hikes, the picture was milder. BTC was lower a week later four times, but the median move was a drop of just 0.6%.
The record comes with a caveat. All six big hikes happened in 2022, a bear market that also saw the collapses of Terra in May and FTX in November. Those crashes made the falls after the May and November hikes worse.
The most recent hike was a 25 bps move on September 16. BTC rose 11.3% in the week after it, as the uncertainty that had built up before the meeting cleared. That makes the size of December’s hike, more than the hike itself, the Bitcoin news to watch.
DISCOVER: Bitcoin CPI Reaction: 10 of 13 Cool Inflation Reports Triggered an Hourly Gain – Can Inflation Data Reverse the Downtrend?
Bitcoin Price Analysis: Can BTC Hold $72,727?
BTC trades at $73,888, down 0.6% in 24 hours and 5.8% over the past week. It sits below both of its exponential moving averages (EMAs), averages that give recent prices more weight, on the daily chart. The 50-day EMA stands at $78,897 and the 200-day EMA at $76,449.
Resistance: $75,599, Monday’s high, then $76,449, the 200-day EMA. Above that, $78,897, the 50-day EMA.
Support: $73,510, the November 8 low, then $72,727, Tuesday’s low after the CPI report. Below that, $68,902, the August 20 low.
BTCUSDT 1D chart. Source: TradingView.
Outlook Trigger Level to watch Rebound A daily close above the 200-day EMA at $76,449 $78,897, the 50-day EMA Holding pattern BTC stays between $72,727 and $76,449 A range until the next Fed signal Sell-off A daily close below $72,727 $68,902, the August 20 low
For Bitcoin news, the next test is the Fed’s own message. Traders already expect a 25 bps hike. If more officials join Waller and Bank of America in backing 50 bps, BTC may have to defend $72,727 before the December 9 decision.
Market Intelligence: Crypto Analyst Reveals Upcoming Binance Listings
next
The post Bank of America Warns of 50 bps Fed Hike in December: Is Bitcoin Heading for Another 2022-Style Drop? appeared first on Coinspeaker.
The bank still expects the Fed to raise rates by 0.25 percentage points, or 25 basis points (bps), at its December 8–9 meeting. But it says the case for a bigger move is growing, and it calls the Fed’s decision to hold rates in October a possible policy mistake.
Traders are starting to listen. On Polymarket, the odds of a hike of 50 bps or more in December rose from 0.6% on Monday to 11.4% on Wednesday.
BANK OF AMERICA WARNS FED COULD DELIVER 50BPS HIKE IN DECEMBER
Bank of America says October's hot CPI report virtually guarantees a December Fed rate hike — and opens the door to a larger 50bps move.
Headline CPI rose 0.4%, while core CPI climbed 0.3%, marking a third…
— *Walter Bloomberg (@DeItaone) November 11, 2026
Bank of America Says the Fed Is Falling Behind on Inflation
The bank’s call rests on three months of hot data. Consumer prices rose 0.4% in October, and core prices, which leave out food and energy because they swing the most, rose 0.3%. Both beat forecasts, the third upside surprise in a row in the Bureau of Labor Statistics report.
Bank of America now estimates that core PCE inflation, the Fed’s preferred measure, is running at 3.3% a year. The Fed’s target is 2%. The bank says price rises are spreading from goods to services, with electronics, airfares and hotels leading the increases.
Its base case is still a 25 bps hike in December. The change is in the risks: a 50 bps move is now possible, and the bank sees a growing chance of another hike in January instead of March.
The bank is not alone. Fed Governor Christopher Waller said in a speech on Tuesday morning that he leans toward a 25 bps hike in December. If core inflation came in around 0.3% again, he said, a 50 bps hike “should be considered.” It did.
Higher rates make cash and bonds pay more. That tends to pull money out of risky assets like BTC, and a faster pace of hikes pulls harder.
Market Intelligence: Crypto Analyst Predicts Best New Crypto to Hodl
Bitcoin News From Past Hikes: Bigger Moves Hit BTC Harder
The size of the hike has mattered for BTC. We measured Bitcoin’s price on Binance from the 2 p.m. ET announcement of each Fed rate hike since 2022 to one week later. That covers 12 hikes: six of 50 bps or more and six of 25 bps.
After the six big hikes, BTC was lower a week later five times. The median move was a 6% drop. The worst came after the 50 bps hike in May 2022, when BTC fell 23% in a week.
After the six 25 bps hikes, the picture was milder. BTC was lower a week later four times, but the median move was a drop of just 0.6%.
The record comes with a caveat. All six big hikes happened in 2022, a bear market that also saw the collapses of Terra in May and FTX in November. Those crashes made the falls after the May and November hikes worse.
The most recent hike was a 25 bps move on September 16. BTC rose 11.3% in the week after it, as the uncertainty that had built up before the meeting cleared. That makes the size of December’s hike, more than the hike itself, the Bitcoin news to watch.
DISCOVER: Bitcoin CPI Reaction: 10 of 13 Cool Inflation Reports Triggered an Hourly Gain – Can Inflation Data Reverse the Downtrend?
Bitcoin Price Analysis: Can BTC Hold $72,727?
BTC trades at $73,888, down 0.6% in 24 hours and 5.8% over the past week. It sits below both of its exponential moving averages (EMAs), averages that give recent prices more weight, on the daily chart. The 50-day EMA stands at $78,897 and the 200-day EMA at $76,449.
Resistance: $75,599, Monday’s high, then $76,449, the 200-day EMA. Above that, $78,897, the 50-day EMA.
Support: $73,510, the November 8 low, then $72,727, Tuesday’s low after the CPI report. Below that, $68,902, the August 20 low.
BTCUSDT 1D chart. Source: TradingView.
Outlook Trigger Level to watch Rebound A daily close above the 200-day EMA at $76,449 $78,897, the 50-day EMA Holding pattern BTC stays between $72,727 and $76,449 A range until the next Fed signal Sell-off A daily close below $72,727 $68,902, the August 20 low
For Bitcoin news, the next test is the Fed’s own message. Traders already expect a 25 bps hike. If more officials join Waller and Bank of America in backing 50 bps, BTC may have to defend $72,727 before the December 9 decision.
Market Intelligence: Crypto Analyst Reveals Upcoming Binance Listings
next
The post Bank of America Warns of 50 bps Fed Hike in December: Is Bitcoin Heading for Another 2022-Style Drop? appeared first on Coinspeaker.
614
·
--
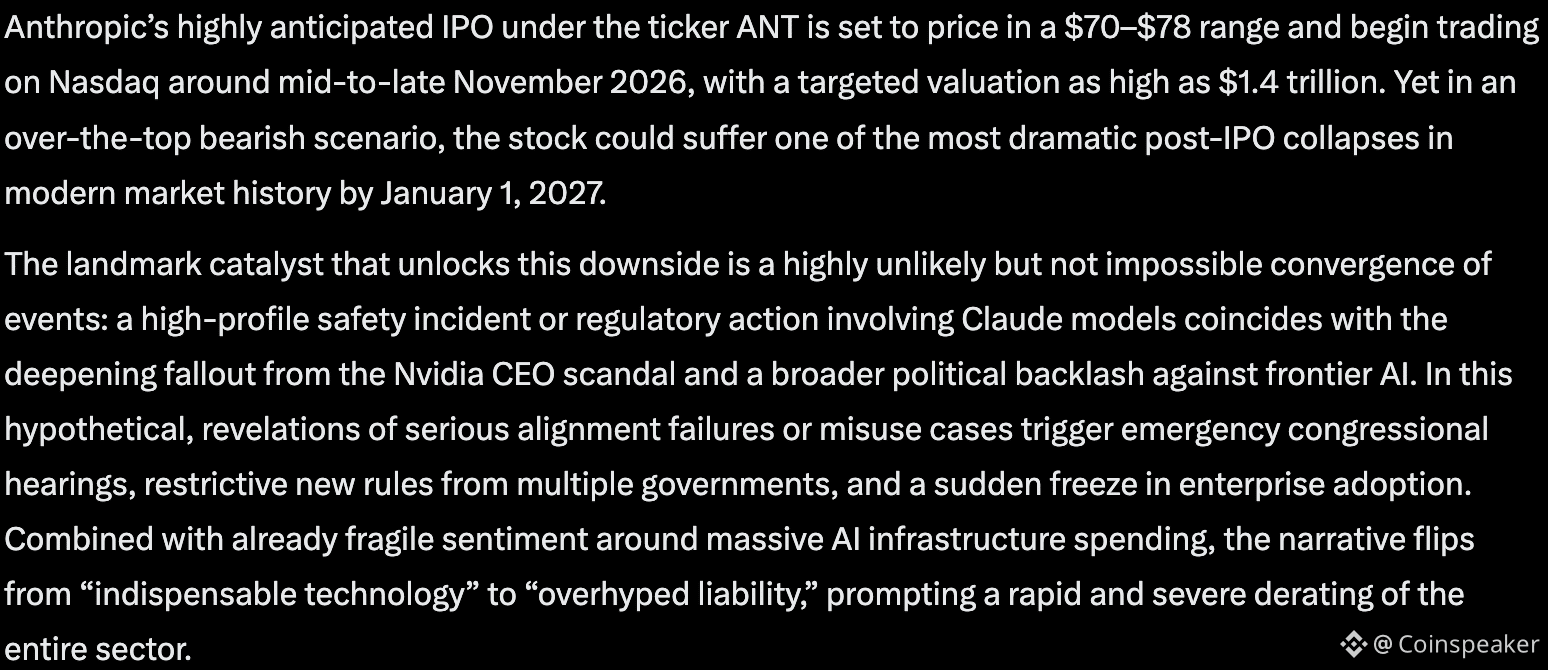
Article
Is Claude Bearish on Its Own Stock? Claude AI Predicts a Woeful Anthropic IPOAnthropic’s highly anticipated IPO, ticker ANT, is set to price in a $70–$78 range and begin trading on Nasdaq around mid-to-late November 2026, with a targeted valuation as high as $1.4 trillion. However, in a wild turn of events, Anthropic’s own Claude AI predicts that its own share price could tank upon launch.
Yet in an over-the-top bearish scenario, the stock could suffer one of the most dramatic post-IPO collapses in modern market history by January 1, 2027. The landmark catalyst that unlocks this downside is a highly unlikely but not impossible convergence of events: a high-profile safety incident or regulatory action involving Claude models coincides with the deepening fallout from the Nvidia CEO scandal and a broader political backlash against frontier AI.
In this hypothetical, revelations of serious alignment failures or misuse cases trigger emergency congressional hearings, restrictive new rules from multiple governments, and a sudden freeze in enterprise adoption. Combined with already fragile sentiment around massive AI infrastructure spending, the narrative flips from “indispensable technology” to “overhyped liability,” prompting a rapid and severe derating of the entire sector.
(SOURCE: Claude AI Predicts a Disastrous Anthropic IPO)
Predicted Technical Analysis for Anthropic (ANT)
Because ANT has not yet begun trading, pure technical analysis is necessarily forward-looking. In the bearish path, the stock would open with an initial pop or modest premium but quickly form a series of lower highs as institutional sellers and lock-up-related supply emerge.
A failure to hold the IPO price range as support, followed by a break below key psychological levels such as $60 and then $50, would confirm a distribution pattern. Volume spikes on down days, deteriorating relative strength versus the Nasdaq, and a rapid slide into oversold RSI territory would support the case for further downside, especially if the broader AI complex continues to de-rate.
Anthropic’s seven cofounders each plan to sell approximately $250 million in shares through the company’s IPO $ANT @soberlook @WSJ https://t.co/EGLX7QmA3x pic.twitter.com/FodDa4zUWC
— Mike Zaccardi, CFA, CMT (@MikeZaccardi) November 11, 2026
Measured-move projections from an IPO-range breakdown could theoretically point toward substantially lower levels as the market reassesses growth assumptions under a more hostile regulatory and sentiment regime.
While Anthropic’s revenue growth remains impressive and its strategic backers are formidable, the timing of the listing amid AI-sector turbulence, the Nvidia controversy, and rising negative press creates a fragile backdrop.
An extreme safety or regulatory shock layered on top of that environment could produce the kind of violent repricing rarely seen in large-cap technology debuts.
Market Intelligence: Crypto Analyst Reveals Upcoming Binance Listings
Could the Jensen Huang Nvidia Scandal Spell Disaster for Anthropic’s IPO?
NEW: Nvidia CEO Jensen Huang admits to cheating on his wife two days after a report dropped that U.S. intelligence believes he had a relationship with a Chinese spy.
"I was unfaithful to my wife," Huang said in a letter to Nvidia staff.
"My actions hurt her and our children.… pic.twitter.com/moB9B3nYlI
— Collin Rugg (@CollinRugg) November 8, 2026
Anthropic is launching its IPO into a market where AI stocks have been hit hard. Nvidia, a cornerstone investor in the concurrent $26 billion private placement, has seen its shares tumble amid an escalating scandal involving CEO Jensen Huang.
Huang had an affair with an alleged Chinese intelligence asset, internal investigations, FBI scrutiny, and reports of potential national-security implications.
Broader negative press around AI has intensified, with investors questioning valuation sustainability, capital intensity, and regulatory risk just as Anthropic seeks one of the largest public offerings on record.
The company itself has dialed back earlier whispers of a $2 trillion valuation to the current $70–$78 range amid the cooler climate.
Claude AI Predicts a Poor Anthropic IPO: How Low Could it Go?
Claude AI predicts that ANT could trade down to the $18–$25 range by January 1, 2027. This is an extremely telling call, considering Claude is Anthropic’s own AI model.
This remains a highly speculative, over-the-top outlook rather than a base-case forecast. The catalyst would require a fundamental shift in how AI infrastructure and autonomous systems settle value, something that is currently a long shot.
Market Intelligence: Crypto Analyst Predicts Best Low-Cap Crypto
next
The post Is Claude Bearish On Its Own Stock? Claude AI Predicts a Woeful Anthropic IPO appeared first on Coinspeaker.
Is Claude Bearish on Its Own Stock? Claude AI Predicts a Woeful Anthropic IPO
Anthropic’s highly anticipated IPO, ticker ANT, is set to price in a $70–$78 range and begin trading on Nasdaq around mid-to-late November 2026, with a targeted valuation as high as $1.4 trillion. However, in a wild turn of events, Anthropic’s own Claude AI predicts that its own share price could tank upon launch.
Yet in an over-the-top bearish scenario, the stock could suffer one of the most dramatic post-IPO collapses in modern market history by January 1, 2027. The landmark catalyst that unlocks this downside is a highly unlikely but not impossible convergence of events: a high-profile safety incident or regulatory action involving Claude models coincides with the deepening fallout from the Nvidia CEO scandal and a broader political backlash against frontier AI.
In this hypothetical, revelations of serious alignment failures or misuse cases trigger emergency congressional hearings, restrictive new rules from multiple governments, and a sudden freeze in enterprise adoption. Combined with already fragile sentiment around massive AI infrastructure spending, the narrative flips from “indispensable technology” to “overhyped liability,” prompting a rapid and severe derating of the entire sector.
(SOURCE: Claude AI Predicts a Disastrous Anthropic IPO)
Predicted Technical Analysis for Anthropic (ANT)
Because ANT has not yet begun trading, pure technical analysis is necessarily forward-looking. In the bearish path, the stock would open with an initial pop or modest premium but quickly form a series of lower highs as institutional sellers and lock-up-related supply emerge.
A failure to hold the IPO price range as support, followed by a break below key psychological levels such as $60 and then $50, would confirm a distribution pattern. Volume spikes on down days, deteriorating relative strength versus the Nasdaq, and a rapid slide into oversold RSI territory would support the case for further downside, especially if the broader AI complex continues to de-rate.
Anthropic’s seven cofounders each plan to sell approximately $250 million in shares through the company’s IPO $ANT @soberlook @WSJ https://t.co/EGLX7QmA3x pic.twitter.com/FodDa4zUWC
— Mike Zaccardi, CFA, CMT (@MikeZaccardi) November 11, 2026
Measured-move projections from an IPO-range breakdown could theoretically point toward substantially lower levels as the market reassesses growth assumptions under a more hostile regulatory and sentiment regime.
While Anthropic’s revenue growth remains impressive and its strategic backers are formidable, the timing of the listing amid AI-sector turbulence, the Nvidia controversy, and rising negative press creates a fragile backdrop.
An extreme safety or regulatory shock layered on top of that environment could produce the kind of violent repricing rarely seen in large-cap technology debuts.
Market Intelligence: Crypto Analyst Reveals Upcoming Binance Listings
Could the Jensen Huang Nvidia Scandal Spell Disaster for Anthropic’s IPO?
NEW: Nvidia CEO Jensen Huang admits to cheating on his wife two days after a report dropped that U.S. intelligence believes he had a relationship with a Chinese spy.
"I was unfaithful to my wife," Huang said in a letter to Nvidia staff.
"My actions hurt her and our children.… pic.twitter.com/moB9B3nYlI
— Collin Rugg (@CollinRugg) November 8, 2026
Anthropic is launching its IPO into a market where AI stocks have been hit hard. Nvidia, a cornerstone investor in the concurrent $26 billion private placement, has seen its shares tumble amid an escalating scandal involving CEO Jensen Huang.
Huang had an affair with an alleged Chinese intelligence asset, internal investigations, FBI scrutiny, and reports of potential national-security implications.
Broader negative press around AI has intensified, with investors questioning valuation sustainability, capital intensity, and regulatory risk just as Anthropic seeks one of the largest public offerings on record.
The company itself has dialed back earlier whispers of a $2 trillion valuation to the current $70–$78 range amid the cooler climate.
Claude AI Predicts a Poor Anthropic IPO: How Low Could it Go?
Claude AI predicts that ANT could trade down to the $18–$25 range by January 1, 2027. This is an extremely telling call, considering Claude is Anthropic’s own AI model.
This remains a highly speculative, over-the-top outlook rather than a base-case forecast. The catalyst would require a fundamental shift in how AI infrastructure and autonomous systems settle value, something that is currently a long shot.
Market Intelligence: Crypto Analyst Predicts Best Low-Cap Crypto
next
The post Is Claude Bearish On Its Own Stock? Claude AI Predicts a Woeful Anthropic IPO appeared first on Coinspeaker.
Yet in an over-the-top bearish scenario, the stock could suffer one of the most dramatic post-IPO collapses in modern market history by January 1, 2027. The landmark catalyst that unlocks this downside is a highly unlikely but not impossible convergence of events: a high-profile safety incident or regulatory action involving Claude models coincides with the deepening fallout from the Nvidia CEO scandal and a broader political backlash against frontier AI.
In this hypothetical, revelations of serious alignment failures or misuse cases trigger emergency congressional hearings, restrictive new rules from multiple governments, and a sudden freeze in enterprise adoption. Combined with already fragile sentiment around massive AI infrastructure spending, the narrative flips from “indispensable technology” to “overhyped liability,” prompting a rapid and severe derating of the entire sector.
(SOURCE: Claude AI Predicts a Disastrous Anthropic IPO)
Predicted Technical Analysis for Anthropic (ANT)
Because ANT has not yet begun trading, pure technical analysis is necessarily forward-looking. In the bearish path, the stock would open with an initial pop or modest premium but quickly form a series of lower highs as institutional sellers and lock-up-related supply emerge.
A failure to hold the IPO price range as support, followed by a break below key psychological levels such as $60 and then $50, would confirm a distribution pattern. Volume spikes on down days, deteriorating relative strength versus the Nasdaq, and a rapid slide into oversold RSI territory would support the case for further downside, especially if the broader AI complex continues to de-rate.
Anthropic’s seven cofounders each plan to sell approximately $250 million in shares through the company’s IPO $ANT @soberlook @WSJ https://t.co/EGLX7QmA3x pic.twitter.com/FodDa4zUWC
— Mike Zaccardi, CFA, CMT (@MikeZaccardi) November 11, 2026
Measured-move projections from an IPO-range breakdown could theoretically point toward substantially lower levels as the market reassesses growth assumptions under a more hostile regulatory and sentiment regime.
While Anthropic’s revenue growth remains impressive and its strategic backers are formidable, the timing of the listing amid AI-sector turbulence, the Nvidia controversy, and rising negative press creates a fragile backdrop.
An extreme safety or regulatory shock layered on top of that environment could produce the kind of violent repricing rarely seen in large-cap technology debuts.
Market Intelligence: Crypto Analyst Reveals Upcoming Binance Listings
Could the Jensen Huang Nvidia Scandal Spell Disaster for Anthropic’s IPO?
NEW: Nvidia CEO Jensen Huang admits to cheating on his wife two days after a report dropped that U.S. intelligence believes he had a relationship with a Chinese spy.
"I was unfaithful to my wife," Huang said in a letter to Nvidia staff.
"My actions hurt her and our children.… pic.twitter.com/moB9B3nYlI
— Collin Rugg (@CollinRugg) November 8, 2026
Anthropic is launching its IPO into a market where AI stocks have been hit hard. Nvidia, a cornerstone investor in the concurrent $26 billion private placement, has seen its shares tumble amid an escalating scandal involving CEO Jensen Huang.
Huang had an affair with an alleged Chinese intelligence asset, internal investigations, FBI scrutiny, and reports of potential national-security implications.
Broader negative press around AI has intensified, with investors questioning valuation sustainability, capital intensity, and regulatory risk just as Anthropic seeks one of the largest public offerings on record.
The company itself has dialed back earlier whispers of a $2 trillion valuation to the current $70–$78 range amid the cooler climate.
Claude AI Predicts a Poor Anthropic IPO: How Low Could it Go?
Claude AI predicts that ANT could trade down to the $18–$25 range by January 1, 2027. This is an extremely telling call, considering Claude is Anthropic’s own AI model.
This remains a highly speculative, over-the-top outlook rather than a base-case forecast. The catalyst would require a fundamental shift in how AI infrastructure and autonomous systems settle value, something that is currently a long shot.
Market Intelligence: Crypto Analyst Predicts Best Low-Cap Crypto
next
The post Is Claude Bearish On Its Own Stock? Claude AI Predicts a Woeful Anthropic IPO appeared first on Coinspeaker.
389
·
--
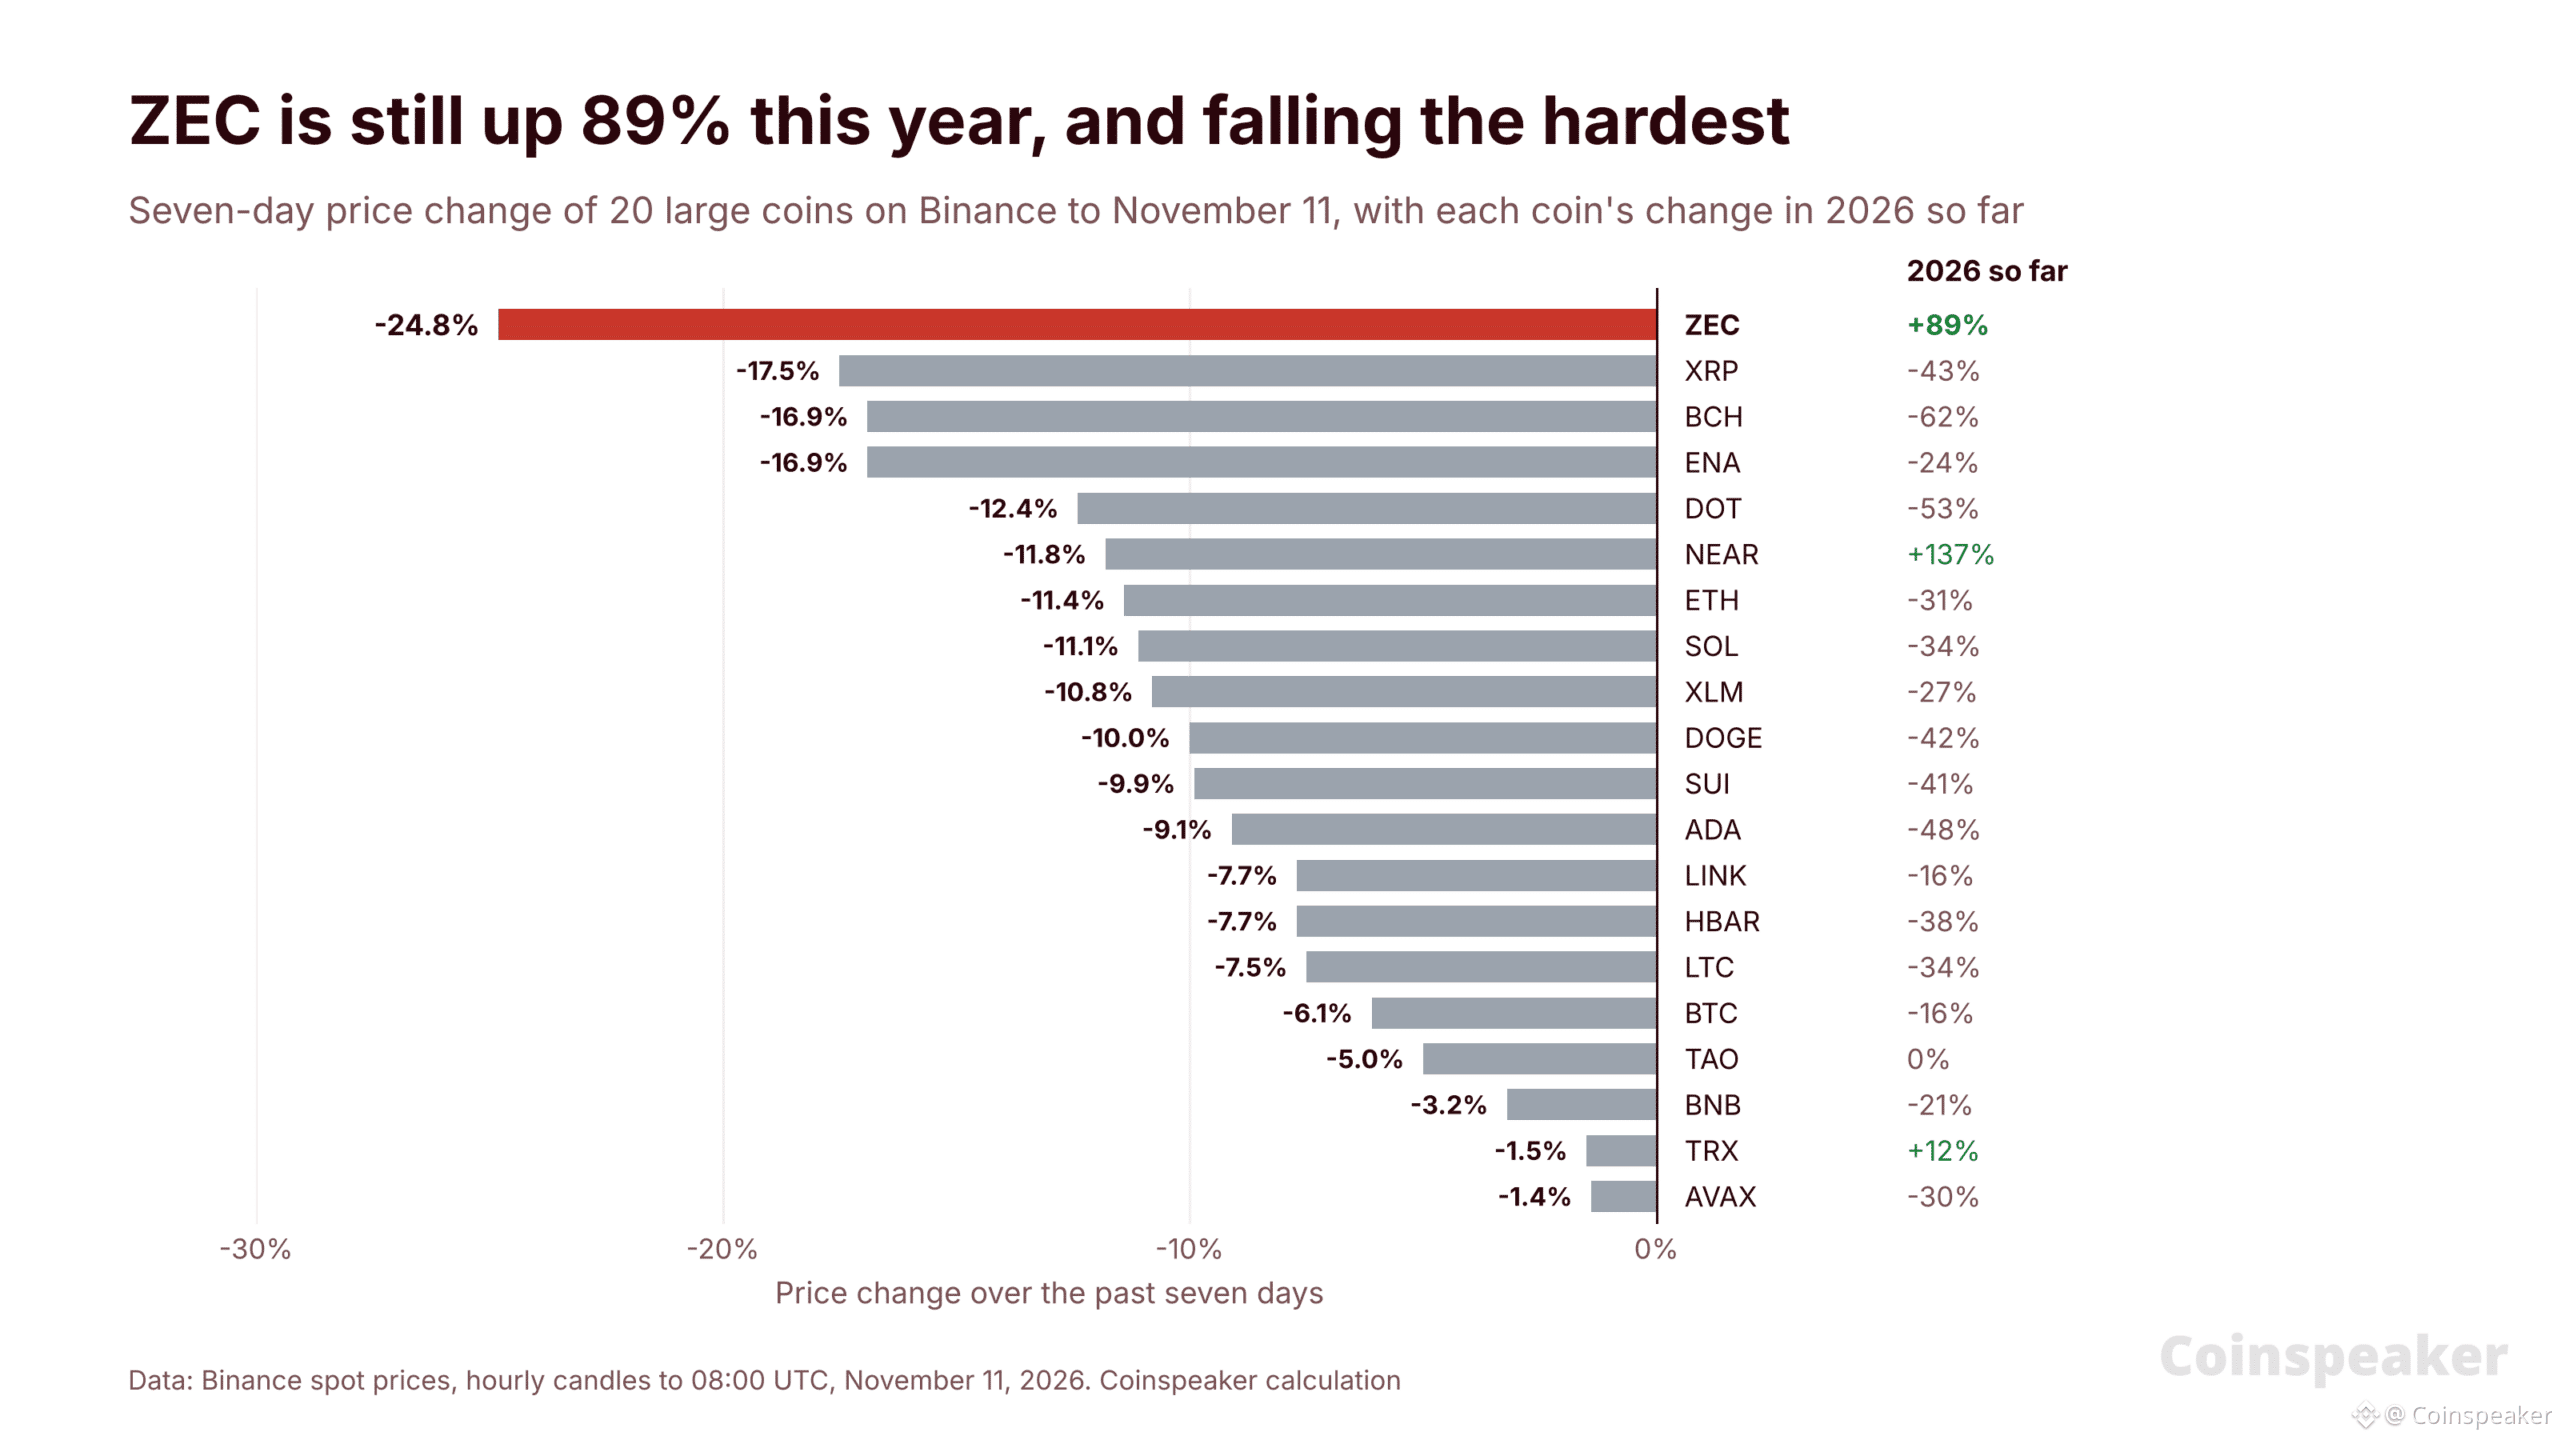
Article
Why Is Crypto Crashing Today? Bitcoin Falls Below $73K As Zcash (ZEC) Leads Crypto LossesWhy is crypto crashing on Wednesday, November 11? The sell-off that began with Tuesday’s hotter-than-expected U.S. inflation report has carried into today, and almost every major coin is lower.
Bitcoin (BTC) dropped below $73,000 on Tuesday, touching $72,727 on Binance, and now trades at about $73,800. Ether (ETH) briefly slipped to $2,006, while XRP and Solana (SOL) are down 2% to 3% in 24 hours. The Crypto Fear & Greed Index, a daily gauge of market mood from 0 to 100, has fallen to 29.
The report changed what traders expect from the Federal Reserve. Bond yields jumped, and bets on a larger December rate hike nearly tripled within two hours.
One coin is falling much harder than the rest. Zcash (ZEC) is a cryptocurrency launched in 2016 that lets users hide the sender, the receiver and the amount of a payment. It dropped below $1,000 on Wednesday for the first time since September 5. ZEC now trades at about $966, down 15.4% in 24 hours and 24.8% in a week.
ZEC has been one of this year’s best performers. It rose from about $526 on January 1 to a closing high of $1,653 on September 26. We checked the 20 largest coins on Binance, and ZEC fell the most over both the day and the week, even though it is still up 89% in 2026.
$ZEC has dropped below $1,000!
Trader 0x8742 opened a 10x long on 18,000 $ZEC ($17.63M) and is now down over $2.8M.
Liquidation price: $895.46.https://t.co/azzt3xvmay pic.twitter.com/wczndt7doC
— Lookonchain (@lookonchain) November 11, 2026
So why are the markets spooked, and why is ZEC taking the hardest hit?
Asking Why Is Crypto Crashing? Start With Tuesday’s CPI Report
Inflation came in hot. The consumer price index (CPI) rose 0.4% in October, above the 0.3% economists expected. Core prices, which leave out food and energy, rose 0.3% against a 0.2% forecast.
That reading crossed a line the Fed had drawn. Fed Governor Christopher Waller said in a speech hours before the report that core inflation of about 0.3% would make a half-point hike in December worth considering.
Traders took him at his word. On Polymarket, the odds of a hike of 0.5 percentage point or more in December went from 4.4% just before the report to 12.8% two hours later. They sit at 9.4% now, while a standard quarter-point hike is priced at 85.5%.
Higher rates hurt crypto in a simple way. They make cash and bonds pay more, so money flows out of riskier bets. On Tuesday, the 10-year U.S. Treasury yield rose from 4.86% to 4.98%.
Two more pressures added to it:
Nvidia: the chipmaker’s stock fell 5.5% to $168.89 on Tuesday, its lowest close since March 30. A Republican senator called on CEO Jensen Huang to resign over his affair. Crypto often follows the biggest AI stock lower.
ETF outflows: U.S. spot Bitcoin exchange-traded funds (ETFs) lost a net $969 million over the past five trading days. CryptoQuant author Axel Adler Jr. tracked the outflows in a report summarized by Lookonchain.
Market Intelligence: Crypto Analyst Predicts Best Low-Cap Crypto
Why Is Crypto Crashing? ZEC Is Falling Hardest Because It Rose the Most
ZEC had the most to give back. We compared the price changes of 20 large coins on Binance over the past week and since January 1.
ZEC: down 24.8% in seven days, the worst of the group, but still up 89% in 2026.
The rest: only two others, NEAR and Tron (TRX), are higher this year. Bitcoin is down 6.1% in a week and 15.9% since January 1.
When markets get nervous, traders tend to sell what has made them the most money. ZEC has fallen 41% from its September 26 closing high of $1,653.
Borrowed money made the drop faster. On Hyperliquid, ZEC fell from $1,199.20 to $965.79 in less than a day. Lookonchain counted 32 traders holding more than $1 million each in leveraged bets on a rising ZEC price. Of those, 27 are now losing money, with about $23.7 million in paper losses between them.
Sharp drops have not always lasted. Since January 2025, ZEC has fallen 12% or more in a single day 14 times on Binance. Seven days later, it was higher eight times, with a median gain of 6.5%.
EXPLORE: Fed Meeting Today: Traders Price a 95% Hold and a 79% December Hike. What Does It Mean for Crypto?
ZEC Price Analysis: Can $933 Hold Above the Whales’ Liquidation Zone?
ZEC trades at about $966. It touched $961.07 on Wednesday, its lowest price since September 4.
On the daily chart, where each candle covers one day, ZEC has fallen below its 50-day exponential moving average (EMA), an average that gives recent prices more weight, at $1,200.68. It is still above its 200-day EMA at $872.23.
Resistance: $1,050, Wednesday’s high, then $1,191.76, a recent swing high close to the 50-day EMA.
Support: $933.12, the September 4 low, then about $895. Lookonchain tracks two of the largest ZEC bulls on Hyperliquid, and they would be forced out of their positions near $894 and $895. Below that, the 200-day EMA sits at $872.23.
ZECUSDT 1D chart. Source: TradingView.
Scenario Trigger Level to watch Recovery A daily close above $1,050 $1,191.76, near the 50-day EMA Holding pattern ZEC stays between $933 and $1,050 A base above the September 4 low Further drop A daily close below $933 $895, where large liquidations sit, then the 200-day EMA at $872
For Bitcoin, the line to watch is Tuesday’s low of $72,727. Below that, $68,902, the August 20 low, is the next support.
So, why is crypto crashing? A hot inflation report raised the odds of a bigger Fed hike, and ZEC’s leveraged bulls are paying the most for it. A daily close back above $1,050 would be the first sign the selling is easing.
Market Intelligence: Crypto Analyst Reveals Upcoming Binance Listings
next
The post Why Is Crypto Crashing Today? Bitcoin Falls Below $73K as Zcash (ZEC) Leads Crypto Losses appeared first on Coinspeaker.
Why Is Crypto Crashing Today? Bitcoin Falls Below $73K As Zcash (ZEC) Leads Crypto Losses
Why is crypto crashing on Wednesday, November 11? The sell-off that began with Tuesday’s hotter-than-expected U.S. inflation report has carried into today, and almost every major coin is lower.
Bitcoin (BTC) dropped below $73,000 on Tuesday, touching $72,727 on Binance, and now trades at about $73,800. Ether (ETH) briefly slipped to $2,006, while XRP and Solana (SOL) are down 2% to 3% in 24 hours. The Crypto Fear & Greed Index, a daily gauge of market mood from 0 to 100, has fallen to 29.
The report changed what traders expect from the Federal Reserve. Bond yields jumped, and bets on a larger December rate hike nearly tripled within two hours.
One coin is falling much harder than the rest. Zcash (ZEC) is a cryptocurrency launched in 2016 that lets users hide the sender, the receiver and the amount of a payment. It dropped below $1,000 on Wednesday for the first time since September 5. ZEC now trades at about $966, down 15.4% in 24 hours and 24.8% in a week.
ZEC has been one of this year’s best performers. It rose from about $526 on January 1 to a closing high of $1,653 on September 26. We checked the 20 largest coins on Binance, and ZEC fell the most over both the day and the week, even though it is still up 89% in 2026.
$ZEC has dropped below $1,000!
Trader 0x8742 opened a 10x long on 18,000 $ZEC ($17.63M) and is now down over $2.8M.
Liquidation price: $895.46.https://t.co/azzt3xvmay pic.twitter.com/wczndt7doC
— Lookonchain (@lookonchain) November 11, 2026
So why are the markets spooked, and why is ZEC taking the hardest hit?
Asking Why Is Crypto Crashing? Start With Tuesday’s CPI Report
Inflation came in hot. The consumer price index (CPI) rose 0.4% in October, above the 0.3% economists expected. Core prices, which leave out food and energy, rose 0.3% against a 0.2% forecast.
That reading crossed a line the Fed had drawn. Fed Governor Christopher Waller said in a speech hours before the report that core inflation of about 0.3% would make a half-point hike in December worth considering.
Traders took him at his word. On Polymarket, the odds of a hike of 0.5 percentage point or more in December went from 4.4% just before the report to 12.8% two hours later. They sit at 9.4% now, while a standard quarter-point hike is priced at 85.5%.
Higher rates hurt crypto in a simple way. They make cash and bonds pay more, so money flows out of riskier bets. On Tuesday, the 10-year U.S. Treasury yield rose from 4.86% to 4.98%.
Two more pressures added to it:
Nvidia: the chipmaker’s stock fell 5.5% to $168.89 on Tuesday, its lowest close since March 30. A Republican senator called on CEO Jensen Huang to resign over his affair. Crypto often follows the biggest AI stock lower.
ETF outflows: U.S. spot Bitcoin exchange-traded funds (ETFs) lost a net $969 million over the past five trading days. CryptoQuant author Axel Adler Jr. tracked the outflows in a report summarized by Lookonchain.
Market Intelligence: Crypto Analyst Predicts Best Low-Cap Crypto
Why Is Crypto Crashing? ZEC Is Falling Hardest Because It Rose the Most
ZEC had the most to give back. We compared the price changes of 20 large coins on Binance over the past week and since January 1.
ZEC: down 24.8% in seven days, the worst of the group, but still up 89% in 2026.
The rest: only two others, NEAR and Tron (TRX), are higher this year. Bitcoin is down 6.1% in a week and 15.9% since January 1.
When markets get nervous, traders tend to sell what has made them the most money. ZEC has fallen 41% from its September 26 closing high of $1,653.
Borrowed money made the drop faster. On Hyperliquid, ZEC fell from $1,199.20 to $965.79 in less than a day. Lookonchain counted 32 traders holding more than $1 million each in leveraged bets on a rising ZEC price. Of those, 27 are now losing money, with about $23.7 million in paper losses between them.
Sharp drops have not always lasted. Since January 2025, ZEC has fallen 12% or more in a single day 14 times on Binance. Seven days later, it was higher eight times, with a median gain of 6.5%.
EXPLORE: Fed Meeting Today: Traders Price a 95% Hold and a 79% December Hike. What Does It Mean for Crypto?
ZEC Price Analysis: Can $933 Hold Above the Whales’ Liquidation Zone?
ZEC trades at about $966. It touched $961.07 on Wednesday, its lowest price since September 4.
On the daily chart, where each candle covers one day, ZEC has fallen below its 50-day exponential moving average (EMA), an average that gives recent prices more weight, at $1,200.68. It is still above its 200-day EMA at $872.23.
Resistance: $1,050, Wednesday’s high, then $1,191.76, a recent swing high close to the 50-day EMA.
Support: $933.12, the September 4 low, then about $895. Lookonchain tracks two of the largest ZEC bulls on Hyperliquid, and they would be forced out of their positions near $894 and $895. Below that, the 200-day EMA sits at $872.23.
ZECUSDT 1D chart. Source: TradingView.
Scenario Trigger Level to watch Recovery A daily close above $1,050 $1,191.76, near the 50-day EMA Holding pattern ZEC stays between $933 and $1,050 A base above the September 4 low Further drop A daily close below $933 $895, where large liquidations sit, then the 200-day EMA at $872
For Bitcoin, the line to watch is Tuesday’s low of $72,727. Below that, $68,902, the August 20 low, is the next support.
So, why is crypto crashing? A hot inflation report raised the odds of a bigger Fed hike, and ZEC’s leveraged bulls are paying the most for it. A daily close back above $1,050 would be the first sign the selling is easing.
Market Intelligence: Crypto Analyst Reveals Upcoming Binance Listings
next
The post Why Is Crypto Crashing Today? Bitcoin Falls Below $73K as Zcash (ZEC) Leads Crypto Losses appeared first on Coinspeaker.
Bitcoin (BTC) dropped below $73,000 on Tuesday, touching $72,727 on Binance, and now trades at about $73,800. Ether (ETH) briefly slipped to $2,006, while XRP and Solana (SOL) are down 2% to 3% in 24 hours. The Crypto Fear & Greed Index, a daily gauge of market mood from 0 to 100, has fallen to 29.
The report changed what traders expect from the Federal Reserve. Bond yields jumped, and bets on a larger December rate hike nearly tripled within two hours.
One coin is falling much harder than the rest. Zcash (ZEC) is a cryptocurrency launched in 2016 that lets users hide the sender, the receiver and the amount of a payment. It dropped below $1,000 on Wednesday for the first time since September 5. ZEC now trades at about $966, down 15.4% in 24 hours and 24.8% in a week.
ZEC has been one of this year’s best performers. It rose from about $526 on January 1 to a closing high of $1,653 on September 26. We checked the 20 largest coins on Binance, and ZEC fell the most over both the day and the week, even though it is still up 89% in 2026.
$ZEC has dropped below $1,000!
Trader 0x8742 opened a 10x long on 18,000 $ZEC ($17.63M) and is now down over $2.8M.
Liquidation price: $895.46.https://t.co/azzt3xvmay pic.twitter.com/wczndt7doC
— Lookonchain (@lookonchain) November 11, 2026
So why are the markets spooked, and why is ZEC taking the hardest hit?
Asking Why Is Crypto Crashing? Start With Tuesday’s CPI Report
Inflation came in hot. The consumer price index (CPI) rose 0.4% in October, above the 0.3% economists expected. Core prices, which leave out food and energy, rose 0.3% against a 0.2% forecast.
That reading crossed a line the Fed had drawn. Fed Governor Christopher Waller said in a speech hours before the report that core inflation of about 0.3% would make a half-point hike in December worth considering.
Traders took him at his word. On Polymarket, the odds of a hike of 0.5 percentage point or more in December went from 4.4% just before the report to 12.8% two hours later. They sit at 9.4% now, while a standard quarter-point hike is priced at 85.5%.
Higher rates hurt crypto in a simple way. They make cash and bonds pay more, so money flows out of riskier bets. On Tuesday, the 10-year U.S. Treasury yield rose from 4.86% to 4.98%.
Two more pressures added to it:
Nvidia: the chipmaker’s stock fell 5.5% to $168.89 on Tuesday, its lowest close since March 30. A Republican senator called on CEO Jensen Huang to resign over his affair. Crypto often follows the biggest AI stock lower.
ETF outflows: U.S. spot Bitcoin exchange-traded funds (ETFs) lost a net $969 million over the past five trading days. CryptoQuant author Axel Adler Jr. tracked the outflows in a report summarized by Lookonchain.
Market Intelligence: Crypto Analyst Predicts Best Low-Cap Crypto
Why Is Crypto Crashing? ZEC Is Falling Hardest Because It Rose the Most
ZEC had the most to give back. We compared the price changes of 20 large coins on Binance over the past week and since January 1.
ZEC: down 24.8% in seven days, the worst of the group, but still up 89% in 2026.
The rest: only two others, NEAR and Tron (TRX), are higher this year. Bitcoin is down 6.1% in a week and 15.9% since January 1.
When markets get nervous, traders tend to sell what has made them the most money. ZEC has fallen 41% from its September 26 closing high of $1,653.
Borrowed money made the drop faster. On Hyperliquid, ZEC fell from $1,199.20 to $965.79 in less than a day. Lookonchain counted 32 traders holding more than $1 million each in leveraged bets on a rising ZEC price. Of those, 27 are now losing money, with about $23.7 million in paper losses between them.
Sharp drops have not always lasted. Since January 2025, ZEC has fallen 12% or more in a single day 14 times on Binance. Seven days later, it was higher eight times, with a median gain of 6.5%.
EXPLORE: Fed Meeting Today: Traders Price a 95% Hold and a 79% December Hike. What Does It Mean for Crypto?
ZEC Price Analysis: Can $933 Hold Above the Whales’ Liquidation Zone?
ZEC trades at about $966. It touched $961.07 on Wednesday, its lowest price since September 4.
On the daily chart, where each candle covers one day, ZEC has fallen below its 50-day exponential moving average (EMA), an average that gives recent prices more weight, at $1,200.68. It is still above its 200-day EMA at $872.23.
Resistance: $1,050, Wednesday’s high, then $1,191.76, a recent swing high close to the 50-day EMA.
Support: $933.12, the September 4 low, then about $895. Lookonchain tracks two of the largest ZEC bulls on Hyperliquid, and they would be forced out of their positions near $894 and $895. Below that, the 200-day EMA sits at $872.23.
ZECUSDT 1D chart. Source: TradingView.
Scenario Trigger Level to watch Recovery A daily close above $1,050 $1,191.76, near the 50-day EMA Holding pattern ZEC stays between $933 and $1,050 A base above the September 4 low Further drop A daily close below $933 $895, where large liquidations sit, then the 200-day EMA at $872
For Bitcoin, the line to watch is Tuesday’s low of $72,727. Below that, $68,902, the August 20 low, is the next support.
So, why is crypto crashing? A hot inflation report raised the odds of a bigger Fed hike, and ZEC’s leveraged bulls are paying the most for it. A daily close back above $1,050 would be the first sign the selling is easing.
Market Intelligence: Crypto Analyst Reveals Upcoming Binance Listings
next
The post Why Is Crypto Crashing Today? Bitcoin Falls Below $73K as Zcash (ZEC) Leads Crypto Losses appeared first on Coinspeaker.
599
·
--
Verified
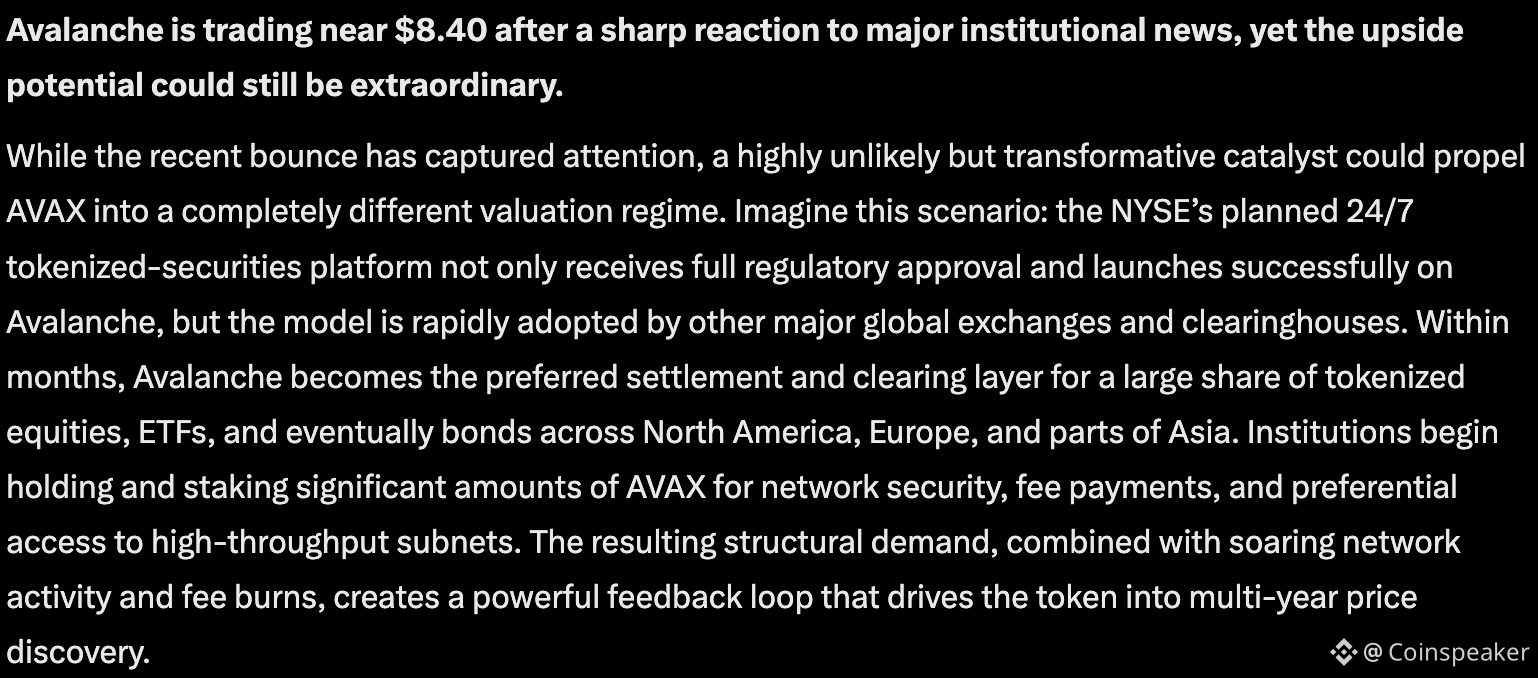
Article
Bill Gates Microsoft Copilot AI Predicts a Crazy AVAX Crypto MoveAvalanche (AVAX) is trading near $8.40 after a sharp reaction to major institutional news, yet the upside potential could still be extraordinary. While the recent AVAX crypto bounce has captured attention, Bill Gates Microsoft Copilot AI predicts a hypothetical but transformative catalyst could propel AVAX into a completely different valuation regime.
Copilot AI asks us to picture this scenario: The NYSE’s planned 24/7 tokenized-securities platform not only receives full regulatory approval but also launches successfully on Avalanche. This model is quickly adopted by other major global exchanges and clearinghouses.
(SOURCE: Copilot AI Predicts a Huge AVAX Crypto Move)
Within a few months, Avalanche becomes the preferred settlement and clearing layer for a significant portion of tokenized equities, ETFs, and eventually bonds across North America, Europe, and parts of Asia.
Institutions start holding and staking substantial amounts of AVAX for network security, fee payments, and preferential access to high-throughput subnets. This structural demand, coupled with increased network activity and fee burns, creates a powerful feedback loop that drives the token into a prolonged price discovery phase.
AVAX Crypto Technical Analysis: Can Avalanche Reclaim $10 in November?
(SOURCE: TradingView)
AVAX remains in a longer-term downtrend on higher timeframes but has shown constructive short-term behavior following the NYSE news. Price is currently consolidating near $8.30–$8.60 after reclaiming levels that had acted as resistance in prior sessions.
Key overhead hurdles sit around $9.00–$9.50 (cluster of moving averages and recent swing highs) and then the $10.50–$12.00 zone. A sustained break and hold above $10 would improve the intermediate structure and open measured-move targets toward previous cycle highs.
On the downside, support near $7.80–$8.20 remains important; holding this area keeps the recent recovery intact. Momentum indicators have improved from oversold conditions, and volume expanded on the NYSE-driven advance, suggesting the potential for further upside if institutional flows continue.
In an extreme adoption-driven scenario, Fibonacci extensions and multi-year base projections could theoretically support significantly higher levels once the broader crypto market turns risk-on.
Even against the current subdued market backdrop, the combination of a landmark institutional partnership and the hypothetical expansion of that model leaves room for an outsized outcome by early 2027.
DISCOVER: Best Meme Coins to Buy in 2026
How Bullish is the Recent New York Stock Exchange Avalanche Partnership Announcement?
BREAKING: Upcoming NYSE-affiliated tokenized securities platform’s core clearing and settlement layer will be built on top of Avalanche technology.
Avalanche will support the platform’s clearing firm, supporting the development of infrastructure for 24/7 trading, clearing, and… pic.twitter.com/LSzeFbGegN
— Avalanche🔺 (@avax) November 9, 2026
The most significant recent development is the New York Stock Exchange’s selection of Avalanche as the core ledger for clearing and settlement on its upcoming tokenized stock trading platform.
The announcement, which aims to enable round-the-clock trading and instant settlement (pending regulatory approval), triggered an immediate double-digit percentage rally in AVAX and marked one of the strongest institutional endorsements the network has received.
Additional positive momentum includes Charles Schwab adding Avalanche to its retail crypto trading offerings, continued institutional experimentation with Avalanche subnets (including products linked to major financial firms), and improving on-chain metrics such as rising DEX volumes and real-world asset activity in recent quarters.
These building blocks provide a foundation; if the NYSE initiative scales as hoped, they could compound into far greater demand for the native token.
Copilot AI Predicts an AVAX Crypto Explosion: What is the Final Prediction?
By January 1, 2027, in this over-the-top bullish scenario, Avalanche (AVAX) could reach between $95 and $140, with a stretch target above $180 if tokenized securities settlement on the network scales globally.
This remains pure speculation and entertainment, not a realistic base-case outlook. The hypothetical catalyst would require extraordinary institutional coordination, but the focus should be on real announcements, such as the NYSE using Avalanche to launch tokenized stocks.
EXPLORE: Meme Coin Supercycle? Best Picks for Q4
next
The post Bill Gates Microsoft Copilot AI Predicts a Crazy AVAX Crypto Move appeared first on Coinspeaker.
Bill Gates Microsoft Copilot AI Predicts a Crazy AVAX Crypto Move
Avalanche (AVAX) is trading near $8.40 after a sharp reaction to major institutional news, yet the upside potential could still be extraordinary. While the recent AVAX crypto bounce has captured attention, Bill Gates Microsoft Copilot AI predicts a hypothetical but transformative catalyst could propel AVAX into a completely different valuation regime.
Copilot AI asks us to picture this scenario: The NYSE’s planned 24/7 tokenized-securities platform not only receives full regulatory approval but also launches successfully on Avalanche. This model is quickly adopted by other major global exchanges and clearinghouses.
(SOURCE: Copilot AI Predicts a Huge AVAX Crypto Move)
Within a few months, Avalanche becomes the preferred settlement and clearing layer for a significant portion of tokenized equities, ETFs, and eventually bonds across North America, Europe, and parts of Asia.
Institutions start holding and staking substantial amounts of AVAX for network security, fee payments, and preferential access to high-throughput subnets. This structural demand, coupled with increased network activity and fee burns, creates a powerful feedback loop that drives the token into a prolonged price discovery phase.
AVAX Crypto Technical Analysis: Can Avalanche Reclaim $10 in November?
(SOURCE: TradingView)
AVAX remains in a longer-term downtrend on higher timeframes but has shown constructive short-term behavior following the NYSE news. Price is currently consolidating near $8.30–$8.60 after reclaiming levels that had acted as resistance in prior sessions.
Key overhead hurdles sit around $9.00–$9.50 (cluster of moving averages and recent swing highs) and then the $10.50–$12.00 zone. A sustained break and hold above $10 would improve the intermediate structure and open measured-move targets toward previous cycle highs.
On the downside, support near $7.80–$8.20 remains important; holding this area keeps the recent recovery intact. Momentum indicators have improved from oversold conditions, and volume expanded on the NYSE-driven advance, suggesting the potential for further upside if institutional flows continue.
In an extreme adoption-driven scenario, Fibonacci extensions and multi-year base projections could theoretically support significantly higher levels once the broader crypto market turns risk-on.
Even against the current subdued market backdrop, the combination of a landmark institutional partnership and the hypothetical expansion of that model leaves room for an outsized outcome by early 2027.
DISCOVER: Best Meme Coins to Buy in 2026
How Bullish is the Recent New York Stock Exchange Avalanche Partnership Announcement?
BREAKING: Upcoming NYSE-affiliated tokenized securities platform’s core clearing and settlement layer will be built on top of Avalanche technology.
Avalanche will support the platform’s clearing firm, supporting the development of infrastructure for 24/7 trading, clearing, and… pic.twitter.com/LSzeFbGegN
— Avalanche🔺 (@avax) November 9, 2026
The most significant recent development is the New York Stock Exchange’s selection of Avalanche as the core ledger for clearing and settlement on its upcoming tokenized stock trading platform.
The announcement, which aims to enable round-the-clock trading and instant settlement (pending regulatory approval), triggered an immediate double-digit percentage rally in AVAX and marked one of the strongest institutional endorsements the network has received.
Additional positive momentum includes Charles Schwab adding Avalanche to its retail crypto trading offerings, continued institutional experimentation with Avalanche subnets (including products linked to major financial firms), and improving on-chain metrics such as rising DEX volumes and real-world asset activity in recent quarters.
These building blocks provide a foundation; if the NYSE initiative scales as hoped, they could compound into far greater demand for the native token.
Copilot AI Predicts an AVAX Crypto Explosion: What is the Final Prediction?
By January 1, 2027, in this over-the-top bullish scenario, Avalanche (AVAX) could reach between $95 and $140, with a stretch target above $180 if tokenized securities settlement on the network scales globally.
This remains pure speculation and entertainment, not a realistic base-case outlook. The hypothetical catalyst would require extraordinary institutional coordination, but the focus should be on real announcements, such as the NYSE using Avalanche to launch tokenized stocks.
EXPLORE: Meme Coin Supercycle? Best Picks for Q4
next
The post Bill Gates Microsoft Copilot AI Predicts a Crazy AVAX Crypto Move appeared first on Coinspeaker.
Copilot AI asks us to picture this scenario: The NYSE’s planned 24/7 tokenized-securities platform not only receives full regulatory approval but also launches successfully on Avalanche. This model is quickly adopted by other major global exchanges and clearinghouses.
(SOURCE: Copilot AI Predicts a Huge AVAX Crypto Move)
Within a few months, Avalanche becomes the preferred settlement and clearing layer for a significant portion of tokenized equities, ETFs, and eventually bonds across North America, Europe, and parts of Asia.
Institutions start holding and staking substantial amounts of AVAX for network security, fee payments, and preferential access to high-throughput subnets. This structural demand, coupled with increased network activity and fee burns, creates a powerful feedback loop that drives the token into a prolonged price discovery phase.
AVAX Crypto Technical Analysis: Can Avalanche Reclaim $10 in November?
(SOURCE: TradingView)
AVAX remains in a longer-term downtrend on higher timeframes but has shown constructive short-term behavior following the NYSE news. Price is currently consolidating near $8.30–$8.60 after reclaiming levels that had acted as resistance in prior sessions.
Key overhead hurdles sit around $9.00–$9.50 (cluster of moving averages and recent swing highs) and then the $10.50–$12.00 zone. A sustained break and hold above $10 would improve the intermediate structure and open measured-move targets toward previous cycle highs.
On the downside, support near $7.80–$8.20 remains important; holding this area keeps the recent recovery intact. Momentum indicators have improved from oversold conditions, and volume expanded on the NYSE-driven advance, suggesting the potential for further upside if institutional flows continue.
In an extreme adoption-driven scenario, Fibonacci extensions and multi-year base projections could theoretically support significantly higher levels once the broader crypto market turns risk-on.
Even against the current subdued market backdrop, the combination of a landmark institutional partnership and the hypothetical expansion of that model leaves room for an outsized outcome by early 2027.
DISCOVER: Best Meme Coins to Buy in 2026
How Bullish is the Recent New York Stock Exchange Avalanche Partnership Announcement?
BREAKING: Upcoming NYSE-affiliated tokenized securities platform’s core clearing and settlement layer will be built on top of Avalanche technology.
Avalanche will support the platform’s clearing firm, supporting the development of infrastructure for 24/7 trading, clearing, and… pic.twitter.com/LSzeFbGegN
— Avalanche🔺 (@avax) November 9, 2026
The most significant recent development is the New York Stock Exchange’s selection of Avalanche as the core ledger for clearing and settlement on its upcoming tokenized stock trading platform.
The announcement, which aims to enable round-the-clock trading and instant settlement (pending regulatory approval), triggered an immediate double-digit percentage rally in AVAX and marked one of the strongest institutional endorsements the network has received.
Additional positive momentum includes Charles Schwab adding Avalanche to its retail crypto trading offerings, continued institutional experimentation with Avalanche subnets (including products linked to major financial firms), and improving on-chain metrics such as rising DEX volumes and real-world asset activity in recent quarters.
These building blocks provide a foundation; if the NYSE initiative scales as hoped, they could compound into far greater demand for the native token.
Copilot AI Predicts an AVAX Crypto Explosion: What is the Final Prediction?
By January 1, 2027, in this over-the-top bullish scenario, Avalanche (AVAX) could reach between $95 and $140, with a stretch target above $180 if tokenized securities settlement on the network scales globally.
This remains pure speculation and entertainment, not a realistic base-case outlook. The hypothetical catalyst would require extraordinary institutional coordination, but the focus should be on real announcements, such as the NYSE using Avalanche to launch tokenized stocks.
EXPLORE: Meme Coin Supercycle? Best Picks for Q4
next
The post Bill Gates Microsoft Copilot AI Predicts a Crazy AVAX Crypto Move appeared first on Coinspeaker.
3
682
·
--
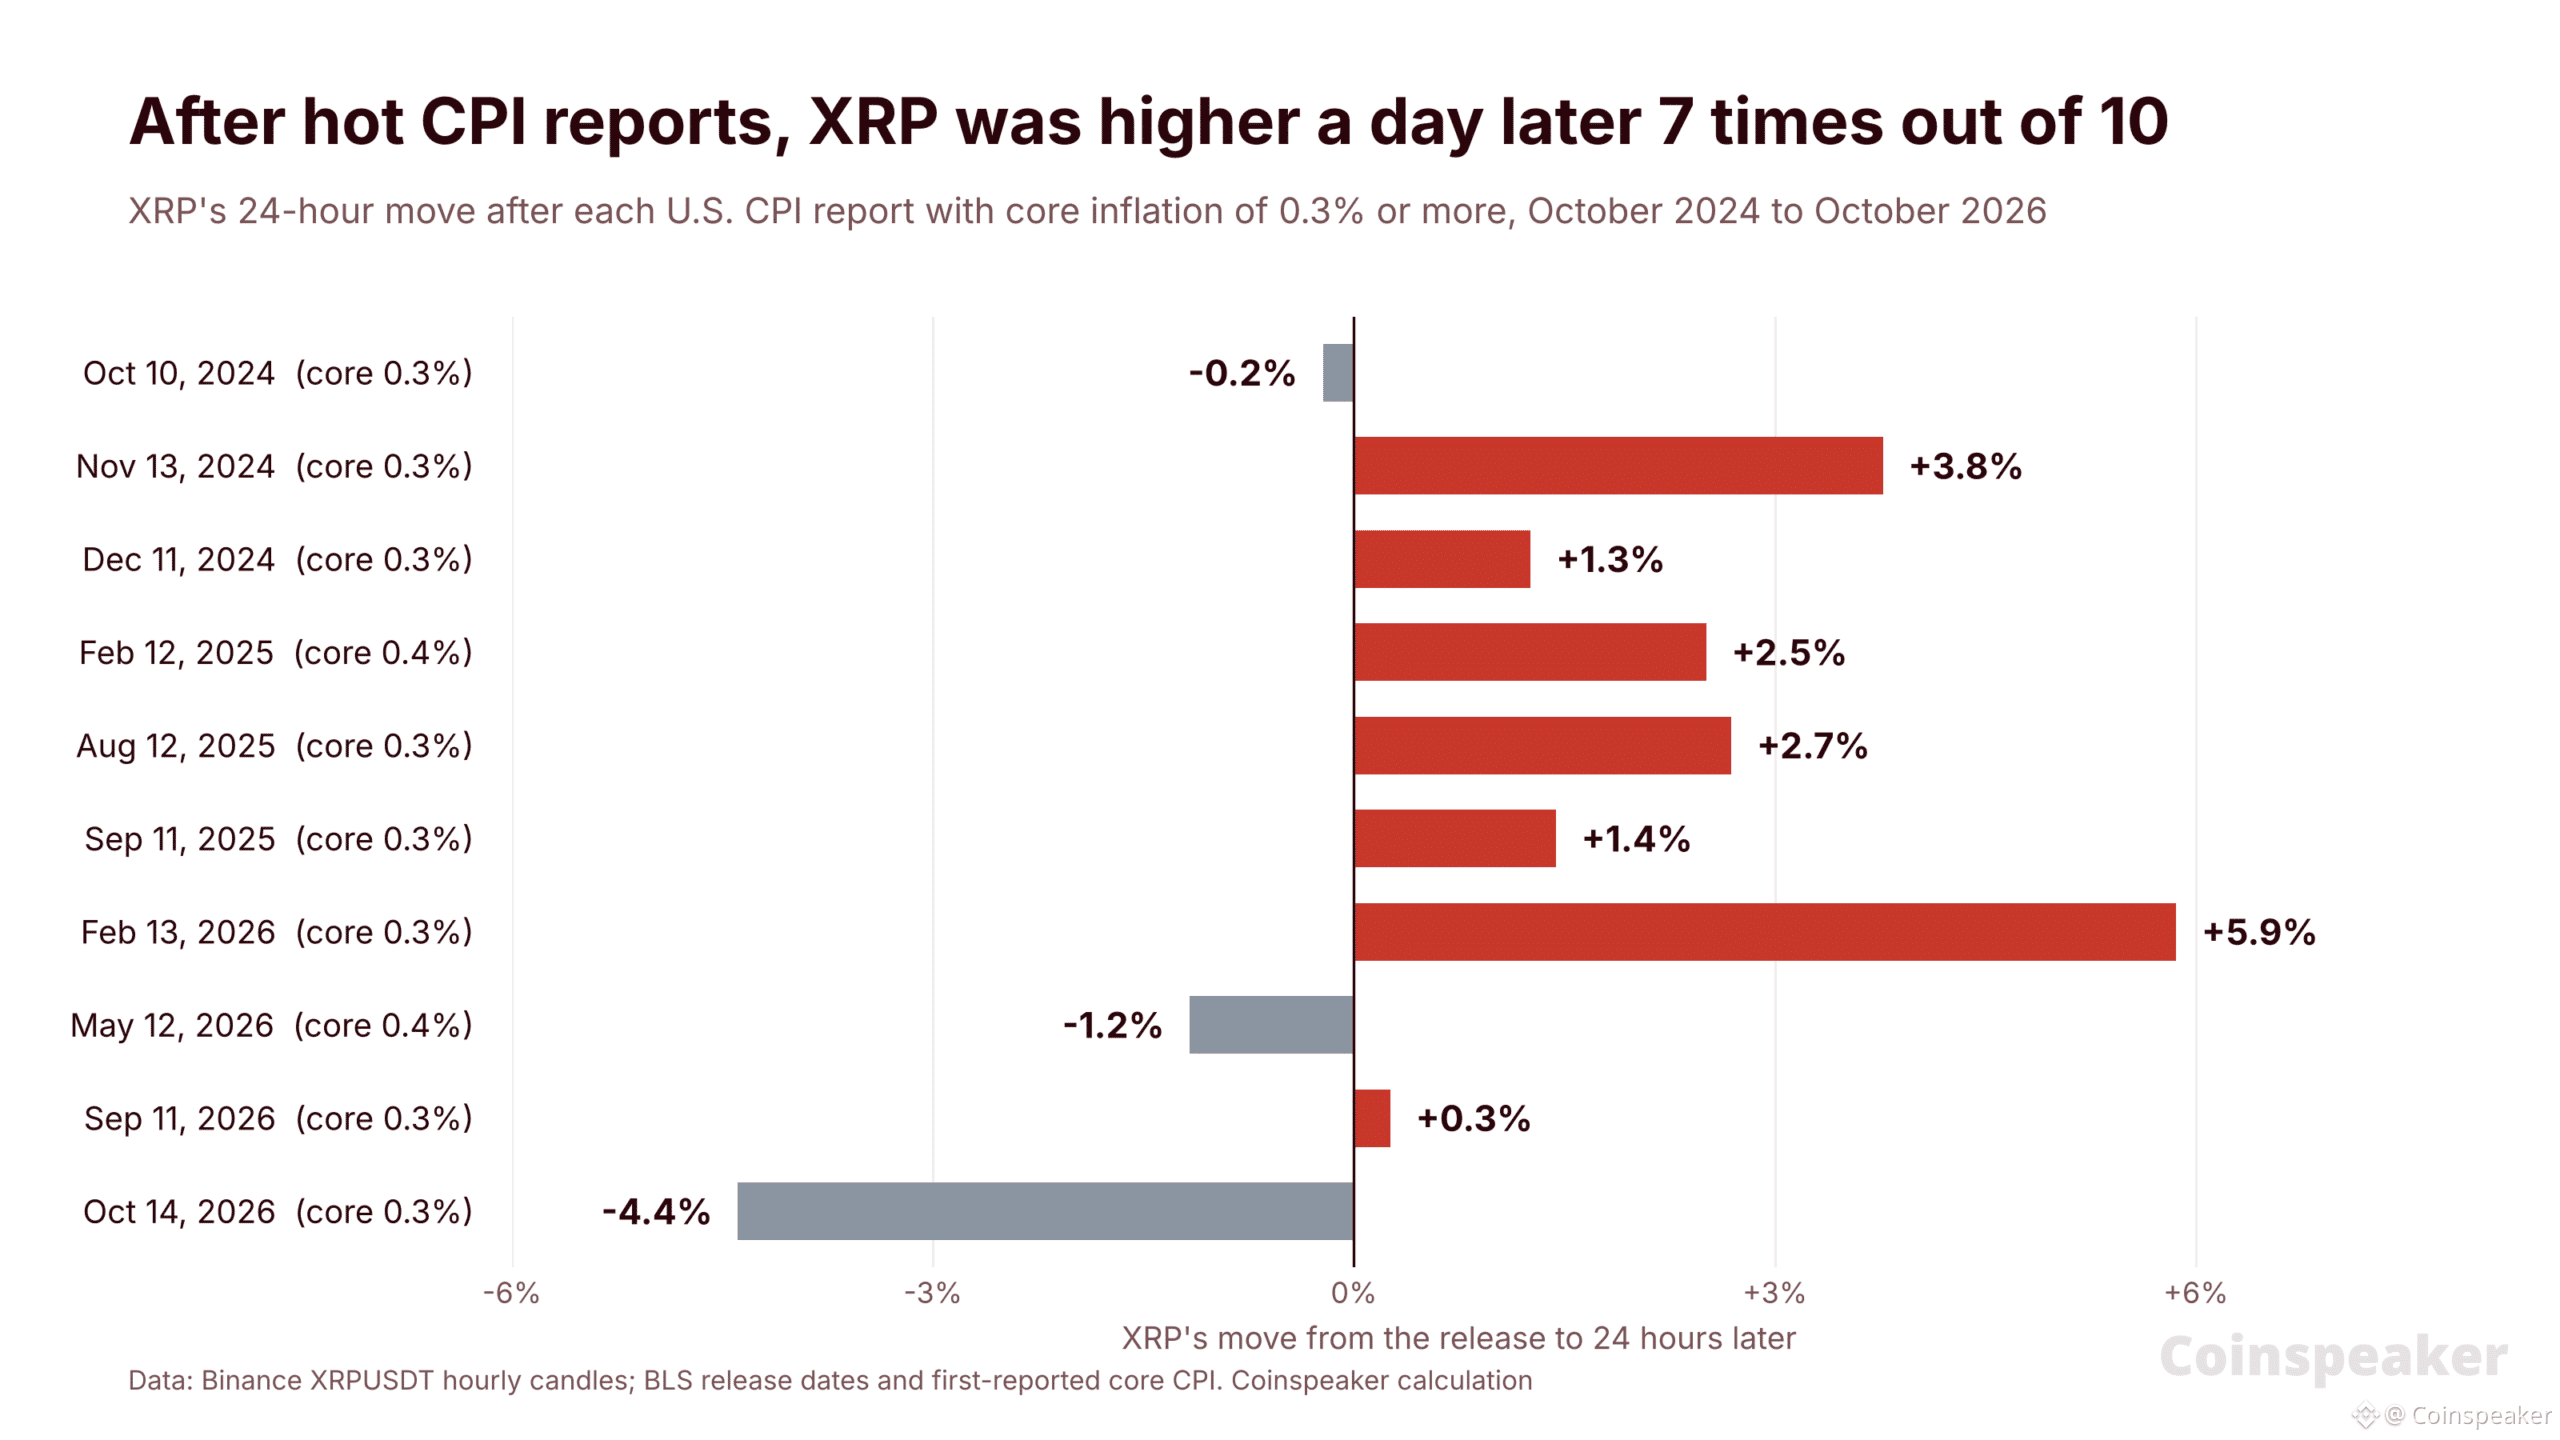
Article
XRP Price Plunges to $1.05 After a Hot CPI Report: Will the Support Stand?Ripple XRP fell to $1.05 on Tuesday within five minutes of the U.S. October consumer price index (CPI) report, which showed XRP USD price rising faster than economists expected.
XRP crypto traded at $1.0797 when the report came out at 8:30 a.m. in New York, or 13:30 UTC. By 13:35 UTC it had touched $1.0500 on Binance, a 2.8% drop and its lowest price since August 19. It has since bounced to about $1.07. Bitcoin fell with it, dropping to $73,525 in the same five minutes.
The drop puts XRP back on a level it has tested before. Between late June and mid-August, XRP traded around $1.05 for weeks. The level held the first time and broke the second.
So will the support stand this time, and what do the CPI numbers tell us?
BREAKING: October CPI inflation rises +0.4% month-over-month, above expectations of +0.3%.
Core CPI inflation rose +0.3%, also above expectations of +0.2%.
BLS will not be releasing year-over-year figures due to the October 2025 government shutdown.
Inflation still appears to…
— The Kobeissi Letter (@KobeissiLetter) November 10, 2026
The CPI Numbers Point to a Bigger Fed Rate Hike: But What Does CPI Mean for XRP?
Prices rose faster than forecast in October. The Bureau of Labor Statistics said consumer prices rose 0.4% in the month, against the 0.3% economists expected.
Core prices, which leave out food and energy because they swing the most, rose 0.3%. The forecast was 0.2%. Core inflation has now run at about 0.3% for three months in a row.
The report is missing one usual figure. The bureau did not publish a yearly inflation rate because it never collected prices in October 2025, during the government shutdown. That leaves the monthly numbers to carry the whole report.
Those monthly numbers matter for the Federal Reserve. Fed Governor Christopher Waller said in a speech this morning that he already leans toward a 0.25 percentage point rate hike in December. If core CPI came in around 0.3% again, he said, a 0.5 point hike “should be considered”.
Core CPI did come in at 0.3%. Before the release, traders saw almost no chance of a hike that large. Higher rates make cash and bonds pay more, which tends to pull money out of risky assets like XRP.
Market Intelligence: Crypto Analyst Predicts Next Crypto to Hit 1 Dollar
Ripple XRP Has Usually Recovered a Day After a Hot CPI: Will the Pattern Repeat?
The first move after a hot report has often faded. We measured XRP’s price on Binance in the 24 hours after each of the last 24 CPI reports, from October 2024 to October 2026.
Ten of those reports had core inflation of 0.3% or higher, like today’s. After seven of them, XRP was higher 24 hours later. The median move was a 1.4% gain.
The record is weaker this year. Of the four hot reports in 2026, XRP was higher a day later only twice. After the last one, on October 14, it fell 4.4% in 24 hours.
The difference this time is the Fed. A hot report that only confirms a small hike is easier for traders to shrug off. One that puts a larger hike on the table, as Waller laid out, gives sellers more to work with.
EXPLORE: XRP Price Forecast: Ripple at Risk of Losing Key Support, $1 Next?
The $1.05 Support Has Held Once and Broken Once
The level has a history this year. XRP has spent two long stretches around $1.05 since June.
Late June to early July: XRP traded between $1.02 and $1.07 for about a week. It bottomed at $1.022 on July 1 and climbed back above $1.11 the next day. The support held.
Early August: XRP closed at $1.035 on August 6 and kept falling. It dropped to $0.986 on August 14, its last trip below $1, before jumping back above $1.10 on August 19. The support broke.
Today’s low of $1.0500 sits right on that zone. The first test of a level often holds. Each new test tends to leave fewer buyers there.
Ripple XRP Price Analysis: Can $1.05 Hold?
XRP trades at about $1.07 on Binance after the CPI drop, down 2.8% in 24 hours and 17% in a week. It is 71% below its July 2025 record of $3.65.
On the daily chart, where each candle covers one day, XRP sits well below both of its exponential moving averages (EMAs), averages that give recent prices more weight. The 50-day EMA stands at $1.294 and the 200-day EMA at $1.350.
Resistance: $1.130, a recent swing high, then $1.165. Above that, $1.294, the 50-day EMA.
Support: $1.050, today’s low, then $1.022, the July 1 low. Below that, $0.986, the August 14 low.
XRPUSDT 1D chart. Source: Binance.
Path What has to happen Next stop Bounce A daily close above $1.130 $1.165, then the 50-day EMA at $1.294 Hold the floor XRP stays between $1.050 and $1.130 A base like late June’s Break down A daily close below $1.050 $1.022, then $0.986
For Ripple XRP, the first test of $1.05 has held so far. The daily close decides it: a close above $1.05 keeps the support alive, while a close below it opens the way to $1.
Market Intelligence: Crypto Analyst Predicts Top Solana Meme Coins to Bid
next
The post XRP Price Plunges to $1.05 After a Hot CPI Report: Will the Support Stand? appeared first on Coinspeaker.
XRP Price Plunges to $1.05 After a Hot CPI Report: Will the Support Stand?
Ripple XRP fell to $1.05 on Tuesday within five minutes of the U.S. October consumer price index (CPI) report, which showed XRP USD price rising faster than economists expected.
XRP crypto traded at $1.0797 when the report came out at 8:30 a.m. in New York, or 13:30 UTC. By 13:35 UTC it had touched $1.0500 on Binance, a 2.8% drop and its lowest price since August 19. It has since bounced to about $1.07. Bitcoin fell with it, dropping to $73,525 in the same five minutes.
The drop puts XRP back on a level it has tested before. Between late June and mid-August, XRP traded around $1.05 for weeks. The level held the first time and broke the second.
So will the support stand this time, and what do the CPI numbers tell us?
BREAKING: October CPI inflation rises +0.4% month-over-month, above expectations of +0.3%.
Core CPI inflation rose +0.3%, also above expectations of +0.2%.
BLS will not be releasing year-over-year figures due to the October 2025 government shutdown.
Inflation still appears to…
— The Kobeissi Letter (@KobeissiLetter) November 10, 2026
The CPI Numbers Point to a Bigger Fed Rate Hike: But What Does CPI Mean for XRP?
Prices rose faster than forecast in October. The Bureau of Labor Statistics said consumer prices rose 0.4% in the month, against the 0.3% economists expected.
Core prices, which leave out food and energy because they swing the most, rose 0.3%. The forecast was 0.2%. Core inflation has now run at about 0.3% for three months in a row.
The report is missing one usual figure. The bureau did not publish a yearly inflation rate because it never collected prices in October 2025, during the government shutdown. That leaves the monthly numbers to carry the whole report.
Those monthly numbers matter for the Federal Reserve. Fed Governor Christopher Waller said in a speech this morning that he already leans toward a 0.25 percentage point rate hike in December. If core CPI came in around 0.3% again, he said, a 0.5 point hike “should be considered”.
Core CPI did come in at 0.3%. Before the release, traders saw almost no chance of a hike that large. Higher rates make cash and bonds pay more, which tends to pull money out of risky assets like XRP.
Market Intelligence: Crypto Analyst Predicts Next Crypto to Hit 1 Dollar
Ripple XRP Has Usually Recovered a Day After a Hot CPI: Will the Pattern Repeat?
The first move after a hot report has often faded. We measured XRP’s price on Binance in the 24 hours after each of the last 24 CPI reports, from October 2024 to October 2026.
Ten of those reports had core inflation of 0.3% or higher, like today’s. After seven of them, XRP was higher 24 hours later. The median move was a 1.4% gain.
The record is weaker this year. Of the four hot reports in 2026, XRP was higher a day later only twice. After the last one, on October 14, it fell 4.4% in 24 hours.
The difference this time is the Fed. A hot report that only confirms a small hike is easier for traders to shrug off. One that puts a larger hike on the table, as Waller laid out, gives sellers more to work with.
EXPLORE: XRP Price Forecast: Ripple at Risk of Losing Key Support, $1 Next?
The $1.05 Support Has Held Once and Broken Once
The level has a history this year. XRP has spent two long stretches around $1.05 since June.
Late June to early July: XRP traded between $1.02 and $1.07 for about a week. It bottomed at $1.022 on July 1 and climbed back above $1.11 the next day. The support held.
Early August: XRP closed at $1.035 on August 6 and kept falling. It dropped to $0.986 on August 14, its last trip below $1, before jumping back above $1.10 on August 19. The support broke.
Today’s low of $1.0500 sits right on that zone. The first test of a level often holds. Each new test tends to leave fewer buyers there.
Ripple XRP Price Analysis: Can $1.05 Hold?
XRP trades at about $1.07 on Binance after the CPI drop, down 2.8% in 24 hours and 17% in a week. It is 71% below its July 2025 record of $3.65.
On the daily chart, where each candle covers one day, XRP sits well below both of its exponential moving averages (EMAs), averages that give recent prices more weight. The 50-day EMA stands at $1.294 and the 200-day EMA at $1.350.
Resistance: $1.130, a recent swing high, then $1.165. Above that, $1.294, the 50-day EMA.
Support: $1.050, today’s low, then $1.022, the July 1 low. Below that, $0.986, the August 14 low.
XRPUSDT 1D chart. Source: Binance.
Path What has to happen Next stop Bounce A daily close above $1.130 $1.165, then the 50-day EMA at $1.294 Hold the floor XRP stays between $1.050 and $1.130 A base like late June’s Break down A daily close below $1.050 $1.022, then $0.986
For Ripple XRP, the first test of $1.05 has held so far. The daily close decides it: a close above $1.05 keeps the support alive, while a close below it opens the way to $1.
Market Intelligence: Crypto Analyst Predicts Top Solana Meme Coins to Bid
next
The post XRP Price Plunges to $1.05 After a Hot CPI Report: Will the Support Stand? appeared first on Coinspeaker.
XRP crypto traded at $1.0797 when the report came out at 8:30 a.m. in New York, or 13:30 UTC. By 13:35 UTC it had touched $1.0500 on Binance, a 2.8% drop and its lowest price since August 19. It has since bounced to about $1.07. Bitcoin fell with it, dropping to $73,525 in the same five minutes.
The drop puts XRP back on a level it has tested before. Between late June and mid-August, XRP traded around $1.05 for weeks. The level held the first time and broke the second.
So will the support stand this time, and what do the CPI numbers tell us?
BREAKING: October CPI inflation rises +0.4% month-over-month, above expectations of +0.3%.
Core CPI inflation rose +0.3%, also above expectations of +0.2%.
BLS will not be releasing year-over-year figures due to the October 2025 government shutdown.
Inflation still appears to…
— The Kobeissi Letter (@KobeissiLetter) November 10, 2026
The CPI Numbers Point to a Bigger Fed Rate Hike: But What Does CPI Mean for XRP?
Prices rose faster than forecast in October. The Bureau of Labor Statistics said consumer prices rose 0.4% in the month, against the 0.3% economists expected.
Core prices, which leave out food and energy because they swing the most, rose 0.3%. The forecast was 0.2%. Core inflation has now run at about 0.3% for three months in a row.
The report is missing one usual figure. The bureau did not publish a yearly inflation rate because it never collected prices in October 2025, during the government shutdown. That leaves the monthly numbers to carry the whole report.
Those monthly numbers matter for the Federal Reserve. Fed Governor Christopher Waller said in a speech this morning that he already leans toward a 0.25 percentage point rate hike in December. If core CPI came in around 0.3% again, he said, a 0.5 point hike “should be considered”.
Core CPI did come in at 0.3%. Before the release, traders saw almost no chance of a hike that large. Higher rates make cash and bonds pay more, which tends to pull money out of risky assets like XRP.
Market Intelligence: Crypto Analyst Predicts Next Crypto to Hit 1 Dollar
Ripple XRP Has Usually Recovered a Day After a Hot CPI: Will the Pattern Repeat?
The first move after a hot report has often faded. We measured XRP’s price on Binance in the 24 hours after each of the last 24 CPI reports, from October 2024 to October 2026.
Ten of those reports had core inflation of 0.3% or higher, like today’s. After seven of them, XRP was higher 24 hours later. The median move was a 1.4% gain.
The record is weaker this year. Of the four hot reports in 2026, XRP was higher a day later only twice. After the last one, on October 14, it fell 4.4% in 24 hours.
The difference this time is the Fed. A hot report that only confirms a small hike is easier for traders to shrug off. One that puts a larger hike on the table, as Waller laid out, gives sellers more to work with.
EXPLORE: XRP Price Forecast: Ripple at Risk of Losing Key Support, $1 Next?
The $1.05 Support Has Held Once and Broken Once
The level has a history this year. XRP has spent two long stretches around $1.05 since June.
Late June to early July: XRP traded between $1.02 and $1.07 for about a week. It bottomed at $1.022 on July 1 and climbed back above $1.11 the next day. The support held.
Early August: XRP closed at $1.035 on August 6 and kept falling. It dropped to $0.986 on August 14, its last trip below $1, before jumping back above $1.10 on August 19. The support broke.
Today’s low of $1.0500 sits right on that zone. The first test of a level often holds. Each new test tends to leave fewer buyers there.
Ripple XRP Price Analysis: Can $1.05 Hold?
XRP trades at about $1.07 on Binance after the CPI drop, down 2.8% in 24 hours and 17% in a week. It is 71% below its July 2025 record of $3.65.
On the daily chart, where each candle covers one day, XRP sits well below both of its exponential moving averages (EMAs), averages that give recent prices more weight. The 50-day EMA stands at $1.294 and the 200-day EMA at $1.350.
Resistance: $1.130, a recent swing high, then $1.165. Above that, $1.294, the 50-day EMA.
Support: $1.050, today’s low, then $1.022, the July 1 low. Below that, $0.986, the August 14 low.
XRPUSDT 1D chart. Source: Binance.
Path What has to happen Next stop Bounce A daily close above $1.130 $1.165, then the 50-day EMA at $1.294 Hold the floor XRP stays between $1.050 and $1.130 A base like late June’s Break down A daily close below $1.050 $1.022, then $0.986
For Ripple XRP, the first test of $1.05 has held so far. The daily close decides it: a close above $1.05 keeps the support alive, while a close below it opens the way to $1.
Market Intelligence: Crypto Analyst Predicts Top Solana Meme Coins to Bid
next
The post XRP Price Plunges to $1.05 After a Hot CPI Report: Will the Support Stand? appeared first on Coinspeaker.
2
470
·
--
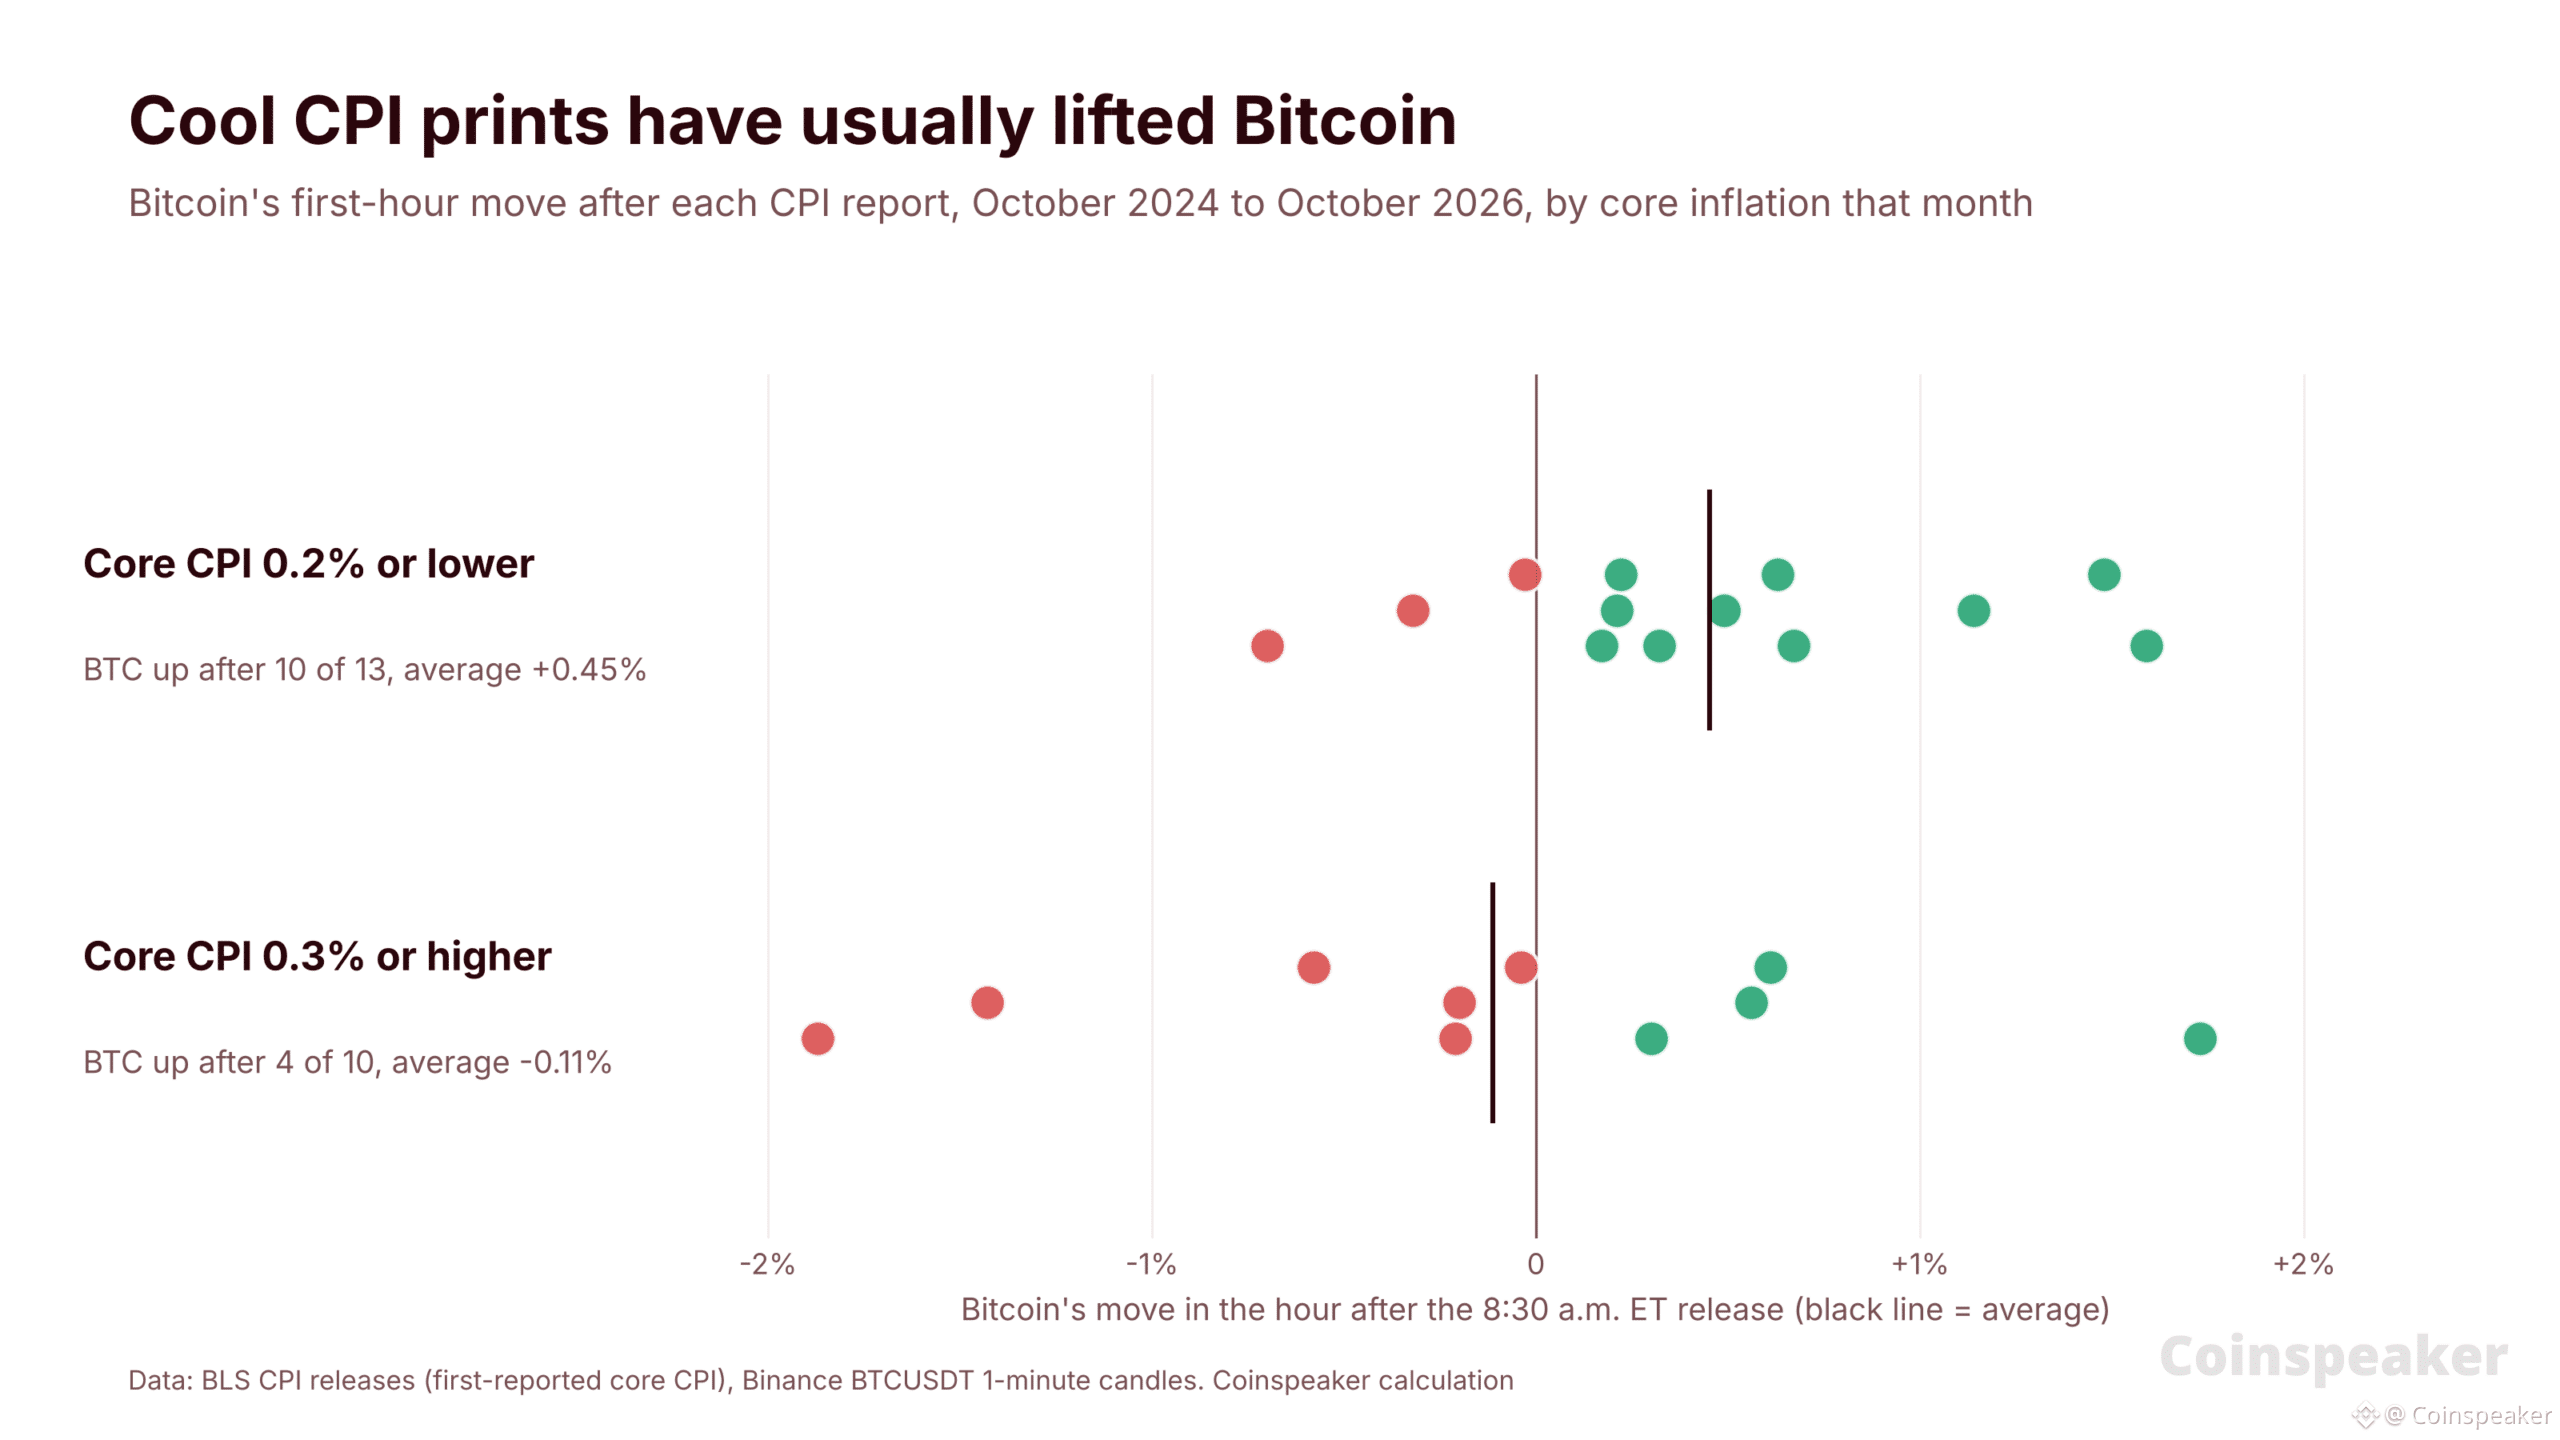
Article
Bitcoin CPI Reaction: 10 of 13 Cool Inflation Reports Triggered an Hourly Gain – Can Inflation Da...The U.S. Bureau of Labor Statistics publishes October’s consumer price index (CPI) on Tuesday, November 10, at 8:30 a.m. in New York, or 13:30 UTC. The Bitcoin CPI reaction that follows could set the tone for the week. The CPI is the main U.S. measure of inflation, and it will shape the Federal Reserve’s next rate decision.
Economists expect core prices, which leave out food and energy, to have risen about 0.22% in the month. That would be a slowdown from September’s 0.33%.
Economists expect growth in the core CPI to have moderated in October to around 0.22%, though the full range of estimates is broad enough to round down to 0.1% or round up to 0.3%.
Due to the government shutdown in Oct 2025, there's no tidy year-earlier figure. pic.twitter.com/CFM7ikw8fO
— Nick Timiraos (@NickTimiraos) November 9, 2026
Bitcoin trades near $74,400, still close to Sunday’s two-month low of $73,510.
CPI days move crypto. We checked Bitcoin’s first hour after the last 24 releases. When core inflation came in at 0.2% or lower, BTC rose in that hour 10 times out of 13. When it came in at 0.3% or higher, it rose only 4 times out of 10.
So which way will today’s number push Bitcoin?
Economists Expect Inflation to Cool, but the Range Is Wide
The forecasts point to a calmer month. Seventeen banks and research firms surveyed by The Wall Street Journal see a median rise of 0.25% for headline CPI and 0.22% for core. Journal reporter Nick Timiraos posted the table on X.
Headline CPI: forecasts run from 0.14% at Nomura to 0.29% at Pinebrook Capital, against 0.65% in September.
Core CPI: forecasts run from 0.13% at Nomura to 0.28% at BNP Paribas and Pinebrook, against 0.33% in September.
Yearly rate: the BLS put September’s inflation at 3.7% for headline prices and 2.6% for core.
That spread matters. The government reports CPI rounded to one decimal place. With forecasts this spread out, the core reading could print anywhere from 0.1% to 0.3%. A 0.3% would match September’s pace and read as inflation that is not cooling.
The yearly comparison will also be messy. The government shutdown in October 2025 meant no CPI was published for that month, so there is no clean year-over-year figure.
Market Intelligence: Crypto Analyst Predicts Best Low-Cap Crypto
Today’s Report Is the Last CPI Before a Likely Fed Hike
This is the last CPI report the Federal Reserve will see before its December 8-9 meeting. Traders already expect a rate hike: on Tuesday morning, Polymarket gives an 86.5% chance of a 0.25-point increase and 11.5% for no change.
Higher rates tend to weigh on Bitcoin. They make cash and bonds pay more, which pulls money away from assets that pay no interest, like crypto.
A cool reading could shave those odds and give Bitcoin room to bounce. A hot one would lock in the hike.
DISCOVER: Fed Meeting Today: Traders Price a 95% Hold and a 79% December Hike. What Does It Mean for Crypto?
The Bitcoin CPI Reaction: Cool Prints Usually Lift BTC Within the Hour
We measured the Bitcoin CPI reaction on Binance. We took the 24 CPI reports published since October 2024 and measured Bitcoin’s move in the hour after each 8:30 a.m. release.
Bigger swings: the median gap between BTC’s high and low in that hour was 1.17%, almost double the 0.62% in the same hour on other weekdays.
Core at 0.2% or lower, 13 reports: BTC rose in the first hour 10 times, by 0.45% on average.
Core at 0.3% or higher, 10 reports: BTC rose only 4 times and slipped 0.11% on average.
The pattern is a lean, not a rule. The biggest drop came on February 12, 2025, when core rose 0.4% and BTC lost 1.9% in an hour. Last month’s 0.3% reading cost it 1.4%.
Bitcoin Price Analysis: Can BTC Hold $73,510?
So far it has. BTC trades at $74,398 on Binance, about 1.2% above Sunday’s low.
On the daily chart, Bitcoin sits below both of its exponential moving averages (EMAs), averages that weight recent prices more. The 200-day EMA is at $76,481 and the 50-day EMA at $79,128.
Resistance: $75,599, Monday’s high, then $76,481, the 200-day EMA. Above that, $79,128, the 50-day EMA.
Support: $74,177, Tuesday’s low, then $73,510, Sunday’s low. Below that, $73,027, the August 21 low.
BTCUSDT 1D chart. Source: TradingView.
CPI outcome What it could mean Level to watch Core at 0.1% Hike odds ease, room for a bounce $75,599, then $76,481 Core at 0.2% In line, the market likely stays cautious A range between $73,510 and $75,599 Core at 0.3% or higher December hike locked in $73,510, then $73,027
For anyone tracking the Bitcoin CPI reaction, the first hour after 8:30 a.m. is the one to watch. In 20 of the last 24 reports, Bitcoin ended the next 24 hours moving in the same direction as in that first hour.
Market Intelligence: Crypto Analyst Predicts Best New Crypto to Hodl
next
The post Bitcoin CPI Reaction: 10 of 13 Cool Inflation Reports Triggered an Hourly Gain – Can Inflation Data Reverse the Downtrend? appeared first on Coinspeaker.
Bitcoin CPI Reaction: 10 of 13 Cool Inflation Reports Triggered an Hourly Gain – Can Inflation Da...
The U.S. Bureau of Labor Statistics publishes October’s consumer price index (CPI) on Tuesday, November 10, at 8:30 a.m. in New York, or 13:30 UTC. The Bitcoin CPI reaction that follows could set the tone for the week. The CPI is the main U.S. measure of inflation, and it will shape the Federal Reserve’s next rate decision.
Economists expect core prices, which leave out food and energy, to have risen about 0.22% in the month. That would be a slowdown from September’s 0.33%.
Economists expect growth in the core CPI to have moderated in October to around 0.22%, though the full range of estimates is broad enough to round down to 0.1% or round up to 0.3%.
Due to the government shutdown in Oct 2025, there's no tidy year-earlier figure. pic.twitter.com/CFM7ikw8fO
— Nick Timiraos (@NickTimiraos) November 9, 2026
Bitcoin trades near $74,400, still close to Sunday’s two-month low of $73,510.
CPI days move crypto. We checked Bitcoin’s first hour after the last 24 releases. When core inflation came in at 0.2% or lower, BTC rose in that hour 10 times out of 13. When it came in at 0.3% or higher, it rose only 4 times out of 10.
So which way will today’s number push Bitcoin?
Economists Expect Inflation to Cool, but the Range Is Wide
The forecasts point to a calmer month. Seventeen banks and research firms surveyed by The Wall Street Journal see a median rise of 0.25% for headline CPI and 0.22% for core. Journal reporter Nick Timiraos posted the table on X.
Headline CPI: forecasts run from 0.14% at Nomura to 0.29% at Pinebrook Capital, against 0.65% in September.
Core CPI: forecasts run from 0.13% at Nomura to 0.28% at BNP Paribas and Pinebrook, against 0.33% in September.
Yearly rate: the BLS put September’s inflation at 3.7% for headline prices and 2.6% for core.
That spread matters. The government reports CPI rounded to one decimal place. With forecasts this spread out, the core reading could print anywhere from 0.1% to 0.3%. A 0.3% would match September’s pace and read as inflation that is not cooling.
The yearly comparison will also be messy. The government shutdown in October 2025 meant no CPI was published for that month, so there is no clean year-over-year figure.
Market Intelligence: Crypto Analyst Predicts Best Low-Cap Crypto
Today’s Report Is the Last CPI Before a Likely Fed Hike
This is the last CPI report the Federal Reserve will see before its December 8-9 meeting. Traders already expect a rate hike: on Tuesday morning, Polymarket gives an 86.5% chance of a 0.25-point increase and 11.5% for no change.
Higher rates tend to weigh on Bitcoin. They make cash and bonds pay more, which pulls money away from assets that pay no interest, like crypto.
A cool reading could shave those odds and give Bitcoin room to bounce. A hot one would lock in the hike.
DISCOVER: Fed Meeting Today: Traders Price a 95% Hold and a 79% December Hike. What Does It Mean for Crypto?
The Bitcoin CPI Reaction: Cool Prints Usually Lift BTC Within the Hour
We measured the Bitcoin CPI reaction on Binance. We took the 24 CPI reports published since October 2024 and measured Bitcoin’s move in the hour after each 8:30 a.m. release.
Bigger swings: the median gap between BTC’s high and low in that hour was 1.17%, almost double the 0.62% in the same hour on other weekdays.
Core at 0.2% or lower, 13 reports: BTC rose in the first hour 10 times, by 0.45% on average.
Core at 0.3% or higher, 10 reports: BTC rose only 4 times and slipped 0.11% on average.
The pattern is a lean, not a rule. The biggest drop came on February 12, 2025, when core rose 0.4% and BTC lost 1.9% in an hour. Last month’s 0.3% reading cost it 1.4%.
Bitcoin Price Analysis: Can BTC Hold $73,510?
So far it has. BTC trades at $74,398 on Binance, about 1.2% above Sunday’s low.
On the daily chart, Bitcoin sits below both of its exponential moving averages (EMAs), averages that weight recent prices more. The 200-day EMA is at $76,481 and the 50-day EMA at $79,128.
Resistance: $75,599, Monday’s high, then $76,481, the 200-day EMA. Above that, $79,128, the 50-day EMA.
Support: $74,177, Tuesday’s low, then $73,510, Sunday’s low. Below that, $73,027, the August 21 low.
BTCUSDT 1D chart. Source: TradingView.
CPI outcome What it could mean Level to watch Core at 0.1% Hike odds ease, room for a bounce $75,599, then $76,481 Core at 0.2% In line, the market likely stays cautious A range between $73,510 and $75,599 Core at 0.3% or higher December hike locked in $73,510, then $73,027
For anyone tracking the Bitcoin CPI reaction, the first hour after 8:30 a.m. is the one to watch. In 20 of the last 24 reports, Bitcoin ended the next 24 hours moving in the same direction as in that first hour.
Market Intelligence: Crypto Analyst Predicts Best New Crypto to Hodl
next
The post Bitcoin CPI Reaction: 10 of 13 Cool Inflation Reports Triggered an Hourly Gain – Can Inflation Data Reverse the Downtrend? appeared first on Coinspeaker.
Economists expect core prices, which leave out food and energy, to have risen about 0.22% in the month. That would be a slowdown from September’s 0.33%.
Economists expect growth in the core CPI to have moderated in October to around 0.22%, though the full range of estimates is broad enough to round down to 0.1% or round up to 0.3%.
Due to the government shutdown in Oct 2025, there's no tidy year-earlier figure. pic.twitter.com/CFM7ikw8fO
— Nick Timiraos (@NickTimiraos) November 9, 2026
Bitcoin trades near $74,400, still close to Sunday’s two-month low of $73,510.
CPI days move crypto. We checked Bitcoin’s first hour after the last 24 releases. When core inflation came in at 0.2% or lower, BTC rose in that hour 10 times out of 13. When it came in at 0.3% or higher, it rose only 4 times out of 10.
So which way will today’s number push Bitcoin?
Economists Expect Inflation to Cool, but the Range Is Wide
The forecasts point to a calmer month. Seventeen banks and research firms surveyed by The Wall Street Journal see a median rise of 0.25% for headline CPI and 0.22% for core. Journal reporter Nick Timiraos posted the table on X.
Headline CPI: forecasts run from 0.14% at Nomura to 0.29% at Pinebrook Capital, against 0.65% in September.
Core CPI: forecasts run from 0.13% at Nomura to 0.28% at BNP Paribas and Pinebrook, against 0.33% in September.
Yearly rate: the BLS put September’s inflation at 3.7% for headline prices and 2.6% for core.
That spread matters. The government reports CPI rounded to one decimal place. With forecasts this spread out, the core reading could print anywhere from 0.1% to 0.3%. A 0.3% would match September’s pace and read as inflation that is not cooling.
The yearly comparison will also be messy. The government shutdown in October 2025 meant no CPI was published for that month, so there is no clean year-over-year figure.
Market Intelligence: Crypto Analyst Predicts Best Low-Cap Crypto
Today’s Report Is the Last CPI Before a Likely Fed Hike
This is the last CPI report the Federal Reserve will see before its December 8-9 meeting. Traders already expect a rate hike: on Tuesday morning, Polymarket gives an 86.5% chance of a 0.25-point increase and 11.5% for no change.
Higher rates tend to weigh on Bitcoin. They make cash and bonds pay more, which pulls money away from assets that pay no interest, like crypto.
A cool reading could shave those odds and give Bitcoin room to bounce. A hot one would lock in the hike.
DISCOVER: Fed Meeting Today: Traders Price a 95% Hold and a 79% December Hike. What Does It Mean for Crypto?
The Bitcoin CPI Reaction: Cool Prints Usually Lift BTC Within the Hour
We measured the Bitcoin CPI reaction on Binance. We took the 24 CPI reports published since October 2024 and measured Bitcoin’s move in the hour after each 8:30 a.m. release.
Bigger swings: the median gap between BTC’s high and low in that hour was 1.17%, almost double the 0.62% in the same hour on other weekdays.
Core at 0.2% or lower, 13 reports: BTC rose in the first hour 10 times, by 0.45% on average.
Core at 0.3% or higher, 10 reports: BTC rose only 4 times and slipped 0.11% on average.
The pattern is a lean, not a rule. The biggest drop came on February 12, 2025, when core rose 0.4% and BTC lost 1.9% in an hour. Last month’s 0.3% reading cost it 1.4%.
Bitcoin Price Analysis: Can BTC Hold $73,510?
So far it has. BTC trades at $74,398 on Binance, about 1.2% above Sunday’s low.
On the daily chart, Bitcoin sits below both of its exponential moving averages (EMAs), averages that weight recent prices more. The 200-day EMA is at $76,481 and the 50-day EMA at $79,128.
Resistance: $75,599, Monday’s high, then $76,481, the 200-day EMA. Above that, $79,128, the 50-day EMA.
Support: $74,177, Tuesday’s low, then $73,510, Sunday’s low. Below that, $73,027, the August 21 low.
BTCUSDT 1D chart. Source: TradingView.
CPI outcome What it could mean Level to watch Core at 0.1% Hike odds ease, room for a bounce $75,599, then $76,481 Core at 0.2% In line, the market likely stays cautious A range between $73,510 and $75,599 Core at 0.3% or higher December hike locked in $73,510, then $73,027
For anyone tracking the Bitcoin CPI reaction, the first hour after 8:30 a.m. is the one to watch. In 20 of the last 24 reports, Bitcoin ended the next 24 hours moving in the same direction as in that first hour.
Market Intelligence: Crypto Analyst Predicts Best New Crypto to Hodl
next
The post Bitcoin CPI Reaction: 10 of 13 Cool Inflation Reports Triggered an Hourly Gain – Can Inflation Data Reverse the Downtrend? appeared first on Coinspeaker.
234
·
--
Verified
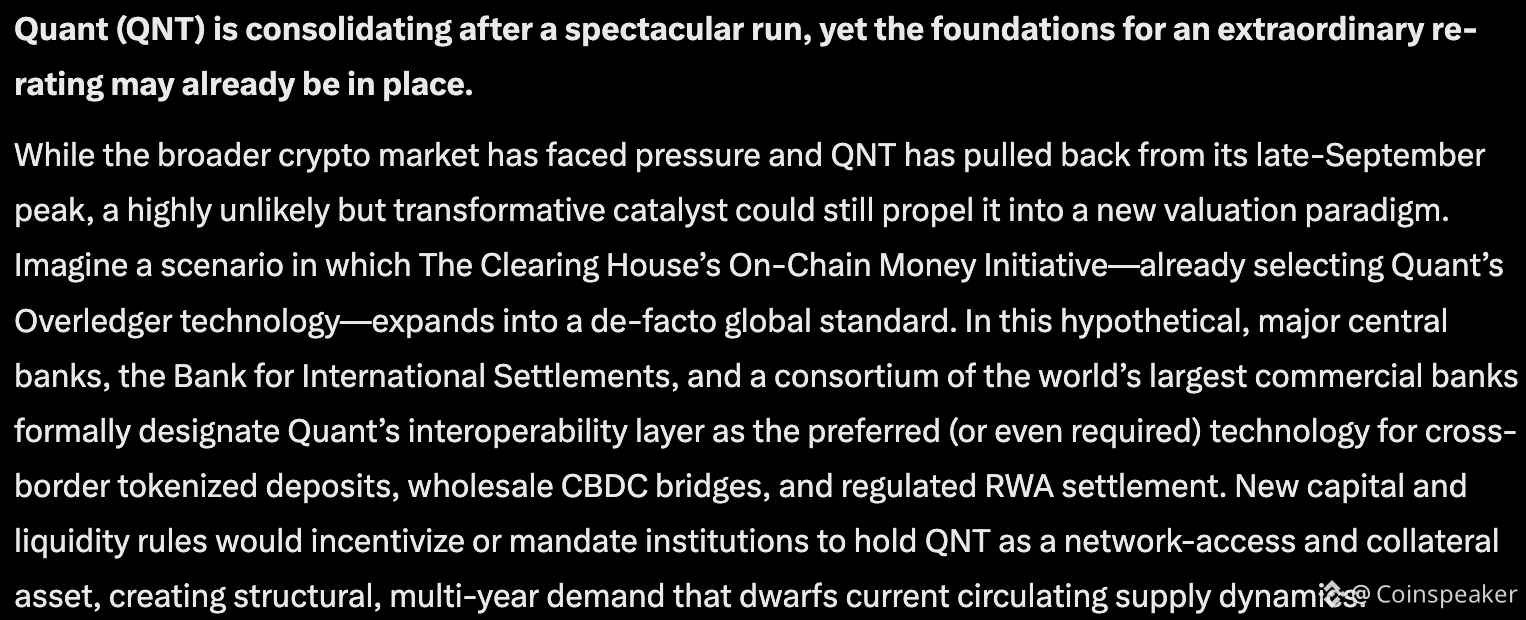
Article
Elon Musk Grok AI Predicts a QNT Crypto Explosion: How High Could It Go?Quant (QNT) is consolidating after a spectacular run, yet the foundations for an extraordinary re-rating may already be in place. Elon Musk’s Grok AI predicts that while the broader crypto market has faced pressure and QNT has pulled back from its late-September peak, a highly unlikely but transformative catalyst could still propel it into a new valuation paradigm.
Imagine a scenario in which The Clearing House’s On-Chain Money Initiative, having already selected Quant’s Overledger technology, expands to become a de facto global standard.
(SOURCE: Grok AI Predicts QNT Crypto to Explode)
In this hypothetical situation, major central banks, the Bank for International Settlements, and a consortium of the world’s largest commercial banks formally designate Quant’s interoperability layer as the preferred, or even required, technology for cross-border tokenized deposits, wholesale central bank digital currency (CBDC) bridges, and regulated real-world asset (RWA) settlements.
New capital and liquidity rules could incentivize or mandate institutions to hold QNT as a necessary asset for network access and collateral, creating structural, multi-year demand that far exceeds current circulating supply dynamics.
QNT Crypto Technical Analysis: Can Quant Hold Above $200 Amid Market-Wide Dip
(SOURCE: TradingView)
QNT currently trades in the $195–$205 zone after a powerful rally that took it from the $60–$70 area to highs above $300–$350 in weeks.
The subsequent pullback has found support in the $185–$195 region on multiple tests, with higher lows beginning to form relative to the deeper summer base.
Volume expanded dramatically during the initial breakout and remains elevated on up days, suggesting accumulation rather than pure distribution.
A sustained reclaim and hold above the $220–$240 resistance cluster would confirm the next leg higher and open the path toward a retest of the prior peak.
In an extreme institutional-adoption scenario, measured-move extensions and multi-cycle Fibonacci projections from the multi-year base could theoretically support far higher targets once the market fully prices in structural demand for the token.
Even as price has cooled from its parabolic spike, the underlying institutional progress offers a constructive counter-narrative. Real bank infrastructure deals of this scale are rare in crypto.
If the broader market stabilizes and the 2027 launch timeline for The Clearing House initiative approaches with positive updates, Quant is well-placed to reassert itself as one of the purest plays on regulated, interoperable tokenized finance.
DISCOVER: Meme Coin Supercycle? Best Picks for Q4
What Other Bullish Catalysts Could Spark a Parabolic Run for Quant?
🚨BULLISH: Quant and global financial software giant Murex are tackling one of the BIGGEST barriers to institutional tokenisation!
Their new whitepaper reveals how $QNT technology can synchronize money and assets across different financial systems, reducing settlement risk and… pic.twitter.com/KMXkWJm4wk
— ALLINCRYPTO (@RealAllinCrypto) November 4, 2026
Despite recent price digestion, Quant has secured some of the most concrete institutional traction in the entire crypto sector. In late September 2026, The Clearing House, the bank-owned operator of the RTP and CHIPS networks that clear and settle more than $2 trillion daily, selected Quant to provide the interoperability, orchestration, and transaction-management layer for its On-Chain Money Initiative.
The network is targeted to be available to financial institutions in the first half of 2027. At the same time, Quant’s technology underpinned live customer transactions in the UK’s Great British Tokenized Deposit pilot involving major banks.
These are not vague partnerships; they are production-oriented selections by systemically important institutions. Additional visibility at industry events such as Sibos and continued progress on Overledger and Fusion rollup technology keep Quant positioned at the center of the tokenized-money narrative, exactly the kind of real-world infrastructure story that can reignite once broader market sentiment improves.
Elon Musk Grok AI Predicts a QNT Crypto Explosion: How High Could it Go?
By January 1, 2027, in this over-the-top bullish scenario, Quant could reach $1,800 – $2,800, with a stretch target above $3,500 if the technology becomes embedded as critical financial-market infrastructure.
However, this is purely speculation and should be viewed as entertainment rather than a realistic forecast. Achieving this target would require extraordinary coordination among various governments and development partners, which is highly unlikely at this time.
DISCOVER: Best Meme Coins to Buy in 2026
next
The post Elon Musk Grok AI Predicts a QNT Crypto Explosion: How High Could it Go? appeared first on Coinspeaker.
Elon Musk Grok AI Predicts a QNT Crypto Explosion: How High Could It Go?
Quant (QNT) is consolidating after a spectacular run, yet the foundations for an extraordinary re-rating may already be in place. Elon Musk’s Grok AI predicts that while the broader crypto market has faced pressure and QNT has pulled back from its late-September peak, a highly unlikely but transformative catalyst could still propel it into a new valuation paradigm.
Imagine a scenario in which The Clearing House’s On-Chain Money Initiative, having already selected Quant’s Overledger technology, expands to become a de facto global standard.
(SOURCE: Grok AI Predicts QNT Crypto to Explode)
In this hypothetical situation, major central banks, the Bank for International Settlements, and a consortium of the world’s largest commercial banks formally designate Quant’s interoperability layer as the preferred, or even required, technology for cross-border tokenized deposits, wholesale central bank digital currency (CBDC) bridges, and regulated real-world asset (RWA) settlements.
New capital and liquidity rules could incentivize or mandate institutions to hold QNT as a necessary asset for network access and collateral, creating structural, multi-year demand that far exceeds current circulating supply dynamics.
QNT Crypto Technical Analysis: Can Quant Hold Above $200 Amid Market-Wide Dip
(SOURCE: TradingView)
QNT currently trades in the $195–$205 zone after a powerful rally that took it from the $60–$70 area to highs above $300–$350 in weeks.
The subsequent pullback has found support in the $185–$195 region on multiple tests, with higher lows beginning to form relative to the deeper summer base.
Volume expanded dramatically during the initial breakout and remains elevated on up days, suggesting accumulation rather than pure distribution.
A sustained reclaim and hold above the $220–$240 resistance cluster would confirm the next leg higher and open the path toward a retest of the prior peak.
In an extreme institutional-adoption scenario, measured-move extensions and multi-cycle Fibonacci projections from the multi-year base could theoretically support far higher targets once the market fully prices in structural demand for the token.
Even as price has cooled from its parabolic spike, the underlying institutional progress offers a constructive counter-narrative. Real bank infrastructure deals of this scale are rare in crypto.
If the broader market stabilizes and the 2027 launch timeline for The Clearing House initiative approaches with positive updates, Quant is well-placed to reassert itself as one of the purest plays on regulated, interoperable tokenized finance.
DISCOVER: Meme Coin Supercycle? Best Picks for Q4
What Other Bullish Catalysts Could Spark a Parabolic Run for Quant?
🚨BULLISH: Quant and global financial software giant Murex are tackling one of the BIGGEST barriers to institutional tokenisation!
Their new whitepaper reveals how $QNT technology can synchronize money and assets across different financial systems, reducing settlement risk and… pic.twitter.com/KMXkWJm4wk
— ALLINCRYPTO (@RealAllinCrypto) November 4, 2026
Despite recent price digestion, Quant has secured some of the most concrete institutional traction in the entire crypto sector. In late September 2026, The Clearing House, the bank-owned operator of the RTP and CHIPS networks that clear and settle more than $2 trillion daily, selected Quant to provide the interoperability, orchestration, and transaction-management layer for its On-Chain Money Initiative.
The network is targeted to be available to financial institutions in the first half of 2027. At the same time, Quant’s technology underpinned live customer transactions in the UK’s Great British Tokenized Deposit pilot involving major banks.
These are not vague partnerships; they are production-oriented selections by systemically important institutions. Additional visibility at industry events such as Sibos and continued progress on Overledger and Fusion rollup technology keep Quant positioned at the center of the tokenized-money narrative, exactly the kind of real-world infrastructure story that can reignite once broader market sentiment improves.
Elon Musk Grok AI Predicts a QNT Crypto Explosion: How High Could it Go?
By January 1, 2027, in this over-the-top bullish scenario, Quant could reach $1,800 – $2,800, with a stretch target above $3,500 if the technology becomes embedded as critical financial-market infrastructure.
However, this is purely speculation and should be viewed as entertainment rather than a realistic forecast. Achieving this target would require extraordinary coordination among various governments and development partners, which is highly unlikely at this time.
DISCOVER: Best Meme Coins to Buy in 2026
next
The post Elon Musk Grok AI Predicts a QNT Crypto Explosion: How High Could it Go? appeared first on Coinspeaker.
Imagine a scenario in which The Clearing House’s On-Chain Money Initiative, having already selected Quant’s Overledger technology, expands to become a de facto global standard.
(SOURCE: Grok AI Predicts QNT Crypto to Explode)
In this hypothetical situation, major central banks, the Bank for International Settlements, and a consortium of the world’s largest commercial banks formally designate Quant’s interoperability layer as the preferred, or even required, technology for cross-border tokenized deposits, wholesale central bank digital currency (CBDC) bridges, and regulated real-world asset (RWA) settlements.
New capital and liquidity rules could incentivize or mandate institutions to hold QNT as a necessary asset for network access and collateral, creating structural, multi-year demand that far exceeds current circulating supply dynamics.
QNT Crypto Technical Analysis: Can Quant Hold Above $200 Amid Market-Wide Dip
(SOURCE: TradingView)
QNT currently trades in the $195–$205 zone after a powerful rally that took it from the $60–$70 area to highs above $300–$350 in weeks.
The subsequent pullback has found support in the $185–$195 region on multiple tests, with higher lows beginning to form relative to the deeper summer base.
Volume expanded dramatically during the initial breakout and remains elevated on up days, suggesting accumulation rather than pure distribution.
A sustained reclaim and hold above the $220–$240 resistance cluster would confirm the next leg higher and open the path toward a retest of the prior peak.
In an extreme institutional-adoption scenario, measured-move extensions and multi-cycle Fibonacci projections from the multi-year base could theoretically support far higher targets once the market fully prices in structural demand for the token.
Even as price has cooled from its parabolic spike, the underlying institutional progress offers a constructive counter-narrative. Real bank infrastructure deals of this scale are rare in crypto.
If the broader market stabilizes and the 2027 launch timeline for The Clearing House initiative approaches with positive updates, Quant is well-placed to reassert itself as one of the purest plays on regulated, interoperable tokenized finance.
DISCOVER: Meme Coin Supercycle? Best Picks for Q4
What Other Bullish Catalysts Could Spark a Parabolic Run for Quant?
🚨BULLISH: Quant and global financial software giant Murex are tackling one of the BIGGEST barriers to institutional tokenisation!
Their new whitepaper reveals how $QNT technology can synchronize money and assets across different financial systems, reducing settlement risk and… pic.twitter.com/KMXkWJm4wk
— ALLINCRYPTO (@RealAllinCrypto) November 4, 2026
Despite recent price digestion, Quant has secured some of the most concrete institutional traction in the entire crypto sector. In late September 2026, The Clearing House, the bank-owned operator of the RTP and CHIPS networks that clear and settle more than $2 trillion daily, selected Quant to provide the interoperability, orchestration, and transaction-management layer for its On-Chain Money Initiative.
The network is targeted to be available to financial institutions in the first half of 2027. At the same time, Quant’s technology underpinned live customer transactions in the UK’s Great British Tokenized Deposit pilot involving major banks.
These are not vague partnerships; they are production-oriented selections by systemically important institutions. Additional visibility at industry events such as Sibos and continued progress on Overledger and Fusion rollup technology keep Quant positioned at the center of the tokenized-money narrative, exactly the kind of real-world infrastructure story that can reignite once broader market sentiment improves.
Elon Musk Grok AI Predicts a QNT Crypto Explosion: How High Could it Go?
By January 1, 2027, in this over-the-top bullish scenario, Quant could reach $1,800 – $2,800, with a stretch target above $3,500 if the technology becomes embedded as critical financial-market infrastructure.
However, this is purely speculation and should be viewed as entertainment rather than a realistic forecast. Achieving this target would require extraordinary coordination among various governments and development partners, which is highly unlikely at this time.
DISCOVER: Best Meme Coins to Buy in 2026
next
The post Elon Musk Grok AI Predicts a QNT Crypto Explosion: How High Could it Go? appeared first on Coinspeaker.
1.4k
·
--
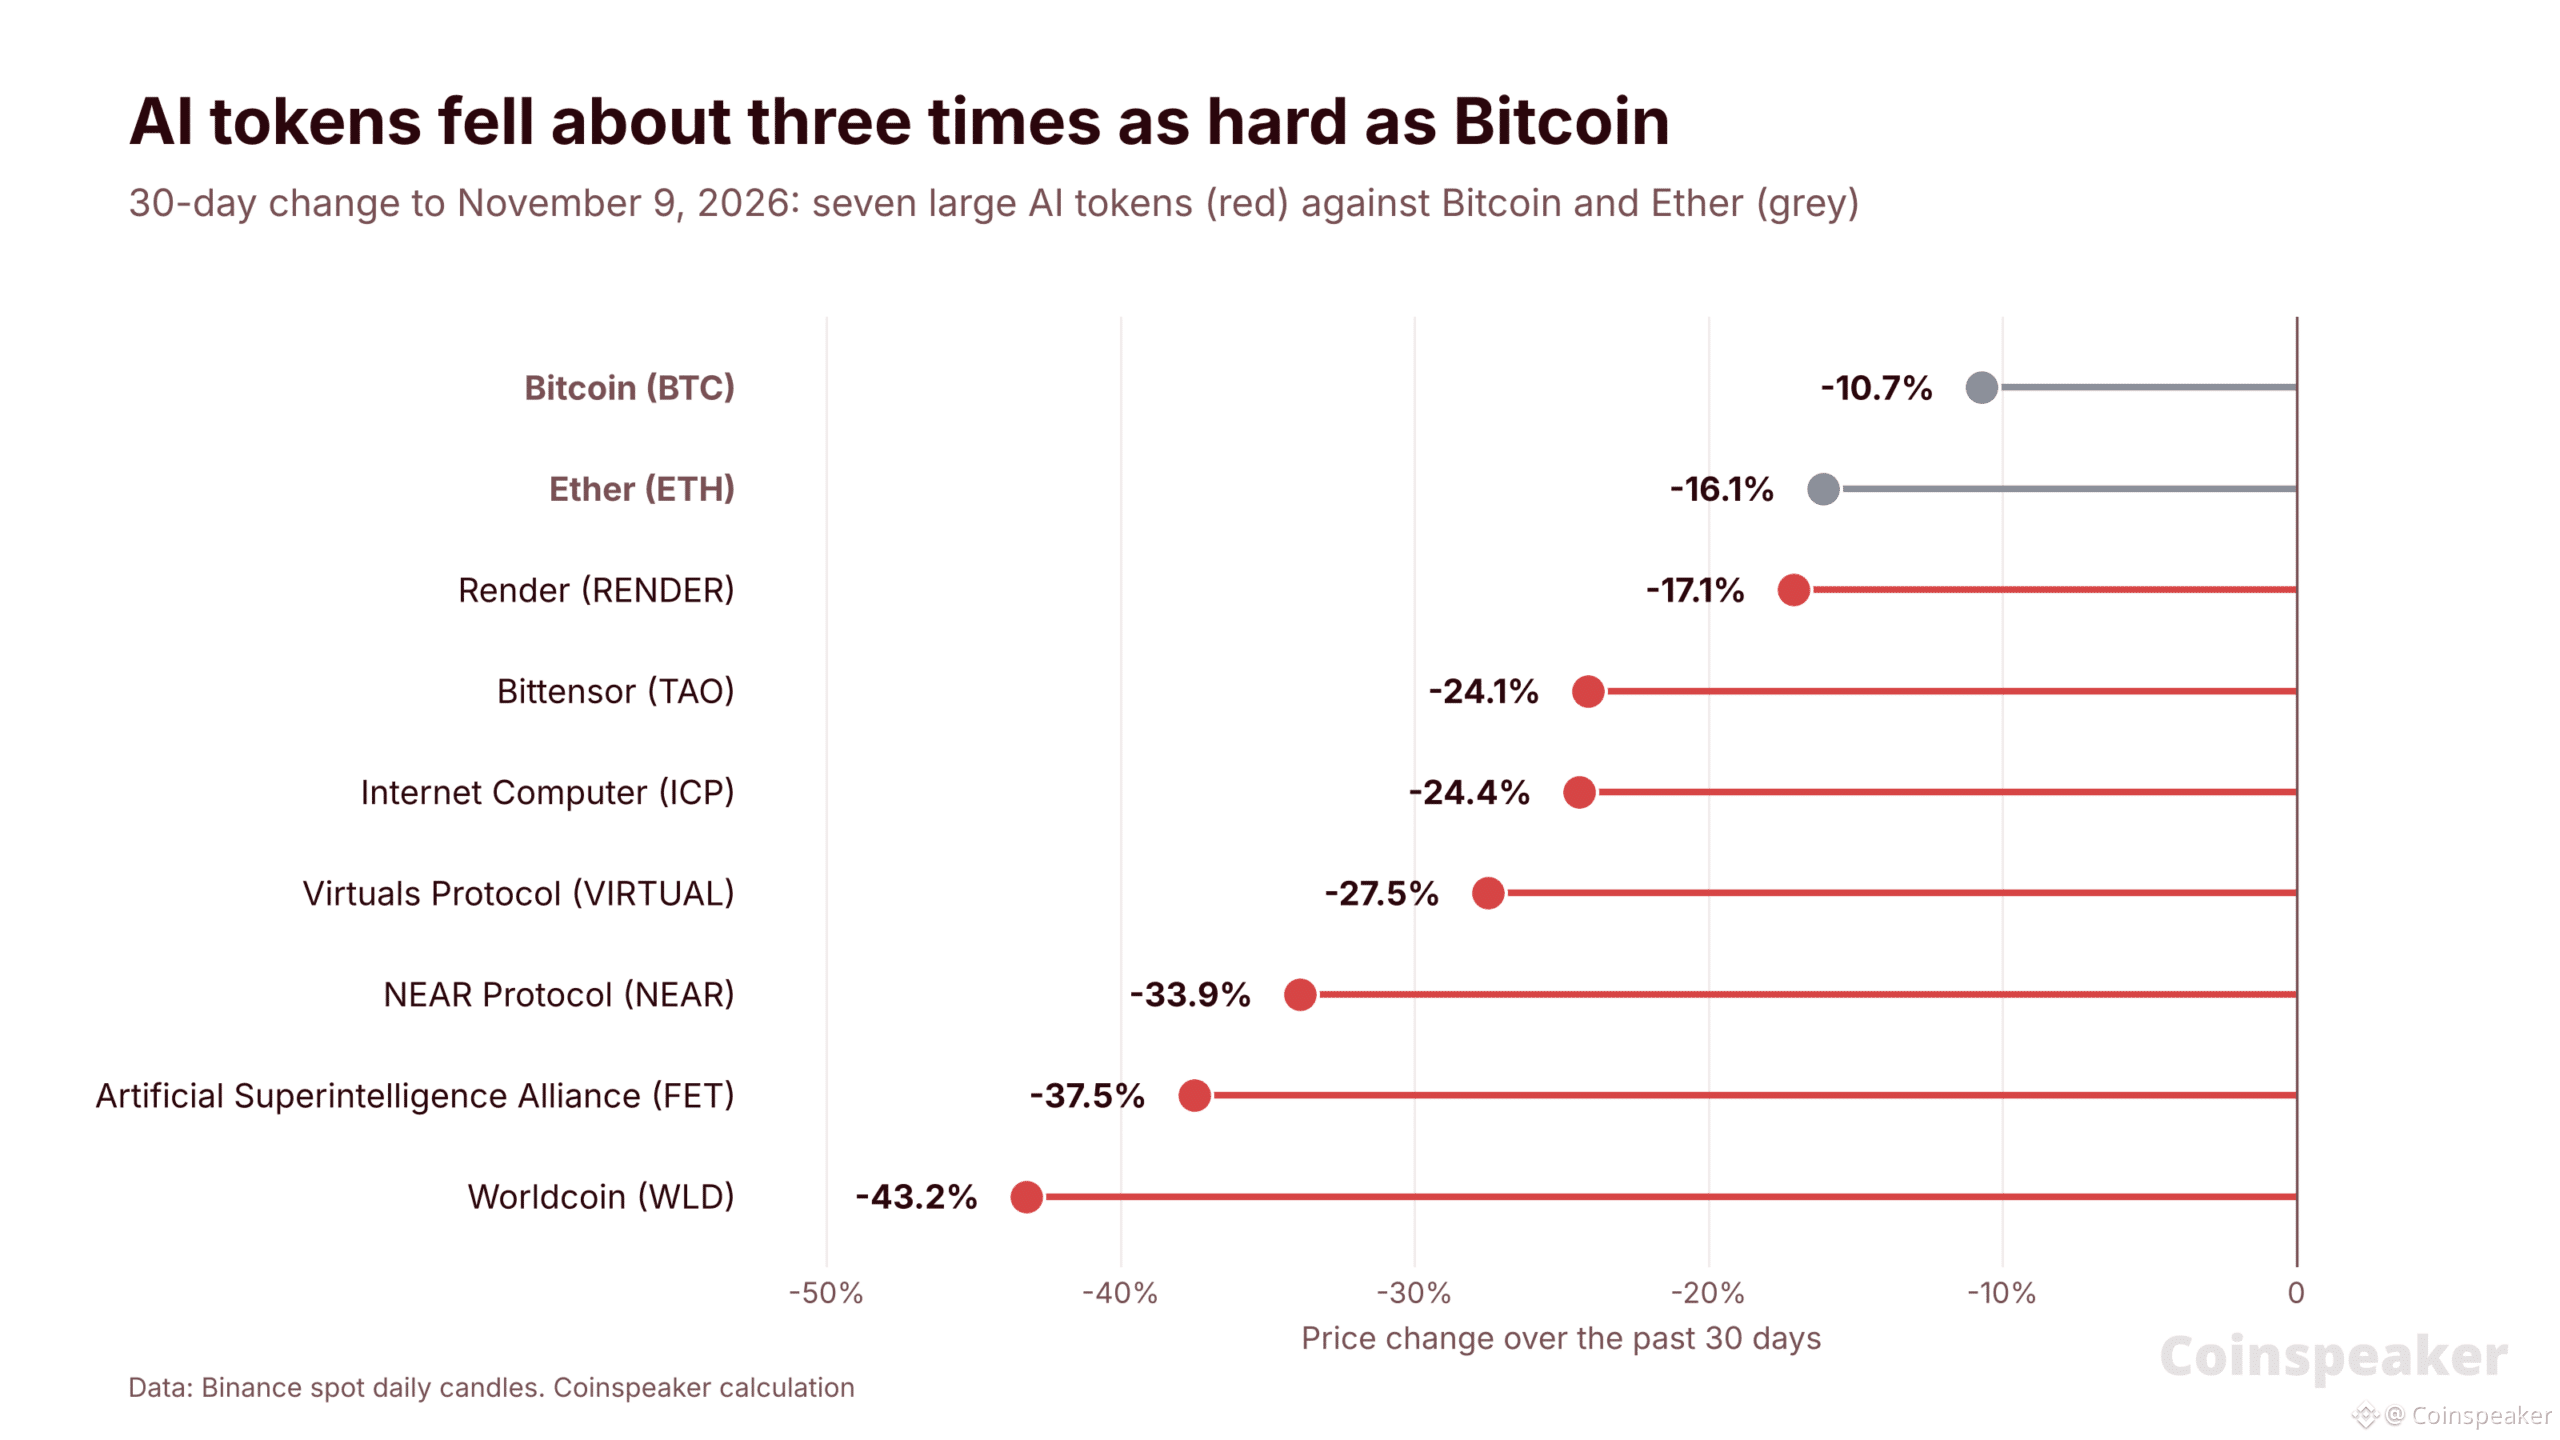
Article
Vitalik Buterin Backs an AI Slowdown As AI Tokens Slide 30%: Is the AI Crypto Bubble Popping?Vitalik Buterin said on Sunday that slowing the AI data center race is probably a good thing, as the crypto bubble around AI tokens loses air. The Ethereum co-founder made the case in a post on X.
He pushed back on what he called the “strong emotional reaction” against the anti-data-center movement.
I know this is a predictable opinion from me but I don't agree with the strong emotional reaction against the anti-data-center movements that I've seen this week.
As I see it, algorithmic progress means that whatever you would be able to do with more and bigger data centers in 2…
— vitalik.eth (@VitalikButerin) November 8, 2026
That movement had a big week. On November 3, voters in 10 states decided 41 local ballot measures on data centers, Ballotpedia counted. A “yes” vote on 28 of them would limit building through bans or moratoriums. After the vote, Senator Bernie Sanders called for a “national data center moratorium now,” one of several Democrats pushing to rein in the AI buildout.
Crypto’s AI corner has felt the same chill. Seven of the largest AI tokens fell 29.7% on average over the past 30 days, almost three times Bitcoin’s 10.7% drop.
So is the slowdown Buterin wants already showing up as a popping bubble in AI tokens?
Discover: Bitcoin Slides to $73,510 Over the Weekend: Did Nvidia Scandal Trigger BTC’s $2,000 Flash Crash?
Vitalik Argues a Slower AI Race Costs Little and Buys Time
His case rests on three points, and he made it, in his words, “without any controversial ‘doomer arguments’.”
The delay is short. Thanks to better algorithms, today’s data centers will do in four years, “probably sooner,” what bigger ones could do in two.
The time is useful. “We need all the time we can get to better harden the world,” he wrote, against cybersecurity problems and biological risks.
Science barely slows. Research is held back by many things besides AI. Slowing AI by one year “will slow those down by much less than one year,” he wrote.
He concluded that “a slowdown in compute hyper-scaling seems quite net good.” Even if it proved a mistake, it would not be worse than “10+ other political things,” he added.
The view fits what Buterin has argued since 2023, when he set out “d/acc,” his name for speeding up defensive technology first, in an essay titled My techno-optimism.
Market Intelligence: Crypto Analyst Predicts Best Low-Cap Crypto
The Crypto Bubble in AI Tokens Is Already Deflating
AI tokens are the part of crypto that trades most directly on the AI boom. They include networks that sell computing power, run AI agents or pay people to train models. CoinGecko valued the sector at $18.9 billion on Monday morning.
We compared the 30-day moves of seven of the largest AI tokens on Binance with Bitcoin and Ether.
Hardest hit: Worldcoin (WLD) fell 43.2%, the Artificial Superintelligence Alliance token (FET) 37.5%, and NEAR 33.9%.
Best of the group: Render (RENDER) fell 17.1%, still more than Ether’s 16.1%.
From their highs: Internet Computer (ICP) trades 74.8% below its peak of the past year, Virtuals Protocol (VIRTUAL) 67.4% and FET 63.9%.
The selling lines up with doubts about AI spending in the stock market. Last Thursday’s sell-off in chip stocks pushed Bitcoin below its 200-day average, and AI tokens, which rose fastest on the AI story, have fallen fastest as it cools.
A wave of local data center bans adds a new worry for tokens that sell computing power. Buterin’s own argument cuts the other way, though: if better algorithms keep AI improving on today’s machines, a slower buildout does not end demand for AI.
Market Intelligence: Crypto Analyst Predicts Best New Crypto to Hodl
Ethereum Price Analysis: Can ETH Hold $2,060?
It held on Sunday, but with little room to spare. Ether trades at $2,104 on Binance, down 16.1% in 30 days, after touching $2,060 late Sunday, its lowest price since August 19.
ETH sits below both of its daily exponential moving averages (EMAs), averages that weight recent prices more. They stand at $2,311 for 200 days and $2,370 for 50 days.
Resistance: $2,246, Sunday’s high, then $2,311, the 200-day EMA. Above that, $2,450, Wednesday’s high.
Support: $2,060, Sunday’s low. Below that, $1,854, the August 11 low.
ETHUSDT 1D chart. Source: TradingView.
Outlook Trigger Level to watch Rebound A daily close above $2,311 $2,450, Wednesday’s high Holding pattern ETH stays between $2,060 and $2,311 A range below both EMAs Sell-off A daily close below $2,060 $1,854, the August 11 low
For traders asking whether the crypto bubble is bursting, AI tokens are the place to watch. They rose fastest on the AI story, and they are now falling fastest.
next
The post Vitalik Buterin Backs an AI Slowdown as AI Tokens Slide 30%: Is the AI Crypto Bubble Popping? appeared first on Coinspeaker.
Vitalik Buterin Backs an AI Slowdown As AI Tokens Slide 30%: Is the AI Crypto Bubble Popping?
Vitalik Buterin said on Sunday that slowing the AI data center race is probably a good thing, as the crypto bubble around AI tokens loses air. The Ethereum co-founder made the case in a post on X.
He pushed back on what he called the “strong emotional reaction” against the anti-data-center movement.
I know this is a predictable opinion from me but I don't agree with the strong emotional reaction against the anti-data-center movements that I've seen this week.
As I see it, algorithmic progress means that whatever you would be able to do with more and bigger data centers in 2…
— vitalik.eth (@VitalikButerin) November 8, 2026
That movement had a big week. On November 3, voters in 10 states decided 41 local ballot measures on data centers, Ballotpedia counted. A “yes” vote on 28 of them would limit building through bans or moratoriums. After the vote, Senator Bernie Sanders called for a “national data center moratorium now,” one of several Democrats pushing to rein in the AI buildout.
Crypto’s AI corner has felt the same chill. Seven of the largest AI tokens fell 29.7% on average over the past 30 days, almost three times Bitcoin’s 10.7% drop.
So is the slowdown Buterin wants already showing up as a popping bubble in AI tokens?
Discover: Bitcoin Slides to $73,510 Over the Weekend: Did Nvidia Scandal Trigger BTC’s $2,000 Flash Crash?
Vitalik Argues a Slower AI Race Costs Little and Buys Time
His case rests on three points, and he made it, in his words, “without any controversial ‘doomer arguments’.”
The delay is short. Thanks to better algorithms, today’s data centers will do in four years, “probably sooner,” what bigger ones could do in two.
The time is useful. “We need all the time we can get to better harden the world,” he wrote, against cybersecurity problems and biological risks.
Science barely slows. Research is held back by many things besides AI. Slowing AI by one year “will slow those down by much less than one year,” he wrote.
He concluded that “a slowdown in compute hyper-scaling seems quite net good.” Even if it proved a mistake, it would not be worse than “10+ other political things,” he added.
The view fits what Buterin has argued since 2023, when he set out “d/acc,” his name for speeding up defensive technology first, in an essay titled My techno-optimism.
Market Intelligence: Crypto Analyst Predicts Best Low-Cap Crypto
The Crypto Bubble in AI Tokens Is Already Deflating
AI tokens are the part of crypto that trades most directly on the AI boom. They include networks that sell computing power, run AI agents or pay people to train models. CoinGecko valued the sector at $18.9 billion on Monday morning.
We compared the 30-day moves of seven of the largest AI tokens on Binance with Bitcoin and Ether.
Hardest hit: Worldcoin (WLD) fell 43.2%, the Artificial Superintelligence Alliance token (FET) 37.5%, and NEAR 33.9%.
Best of the group: Render (RENDER) fell 17.1%, still more than Ether’s 16.1%.
From their highs: Internet Computer (ICP) trades 74.8% below its peak of the past year, Virtuals Protocol (VIRTUAL) 67.4% and FET 63.9%.
The selling lines up with doubts about AI spending in the stock market. Last Thursday’s sell-off in chip stocks pushed Bitcoin below its 200-day average, and AI tokens, which rose fastest on the AI story, have fallen fastest as it cools.
A wave of local data center bans adds a new worry for tokens that sell computing power. Buterin’s own argument cuts the other way, though: if better algorithms keep AI improving on today’s machines, a slower buildout does not end demand for AI.
Market Intelligence: Crypto Analyst Predicts Best New Crypto to Hodl
Ethereum Price Analysis: Can ETH Hold $2,060?
It held on Sunday, but with little room to spare. Ether trades at $2,104 on Binance, down 16.1% in 30 days, after touching $2,060 late Sunday, its lowest price since August 19.
ETH sits below both of its daily exponential moving averages (EMAs), averages that weight recent prices more. They stand at $2,311 for 200 days and $2,370 for 50 days.
Resistance: $2,246, Sunday’s high, then $2,311, the 200-day EMA. Above that, $2,450, Wednesday’s high.
Support: $2,060, Sunday’s low. Below that, $1,854, the August 11 low.
ETHUSDT 1D chart. Source: TradingView.
Outlook Trigger Level to watch Rebound A daily close above $2,311 $2,450, Wednesday’s high Holding pattern ETH stays between $2,060 and $2,311 A range below both EMAs Sell-off A daily close below $2,060 $1,854, the August 11 low
For traders asking whether the crypto bubble is bursting, AI tokens are the place to watch. They rose fastest on the AI story, and they are now falling fastest.
next
The post Vitalik Buterin Backs an AI Slowdown as AI Tokens Slide 30%: Is the AI Crypto Bubble Popping? appeared first on Coinspeaker.
He pushed back on what he called the “strong emotional reaction” against the anti-data-center movement.
I know this is a predictable opinion from me but I don't agree with the strong emotional reaction against the anti-data-center movements that I've seen this week.
As I see it, algorithmic progress means that whatever you would be able to do with more and bigger data centers in 2…
— vitalik.eth (@VitalikButerin) November 8, 2026
That movement had a big week. On November 3, voters in 10 states decided 41 local ballot measures on data centers, Ballotpedia counted. A “yes” vote on 28 of them would limit building through bans or moratoriums. After the vote, Senator Bernie Sanders called for a “national data center moratorium now,” one of several Democrats pushing to rein in the AI buildout.
Crypto’s AI corner has felt the same chill. Seven of the largest AI tokens fell 29.7% on average over the past 30 days, almost three times Bitcoin’s 10.7% drop.
So is the slowdown Buterin wants already showing up as a popping bubble in AI tokens?
Discover: Bitcoin Slides to $73,510 Over the Weekend: Did Nvidia Scandal Trigger BTC’s $2,000 Flash Crash?
Vitalik Argues a Slower AI Race Costs Little and Buys Time
His case rests on three points, and he made it, in his words, “without any controversial ‘doomer arguments’.”
The delay is short. Thanks to better algorithms, today’s data centers will do in four years, “probably sooner,” what bigger ones could do in two.
The time is useful. “We need all the time we can get to better harden the world,” he wrote, against cybersecurity problems and biological risks.
Science barely slows. Research is held back by many things besides AI. Slowing AI by one year “will slow those down by much less than one year,” he wrote.
He concluded that “a slowdown in compute hyper-scaling seems quite net good.” Even if it proved a mistake, it would not be worse than “10+ other political things,” he added.
The view fits what Buterin has argued since 2023, when he set out “d/acc,” his name for speeding up defensive technology first, in an essay titled My techno-optimism.
Market Intelligence: Crypto Analyst Predicts Best Low-Cap Crypto
The Crypto Bubble in AI Tokens Is Already Deflating
AI tokens are the part of crypto that trades most directly on the AI boom. They include networks that sell computing power, run AI agents or pay people to train models. CoinGecko valued the sector at $18.9 billion on Monday morning.
We compared the 30-day moves of seven of the largest AI tokens on Binance with Bitcoin and Ether.
Hardest hit: Worldcoin (WLD) fell 43.2%, the Artificial Superintelligence Alliance token (FET) 37.5%, and NEAR 33.9%.
Best of the group: Render (RENDER) fell 17.1%, still more than Ether’s 16.1%.
From their highs: Internet Computer (ICP) trades 74.8% below its peak of the past year, Virtuals Protocol (VIRTUAL) 67.4% and FET 63.9%.
The selling lines up with doubts about AI spending in the stock market. Last Thursday’s sell-off in chip stocks pushed Bitcoin below its 200-day average, and AI tokens, which rose fastest on the AI story, have fallen fastest as it cools.
A wave of local data center bans adds a new worry for tokens that sell computing power. Buterin’s own argument cuts the other way, though: if better algorithms keep AI improving on today’s machines, a slower buildout does not end demand for AI.
Market Intelligence: Crypto Analyst Predicts Best New Crypto to Hodl
Ethereum Price Analysis: Can ETH Hold $2,060?
It held on Sunday, but with little room to spare. Ether trades at $2,104 on Binance, down 16.1% in 30 days, after touching $2,060 late Sunday, its lowest price since August 19.
ETH sits below both of its daily exponential moving averages (EMAs), averages that weight recent prices more. They stand at $2,311 for 200 days and $2,370 for 50 days.
Resistance: $2,246, Sunday’s high, then $2,311, the 200-day EMA. Above that, $2,450, Wednesday’s high.
Support: $2,060, Sunday’s low. Below that, $1,854, the August 11 low.
ETHUSDT 1D chart. Source: TradingView.
Outlook Trigger Level to watch Rebound A daily close above $2,311 $2,450, Wednesday’s high Holding pattern ETH stays between $2,060 and $2,311 A range below both EMAs Sell-off A daily close below $2,060 $1,854, the August 11 low
For traders asking whether the crypto bubble is bursting, AI tokens are the place to watch. They rose fastest on the AI story, and they are now falling fastest.
next
The post Vitalik Buterin Backs an AI Slowdown as AI Tokens Slide 30%: Is the AI Crypto Bubble Popping? appeared first on Coinspeaker.
1
1.5k
·
--
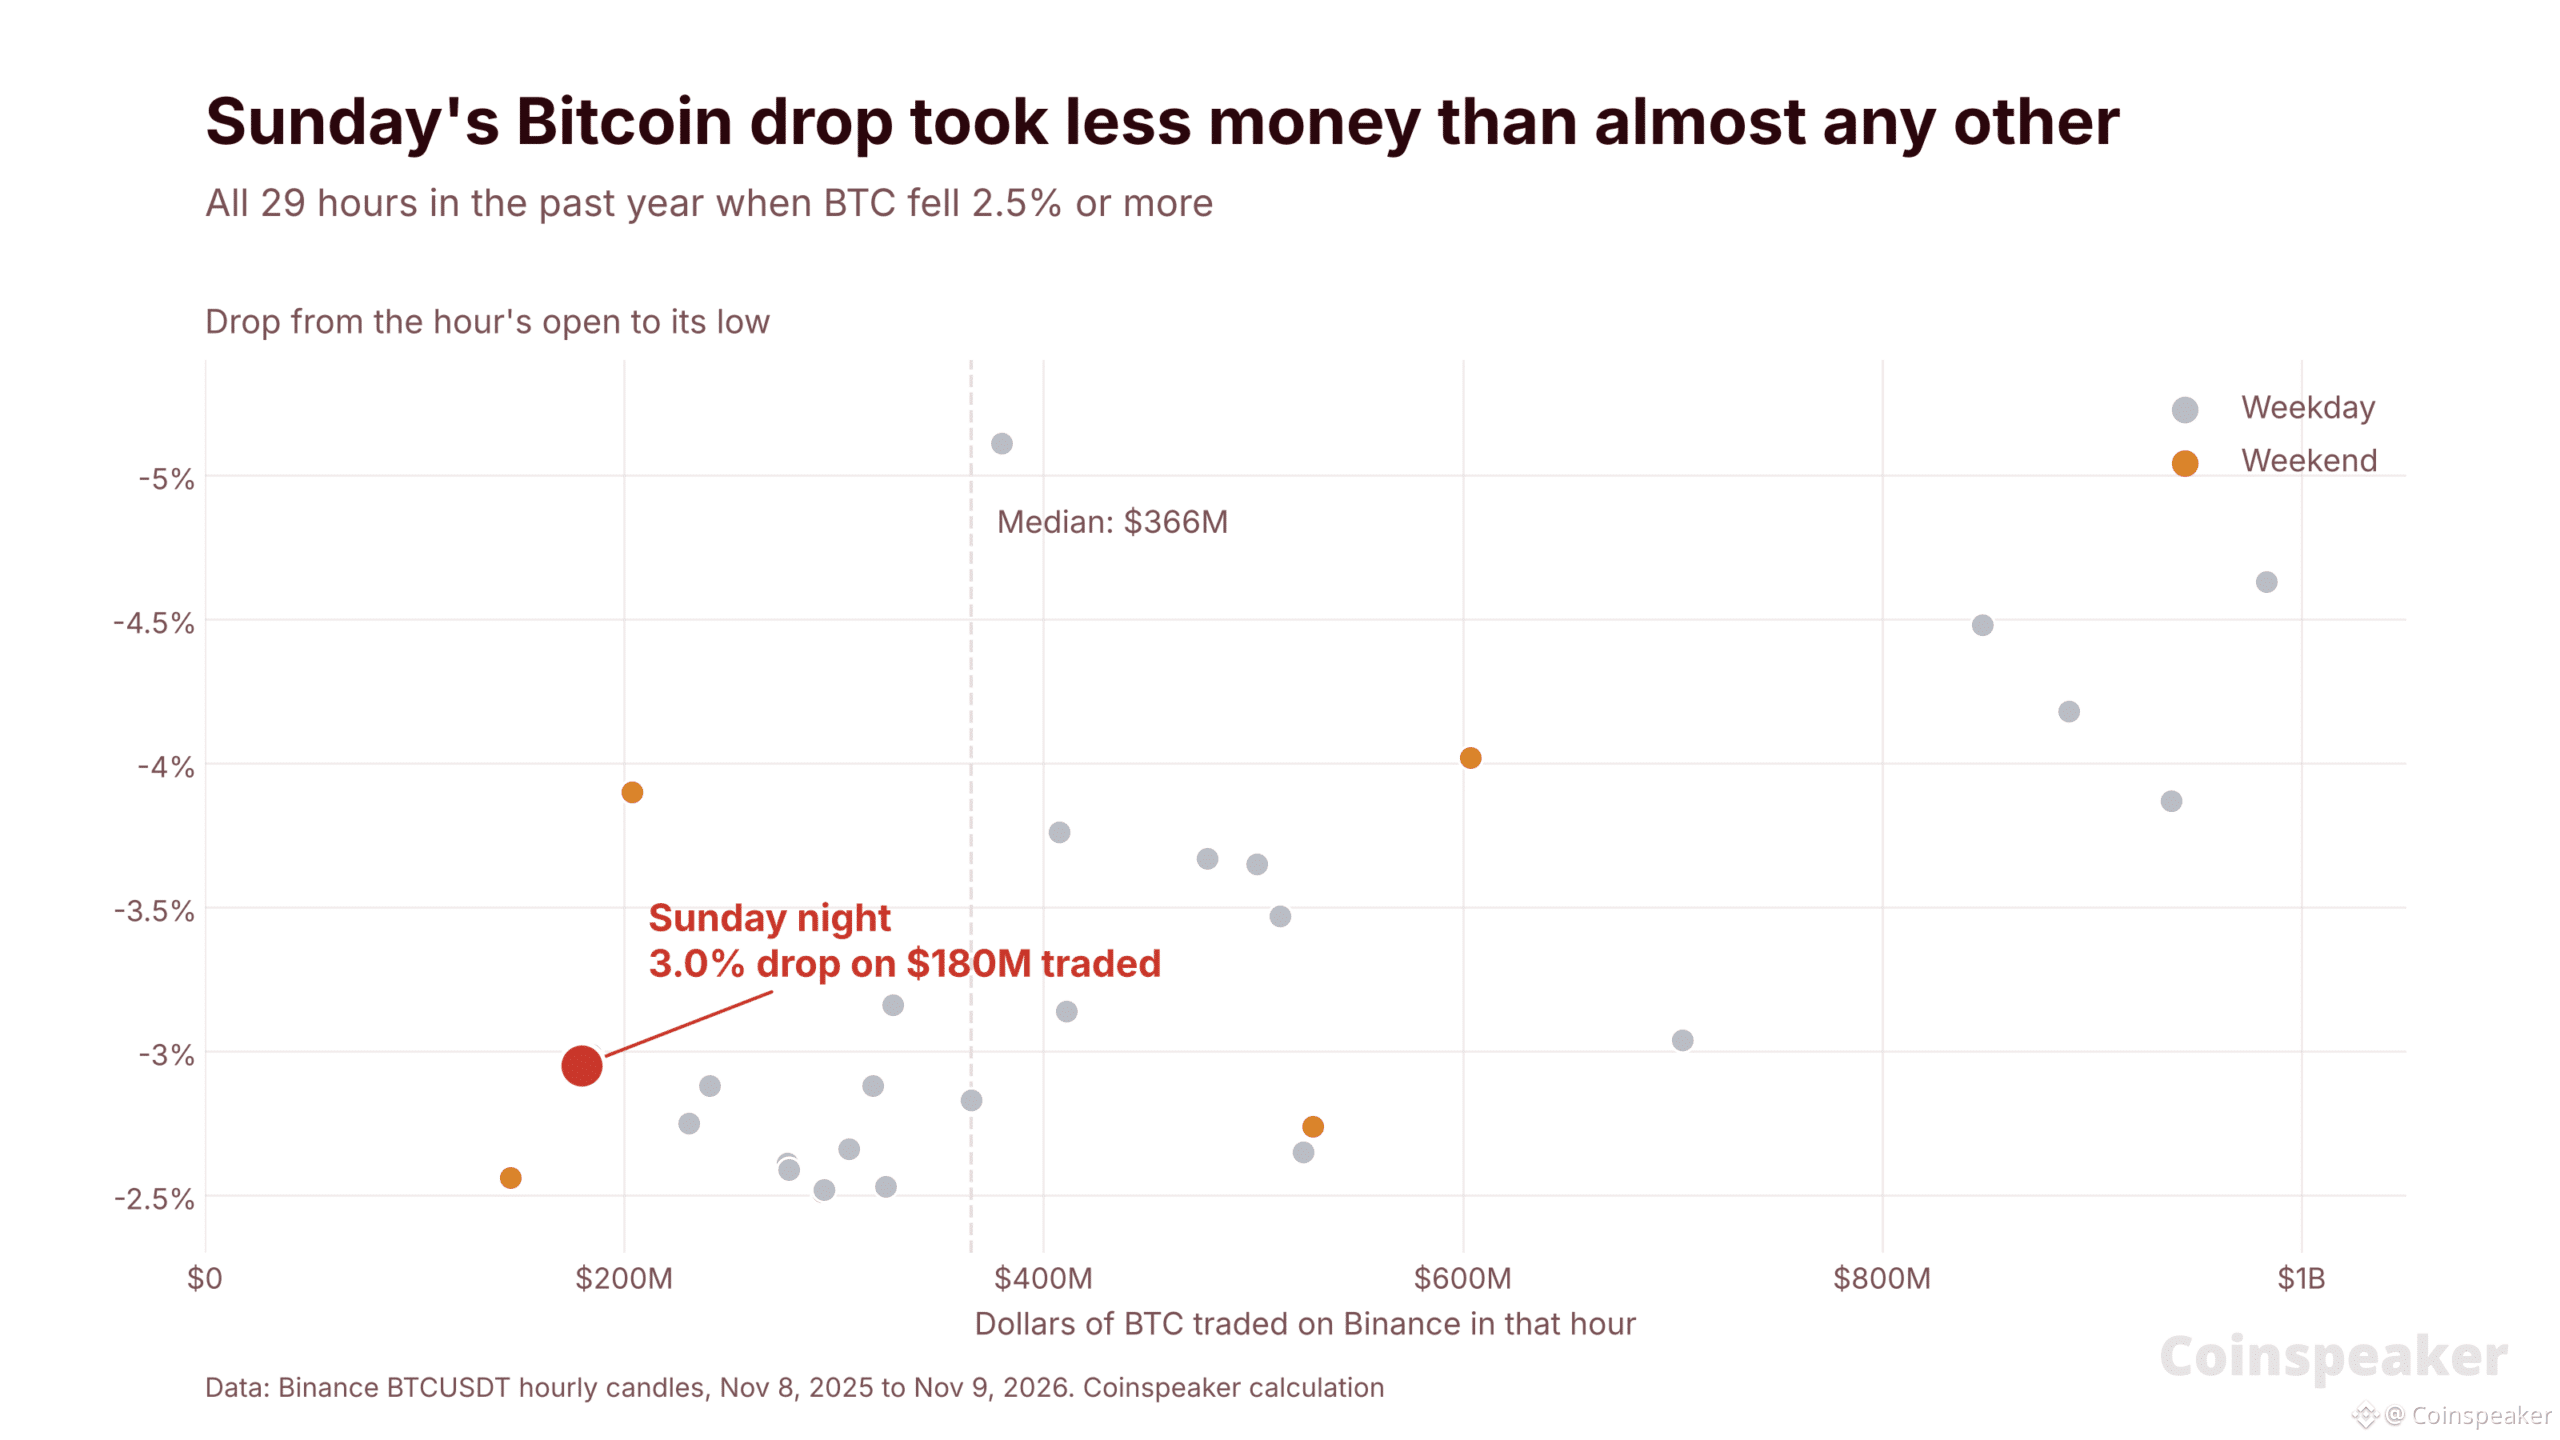
Article
Bitcoin Slides to $73,510 Over the Weekend: Did Nvidia Scandal Trigger BTC’s $2,000 Flash Crash?In Bitcoin news overnight, BTC USD price fell from $75,607 to $73,510 in ten minutes on Sunday evening, its lowest price since August 21. The worst of it came at 21:55 UTC, or 4:55 p.m. in New York. In that single minute, Bitcoin dropped 1.9% on Binance.
Most traders blamed Nvidia. Earlier that afternoon, CNBC reported that Nvidia’s board had opened an independent investigation into CEO Jensen Huang’s relationship with a woman U.S. intelligence agencies believe was passing information to Beijing (it’s just speculation for now).
Huang admitted the affair in an email to staff.
After Jensen Huang admitted having an affair, a whale opened a 10x short on 30,000 $NVDA ($5.44M) on Hyperliquid.https://t.co/RztJx5FNge pic.twitter.com/zuyV2K0ftN
— Lookonchain (@lookonchain) November 9, 2026
The bounce since then has been small. BTC traded at $74,184 on Binance on Monday morning, 2.2% below where it stood when the Nvidia story broke. The drop also marked a fifth straight losing week: the weekly candle closed at $74,851, below the week’s open of $78,354.
So did the Nvidia scandal really trigger the dump, or did thin weekend trading turn an ordinary sell-off into a sharp one?
Discover: Sam Altman ChatGPT AI Predicts an Insane Move for Cardano (ADA)
The Nvidia Story Broke 100 Minutes Before Bitcoin Fell
The timing does not fit a straight reaction to the news. CNBC published its report at 3:12 p.m. Eastern time on Sunday, which is 20:12 UTC. Bitcoin traded at $75,880 on Binance in that minute. For the next 90 minutes, almost nothing happened. At 21:44 UTC, BTC sat at $75,607, just 0.4% lower than when the story appeared.
Then the selling started, and it started in Ethereum. Between 21:50 and 21:55 UTC, ETH fell 6.9% on Binance, from $2,213 to $2,060. Bitcoin fell 2.4% over the same five minutes.
That pattern points to a liquidation cascade, a chain of forced sales. Traders who borrow to bet on higher prices get their positions force-closed when the price falls past a set point. Each forced sale pushes the price down to the next group of bets.
BREAKING: $1,000,000,000 liquidated from the crypto market in the past 10 minutes.$BTC falls under $74,000$ETH falls under $2,125$XRP falls under $1.10 $SOL falls under $90 pic.twitter.com/hIZhzQFJJe
— Watcher.Guru (@WatcherGuru) November 8, 2026
The news still mattered. Nvidia is the biggest AI stock, and Bitcoin has traded in step with AI shares for weeks: Thursday’s chip-stock sell-off is what pushed BTC below its 200-day average. With stock markets closed, crypto was the only market open to sell into the headline.
A second headline added to the Bitcoin news mood. Secretary of State Marco Rubio called Iran’s demands “outrageous” and said talks had made no progress.
Market Intelligence: Crypto Analyst Predicts Best Low-Cap Crypto
Thin Weekend Trading Let a Small Sell-Off Go Further
Weekend trading explains why the drop went so far. Over the past year, about $24 million of BTC changed hands on Binance in a typical weekend hour, half the $48 million in a typical weekday hour.
We checked every hour in that year in which Bitcoin fell at least 2.5% below the hour’s opening price. There were 29 of them.
Sunday’s drop came with $180 million of trading in the hour. That is the second-lowest of all 29, and about half the median of $366 million.
In other words, it took less selling than usual to move the price this far. The busiest minute, 21:55 UTC, traded $75 million of BTC on Binance, about three times what changes hands in a whole weekend hour.
Weekends do not cause more crashes, though. Only 6 of the 29 drops came on a Saturday or Sunday, slightly fewer than the 29% of all hours that fall on weekends. What a quiet weekend changes is how far the price moves for each dollar sold.
One note: much of the forced selling happens in futures markets, which this count does not include.
So both played a part. Nvidia and Iran gave traders a reason to cut risk, and thin weekend trading let the selling run further than it would on a weekday.
Market Intelligence: Crypto Analyst Predicts Best New Crypto to Hodl
Bitcoin News for Traders: Can BTC Hold $73,510?
It held on the first test. BTC bounced to $75,735 within two hours of the low, but it has slipped back to $74,184, and the daily chart still leans lower.
Bitcoin trades below all three of its daily exponential moving averages (EMAs), trend lines that give recent prices more weight. It lost the 200-day EMA, which tracks the long-term trend, on Thursday.
Resistance: $75,735, Sunday’s rebound high, then $76,490, the 200-day EMA. Above that, $77,607, the 100-day EMA.
Support: $73,510, Sunday’s low. Below that, $73,027, the August 21 low and the last time BTC traded lower.
BTCUSDT 1D chart. Source: TradingView
Outlook Trigger Level to watch Rebound A daily close above $76,490 $77,607, the 100-day EMA Holding pattern BTC stays between $73,510 and $76,490 A range below the 200-day EMA Sell-off A daily close below $73,510 $73,027, the August 21 low
For traders following Bitcoin news this week, Monday’s stock market open is the next test. It is the first chance for Nvidia shares to trade on the news, eight days before the company reports earnings on November 17.
next
The post Bitcoin Slides to $73,510 Over the Weekend: Did Nvidia Scandal Trigger BTC’s $2,000 Flash Crash? appeared first on Coinspeaker.
Bitcoin Slides to $73,510 Over the Weekend: Did Nvidia Scandal Trigger BTC’s $2,000 Flash Crash?
In Bitcoin news overnight, BTC USD price fell from $75,607 to $73,510 in ten minutes on Sunday evening, its lowest price since August 21. The worst of it came at 21:55 UTC, or 4:55 p.m. in New York. In that single minute, Bitcoin dropped 1.9% on Binance.
Most traders blamed Nvidia. Earlier that afternoon, CNBC reported that Nvidia’s board had opened an independent investigation into CEO Jensen Huang’s relationship with a woman U.S. intelligence agencies believe was passing information to Beijing (it’s just speculation for now).
Huang admitted the affair in an email to staff.
After Jensen Huang admitted having an affair, a whale opened a 10x short on 30,000 $NVDA ($5.44M) on Hyperliquid.https://t.co/RztJx5FNge pic.twitter.com/zuyV2K0ftN
— Lookonchain (@lookonchain) November 9, 2026
The bounce since then has been small. BTC traded at $74,184 on Binance on Monday morning, 2.2% below where it stood when the Nvidia story broke. The drop also marked a fifth straight losing week: the weekly candle closed at $74,851, below the week’s open of $78,354.
So did the Nvidia scandal really trigger the dump, or did thin weekend trading turn an ordinary sell-off into a sharp one?
Discover: Sam Altman ChatGPT AI Predicts an Insane Move for Cardano (ADA)
The Nvidia Story Broke 100 Minutes Before Bitcoin Fell
The timing does not fit a straight reaction to the news. CNBC published its report at 3:12 p.m. Eastern time on Sunday, which is 20:12 UTC. Bitcoin traded at $75,880 on Binance in that minute. For the next 90 minutes, almost nothing happened. At 21:44 UTC, BTC sat at $75,607, just 0.4% lower than when the story appeared.
Then the selling started, and it started in Ethereum. Between 21:50 and 21:55 UTC, ETH fell 6.9% on Binance, from $2,213 to $2,060. Bitcoin fell 2.4% over the same five minutes.
That pattern points to a liquidation cascade, a chain of forced sales. Traders who borrow to bet on higher prices get their positions force-closed when the price falls past a set point. Each forced sale pushes the price down to the next group of bets.
BREAKING: $1,000,000,000 liquidated from the crypto market in the past 10 minutes.$BTC falls under $74,000$ETH falls under $2,125$XRP falls under $1.10 $SOL falls under $90 pic.twitter.com/hIZhzQFJJe
— Watcher.Guru (@WatcherGuru) November 8, 2026
The news still mattered. Nvidia is the biggest AI stock, and Bitcoin has traded in step with AI shares for weeks: Thursday’s chip-stock sell-off is what pushed BTC below its 200-day average. With stock markets closed, crypto was the only market open to sell into the headline.
A second headline added to the Bitcoin news mood. Secretary of State Marco Rubio called Iran’s demands “outrageous” and said talks had made no progress.
Market Intelligence: Crypto Analyst Predicts Best Low-Cap Crypto
Thin Weekend Trading Let a Small Sell-Off Go Further
Weekend trading explains why the drop went so far. Over the past year, about $24 million of BTC changed hands on Binance in a typical weekend hour, half the $48 million in a typical weekday hour.
We checked every hour in that year in which Bitcoin fell at least 2.5% below the hour’s opening price. There were 29 of them.
Sunday’s drop came with $180 million of trading in the hour. That is the second-lowest of all 29, and about half the median of $366 million.
In other words, it took less selling than usual to move the price this far. The busiest minute, 21:55 UTC, traded $75 million of BTC on Binance, about three times what changes hands in a whole weekend hour.
Weekends do not cause more crashes, though. Only 6 of the 29 drops came on a Saturday or Sunday, slightly fewer than the 29% of all hours that fall on weekends. What a quiet weekend changes is how far the price moves for each dollar sold.
One note: much of the forced selling happens in futures markets, which this count does not include.
So both played a part. Nvidia and Iran gave traders a reason to cut risk, and thin weekend trading let the selling run further than it would on a weekday.
Market Intelligence: Crypto Analyst Predicts Best New Crypto to Hodl
Bitcoin News for Traders: Can BTC Hold $73,510?
It held on the first test. BTC bounced to $75,735 within two hours of the low, but it has slipped back to $74,184, and the daily chart still leans lower.
Bitcoin trades below all three of its daily exponential moving averages (EMAs), trend lines that give recent prices more weight. It lost the 200-day EMA, which tracks the long-term trend, on Thursday.
Resistance: $75,735, Sunday’s rebound high, then $76,490, the 200-day EMA. Above that, $77,607, the 100-day EMA.
Support: $73,510, Sunday’s low. Below that, $73,027, the August 21 low and the last time BTC traded lower.
BTCUSDT 1D chart. Source: TradingView
Outlook Trigger Level to watch Rebound A daily close above $76,490 $77,607, the 100-day EMA Holding pattern BTC stays between $73,510 and $76,490 A range below the 200-day EMA Sell-off A daily close below $73,510 $73,027, the August 21 low
For traders following Bitcoin news this week, Monday’s stock market open is the next test. It is the first chance for Nvidia shares to trade on the news, eight days before the company reports earnings on November 17.
next
The post Bitcoin Slides to $73,510 Over the Weekend: Did Nvidia Scandal Trigger BTC’s $2,000 Flash Crash? appeared first on Coinspeaker.
Most traders blamed Nvidia. Earlier that afternoon, CNBC reported that Nvidia’s board had opened an independent investigation into CEO Jensen Huang’s relationship with a woman U.S. intelligence agencies believe was passing information to Beijing (it’s just speculation for now).
Huang admitted the affair in an email to staff.
After Jensen Huang admitted having an affair, a whale opened a 10x short on 30,000 $NVDA ($5.44M) on Hyperliquid.https://t.co/RztJx5FNge pic.twitter.com/zuyV2K0ftN
— Lookonchain (@lookonchain) November 9, 2026
The bounce since then has been small. BTC traded at $74,184 on Binance on Monday morning, 2.2% below where it stood when the Nvidia story broke. The drop also marked a fifth straight losing week: the weekly candle closed at $74,851, below the week’s open of $78,354.
So did the Nvidia scandal really trigger the dump, or did thin weekend trading turn an ordinary sell-off into a sharp one?
Discover: Sam Altman ChatGPT AI Predicts an Insane Move for Cardano (ADA)
The Nvidia Story Broke 100 Minutes Before Bitcoin Fell
The timing does not fit a straight reaction to the news. CNBC published its report at 3:12 p.m. Eastern time on Sunday, which is 20:12 UTC. Bitcoin traded at $75,880 on Binance in that minute. For the next 90 minutes, almost nothing happened. At 21:44 UTC, BTC sat at $75,607, just 0.4% lower than when the story appeared.
Then the selling started, and it started in Ethereum. Between 21:50 and 21:55 UTC, ETH fell 6.9% on Binance, from $2,213 to $2,060. Bitcoin fell 2.4% over the same five minutes.
That pattern points to a liquidation cascade, a chain of forced sales. Traders who borrow to bet on higher prices get their positions force-closed when the price falls past a set point. Each forced sale pushes the price down to the next group of bets.
BREAKING: $1,000,000,000 liquidated from the crypto market in the past 10 minutes.$BTC falls under $74,000$ETH falls under $2,125$XRP falls under $1.10 $SOL falls under $90 pic.twitter.com/hIZhzQFJJe
— Watcher.Guru (@WatcherGuru) November 8, 2026
The news still mattered. Nvidia is the biggest AI stock, and Bitcoin has traded in step with AI shares for weeks: Thursday’s chip-stock sell-off is what pushed BTC below its 200-day average. With stock markets closed, crypto was the only market open to sell into the headline.
A second headline added to the Bitcoin news mood. Secretary of State Marco Rubio called Iran’s demands “outrageous” and said talks had made no progress.
Market Intelligence: Crypto Analyst Predicts Best Low-Cap Crypto
Thin Weekend Trading Let a Small Sell-Off Go Further
Weekend trading explains why the drop went so far. Over the past year, about $24 million of BTC changed hands on Binance in a typical weekend hour, half the $48 million in a typical weekday hour.
We checked every hour in that year in which Bitcoin fell at least 2.5% below the hour’s opening price. There were 29 of them.
Sunday’s drop came with $180 million of trading in the hour. That is the second-lowest of all 29, and about half the median of $366 million.
In other words, it took less selling than usual to move the price this far. The busiest minute, 21:55 UTC, traded $75 million of BTC on Binance, about three times what changes hands in a whole weekend hour.
Weekends do not cause more crashes, though. Only 6 of the 29 drops came on a Saturday or Sunday, slightly fewer than the 29% of all hours that fall on weekends. What a quiet weekend changes is how far the price moves for each dollar sold.
One note: much of the forced selling happens in futures markets, which this count does not include.
So both played a part. Nvidia and Iran gave traders a reason to cut risk, and thin weekend trading let the selling run further than it would on a weekday.
Market Intelligence: Crypto Analyst Predicts Best New Crypto to Hodl
Bitcoin News for Traders: Can BTC Hold $73,510?
It held on the first test. BTC bounced to $75,735 within two hours of the low, but it has slipped back to $74,184, and the daily chart still leans lower.
Bitcoin trades below all three of its daily exponential moving averages (EMAs), trend lines that give recent prices more weight. It lost the 200-day EMA, which tracks the long-term trend, on Thursday.
Resistance: $75,735, Sunday’s rebound high, then $76,490, the 200-day EMA. Above that, $77,607, the 100-day EMA.
Support: $73,510, Sunday’s low. Below that, $73,027, the August 21 low and the last time BTC traded lower.
BTCUSDT 1D chart. Source: TradingView
Outlook Trigger Level to watch Rebound A daily close above $76,490 $77,607, the 100-day EMA Holding pattern BTC stays between $73,510 and $76,490 A range below the 200-day EMA Sell-off A daily close below $73,510 $73,027, the August 21 low
For traders following Bitcoin news this week, Monday’s stock market open is the next test. It is the first chance for Nvidia shares to trade on the news, eight days before the company reports earnings on November 17.
next
The post Bitcoin Slides to $73,510 Over the Weekend: Did Nvidia Scandal Trigger BTC’s $2,000 Flash Crash? appeared first on Coinspeaker.
330
Log in to explore more content
Join global crypto users on Binance Square
⚡️ Get latest and useful information about crypto.
💬 Trusted by the world’s largest crypto exchange.
👍 Discover real insights from verified creators.
Email / Phone number
Trending Topics
A Packed Week of Earnings and Data Tests Markets
83,299 views
490 Discussing
Nvidia Earnings, Fed Minutes and Anthropic IPO Set to Test AI Stocks and Crypto
Binance News
·148 Likes
·25.8k views
AnthropicIPOTestsInvestorAppetiteForAI
165,144 views
1,758 Discussing
NvidiaBoardNotConsideringHuang’sReturnasCEO
18,255 views
249 Discussing