


BieberKing
Open Trade
Frequent Trader
4.9 Years
26 Following
27 Followers
38 Liked
Posts
Portfolio
All
Quotes
BieberKing
·
--
SOL Falls Below the $100 Mark
#SOL #技術分析
After a strong rally that took Solana ($SOL ) to a high of 124.95 USDT, it has joined the broader market in a weekly pullback and consolidation. After retreating from its peak, the price continued to test lower levels, reaching a low of 99.26 USDT. It is now hovering around 99.78 USDT, locked in a fierce tug-of-war around the $100 mark.
Is the weekly trend searching for bottom support? What are the key turning points ahead? Here’s an in-depth breakdown!
📊 Key Technical Data Analysis
Latest price: 99.78 USDT (a slight 24-hour pullback of -1.27%)
BieberKing
·
--
DOGE Weekly Chart: Volatile Bottom Formation
#DOGE冲冲冲 #DOGE
After surging to 0.10589 USDT, Dogecoin ($DOGE) entered a pullback and consolidation phase. On the weekly chart, it found strong support at a low of 0.06766 USDT, then staged a rebound and moved sideways. The price is currently holding steady near 0.07912 USDT.
Is the weekly chart’s broader price action forming a bottom? What are the key potential turning points ahead? Here’s an in-depth analysis!
📊 Key Technical Data Analysis
Latest price: 0.07912 USDT (slight 24-hour rebound of +1.20%)
24-hour high/low: High 0.08065 / Low 0.07777
BieberKing
·
--
Will PEPE Break Out or Retest the Lows?
$PEPE <t-7/>#技術分析
PEPE ($PEPE), one of the leading meme coins, recently bottomed out and then traded sideways on the 1-hour chart. After finding support at a recent low of 0.00000421 USDT, it rebounded to a high of 0.00000447 USDT before facing selling pressure and pulling back. The price is currently moving sideways near 0.00000431 USDT.
The short-term price action has entered a tug-of-war between bulls and bears. What are the key support and resistance levels to watch next? Here’s an in-depth analysis!
📊 Key Technical Data Analysis
Latest price: 0.00000431 USDT (24-hour change: +1.17%)

一米先生01
·
--
In two minutes, you’ll understand what Binance went through to grow from 0 to 1! Reborn from the ashes, Binance is sure to change history. I put so much care into making this video, and I hope CZ and Sister Yi will give it a like! @Yi He @CZ
BieberKing
·
--
Can ALT successfully form a bottom and stage an oversold rebound?
#ALT再质押生态 #ALT #分析师预测
AltLayer($ALT )recently surged to a high of 0.01562 USDT before seeing substantial profit-taking and a pullback. It is now stabilizing near the bottom at 0.00635 USDT, with the current price holding at 0.00664 USDT as it moves sideways within a narrow range.
Has short-term selling pressure gradually been exhausted? What are the key turning points to watch for next? Here’s an in-depth analysis!
📊 Key Technical Data Analysis
Latest price: 0.00664 USDT (slight 24-hour pullback of -2.35%)
24-hour high/low: High 0.00713 / Low 0.00635
Trading volume: 24-hour volume was 519 million ALT (approximately 3.4872 million USDT). Compared with the surge in volume during the previous rally, trading volume has contracted significantly during the current gradual decline, suggesting that selling pressure is steadily fading.
BieberKing
·
--
XRP surges, then pulls back!
<t-5/>#XRPUSDT🚨
Recently, the price has seen a period of intense volatility! After finding strong support at the bottom of 1.2562 USDT, it staged a powerful rebound, reaching a previous high of 1.3992 USDT before facing resistance and pulling back. The price is currently moving sideways and consolidating around 1.3054 USDT.
The market is currently in a critical consolidation phase, with bullish and bearish forces intertwined. How will things develop from here? Let’s take an in-depth look at the technicals!
📊 Key Technical Data Analysis
Latest price: 1.3054 USDT (slight 24-hour change of -0.13%)
24-hour high/low: High 1.3307 / Low 1.3000
BieberKing
·
--
Has ETH's Pullback Found a Bottom?
$ETH
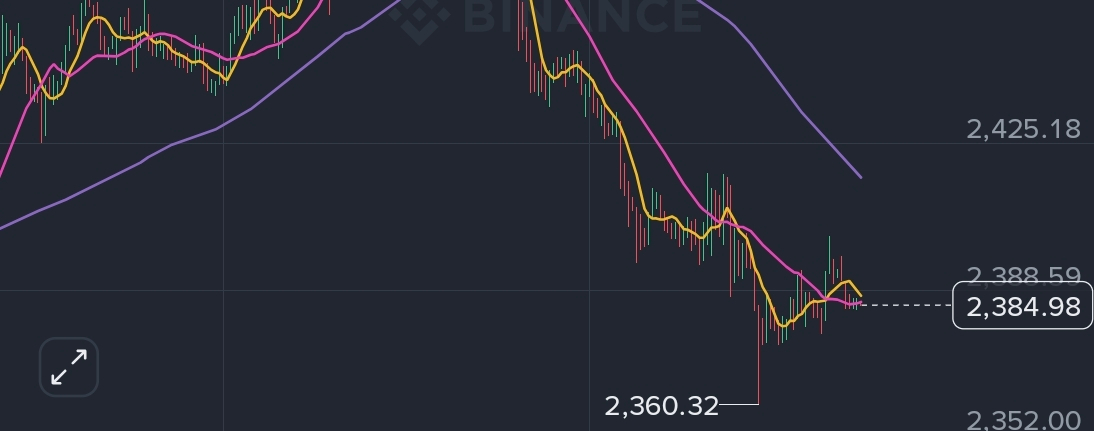
Ethereum ($ETH) has recently pulled back in tandem with the broader market, fluctuating downward from a high of 2,526.62 USDT and finding support after hitting a low of 2,360.32 USDT. The price is currently consolidating around 2,384.98 USDT.
Has the short-term trend bottomed out? Where are the key turning points ahead? Let's take a deep dive using technical indicators!
📊 Key Technical Data Analysis
Latest price: 2,384.98 USDT (down -3.94% over 24 hours)
24-hour high/low: High 2,482.94 / Low 2,360.32
Moving average trends (MA):
Short-term moving averages (MA7 / MA25): MA7 (2,387.31) and MA25 (2,385.78) are tightly clustered above the current price, forming a slight death cross and creating some short-term resistance.
BieberKing
·
--
After Falling Below 82,000, Where Is the Next Key Buy-the-Dip Level?
$BTC
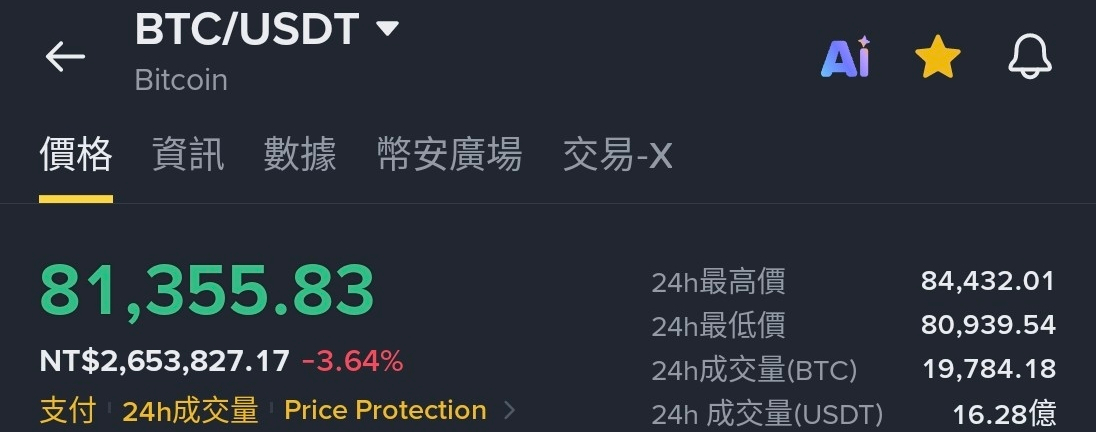
Bitcoin ($BTC ) has recently seen a notable pullback! From a high of 84,898 USDT, it fell below several key moving average supports, hitting a low of 80,939.54 USDT. The price is currently consolidating around 81,355 USDT.
Is this a shakeout before a move higher, or a reversal into a downtrend? Let’s take a detailed look at the technicals!
📊 Key Technical Data Analysis
Latest price: 81,355.83 $USDT (down -3.64% in 24 hours)
24-hour high/low: High 84,432.01 / Low 80,939.54
Moving average trends (MA):
Short-term moving averages (MA7 / MA25): MA7 (81,403) and MA25 (81,363) have now formed a death cross and are exerting downward pressure, clearly hindering short-term bullish momentum.
Log in to explore more content