

“Despite all the parabolic charts, the cryptocurrency market is remarkably cyclical in nature. These cycles typically last about 4 years, and they are remarkably consistent in terms of the time from peak to trough, how long it takes to reach new all-time highs, and how much their prices rise before entering a new cycle peak. Using $BTC as a benchmark, the typical anatomy of a cryptocurrency market cycle looks like this:
1. Excessive enthusiasm and speculation push BTC toward a new market cycle top.
2. After BTC peaks, it typically experiences a decline of about 80% before bottoming out, about a year after its previous high.
3. Once BTC hits bottom, it usually takes about two years for the price to fully recover to the previous cycle high.
4. After BTC breaks through the high of the previous cycle, it tends to rebound for about a year before setting a new all-time high - BTC will show a parabolic trend over a period of 3-5 months.
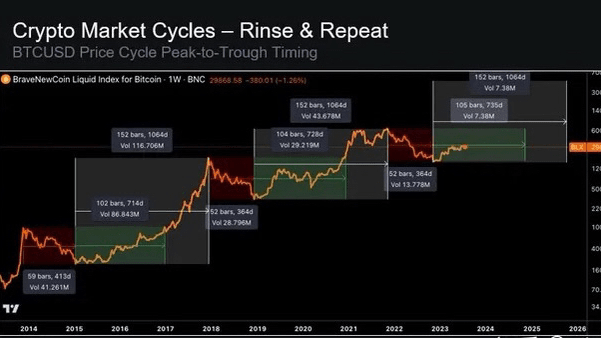
The past few cryptocurrency market cycles have followed this pattern.
After the price peaked in November 2013, BTC experienced an 85% decline, only to bottom out more than a year later.
After reaching its price peak in December 2017, BTC experienced a decline of about 80% before bottoming out almost a year later.
After the price peaked in November 2021, BTC experienced another drop of about 80% before bottoming out almost a year later.
The timing between price bottoms and new cycle peaks is also remarkably consistent. In the past two major price cycles, it took Bitcoin’s price almost two years to fully recover to the high of the previous cycle, and it took a total of three years for the price to rise from the cycle bottom to the new cycle top. After BTC’s price bottomed in January 2015, it took two years to reach the previous cycle’s all-time high, and about a year later, it hit a new cycle high (December 2017). After the price bottomed in December 2018, we saw the same thing - Bitcoin took about two years to recover to the high of late 2017, and its price continued to rise for a year before peaking in November 2021.
So where exactly are we in this current cycle?
Well, we’ve been through a painful period, with prices down ~80% from the last cycle high. We are now ~9 months from the cycle bottom in November, which would put us ~15 months away from recovering to the last cycle high (Q4 2024). The April 2024 halving is expected to occur ~18 months after BTC bottomed – just like the previous cycle – which would also set a new all-time high in Q4 2024 (and a new cycle peak in Q4 2025). For reference, this would put us around the beginning of Q4 2019 in the last cycle – which is exactly what this chart is telling us.

The above is an article from Delphi Lab. I reposted it on Twitter, but some people don’t have Twitter, so I roughly translated it and posted it here. This article is a typical case of trying to find a sword by carving a mark on a boat, but there are often rules in the market. Although they may not be very accurate, the trends are often correct. History is constantly repeating itself. There is actually no particularly significant bad news in the recent decline, but the market decline and liquidation are indeed very intense. When the main force needs to create panic, even articles like SpaceX selling BTC a long time ago will be brought out to deepen the panic. You will see what capital wants you to see, so no matter how noisy the outside world is, please keep your own pace.