
### Bitcoin Price Analysis: Outlook and Projections
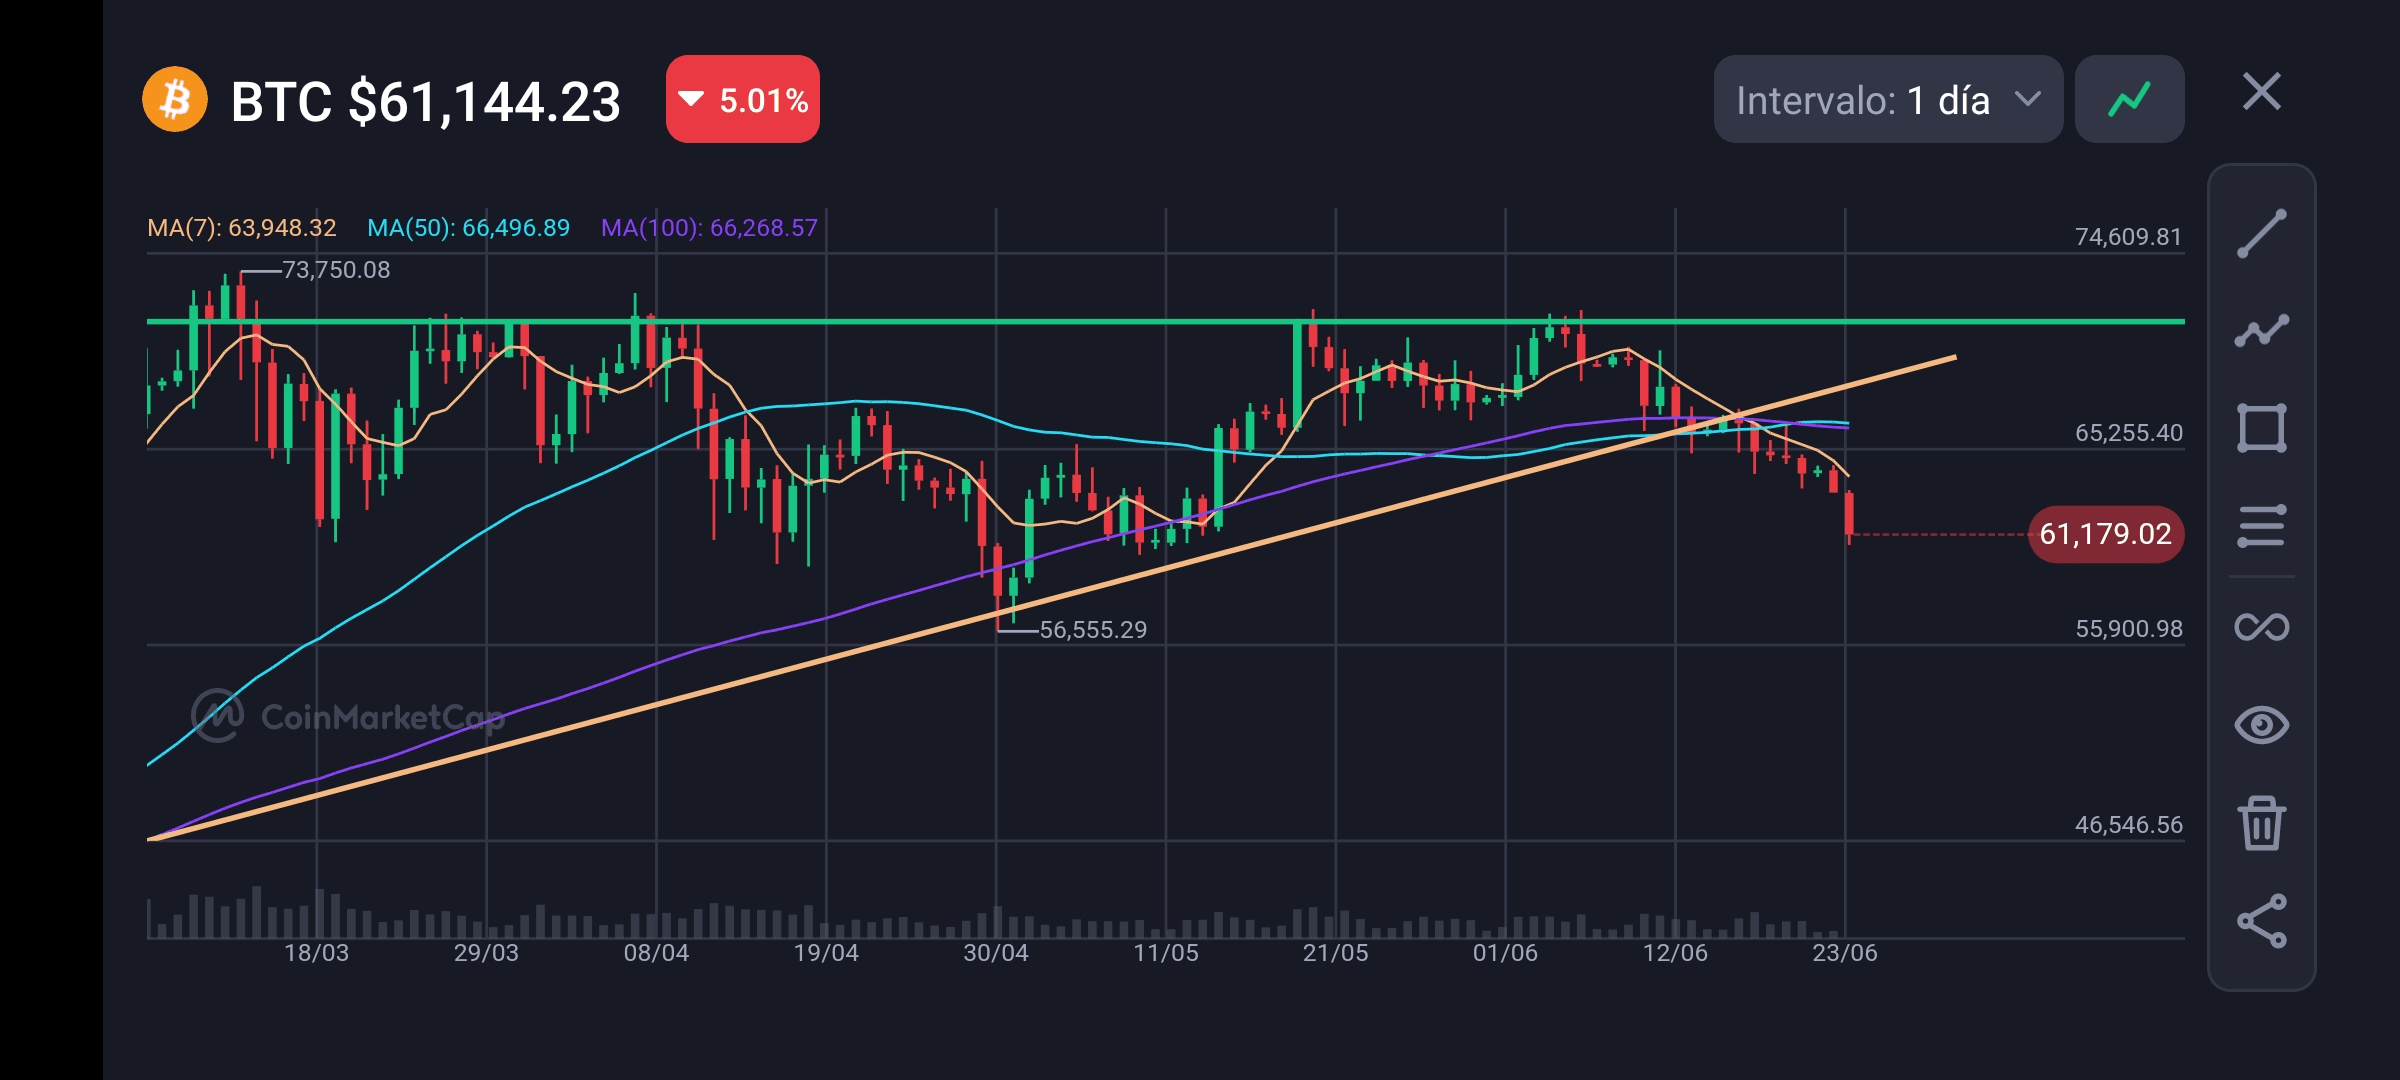
The graph provided shows the recent behavior of the price of Bitcoin (BTC), which is at $61,144.23, showing a drop of 5.01%. By analyzing moving averages and trend lines, significant patterns can be identified that can help predict the next Bitcoin price movements.
#### Moving Averages
1. **MA(7)**: The 7-day moving average is at $63,948.32, indicating that the recent price of Bitcoin is below this value, suggesting short-term bearish pressure.
2. **MA(50)**: The 50-day moving average is located at $66,496.89. This acts as a significant resistance and the current price is well below this average, indicating a stronger bearish trend.
3. **MA(100)**: The 100-day moving average is at $66,268.57. Similar to the MA(50), this reinforces resistance at higher levels, maintaining the bearish outlook.
#### Trend Lines
On the chart, you can also see trend lines that have been drawn to indicate possible support and resistance:
1. **Uptrend Line (Orange)**: This line, which was recently broken, has served as support since March. Its break indicates a possible trend change towards a more bearish direction.
2. **Horizontal Resistance Line (Green)**: Located around $73,750.08, this line has acted as a strong psychological ceiling, preventing the price from rising beyond this level on multiple occasions.
#### Support and Resistance Levels
- **Resistance**: The immediate resistance is located around $65,255.40. A break of this resistance could be an indicator of a short-term recovery.
- **Support**: Critical support lies at $55,900.98. If the price breaks this level to the downside, it could trigger a steeper decline towards the next support at $46,546.56.
#### Technical Indicators
- **Relative Strength Index (RSI)**: While not explicit on the chart, the RSI can provide additional information on whether Bitcoin is overbought or oversold. In the context of the current decline, the RSI is likely approaching oversold levels, which could indicate a potential upward correction.
### Possible Scenarios
1. **Bullish Scenario**: If Bitcoin manages to stay above the critical support of $55,900.98 and regains momentum, it could attempt to break the immediate resistance at $65,255.40. A successful break of this resistance could lead to a test of the next level around $73,750.08.
2. **Bearish Scenario**: If Bitcoin fails to hold the support at $55,900.98, we could see a drop towards the next support at $46,546.56. Increased selling pressure could accelerate this decline, especially if there are no signs of recovery in the near term.
### Conclusion
Bitcoin price is at a critical crossroads. The recent breakout of the ascending trend line and the drop below the key moving averages suggest a bearish trend in the short to medium term. However, the current support levels will be crucial in determining whether the price will find a base to bounce from or whether it will continue its decline.
It is important for investors and traders to monitor these key levels and stay informed about any significant changes in technical indicators. Maintaining a flexible strategy and being prepared for both bullish and bearish scenarios will be critical in this volatile market environment.