In the previous article, we talked about the purpose and background of this course.
It also briefly introduces the outline of the article.
This article officially starts our teaching
The first thing to correct is that
The outline introduced last time lacked one item: the practice of real offer.
I will use the trading system we have learned
Do some trading in real market
Show you the real results
The theme of this lecture is the first step in the three steps
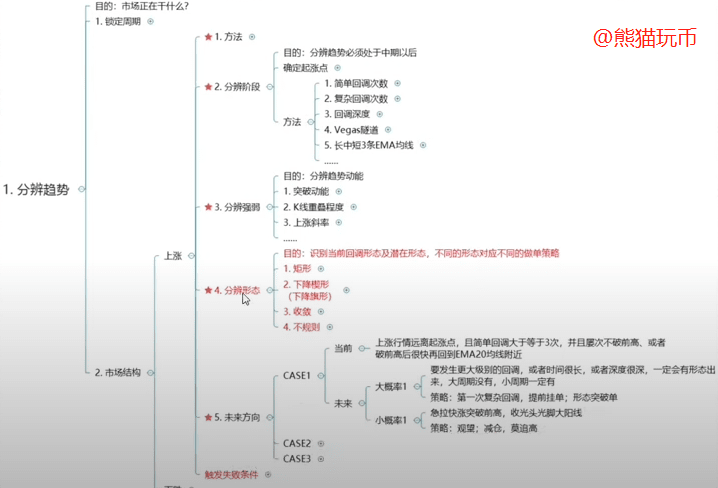
Definitely: It means to determine the trend
How to judge whether the current trend is rising, falling or sideways?
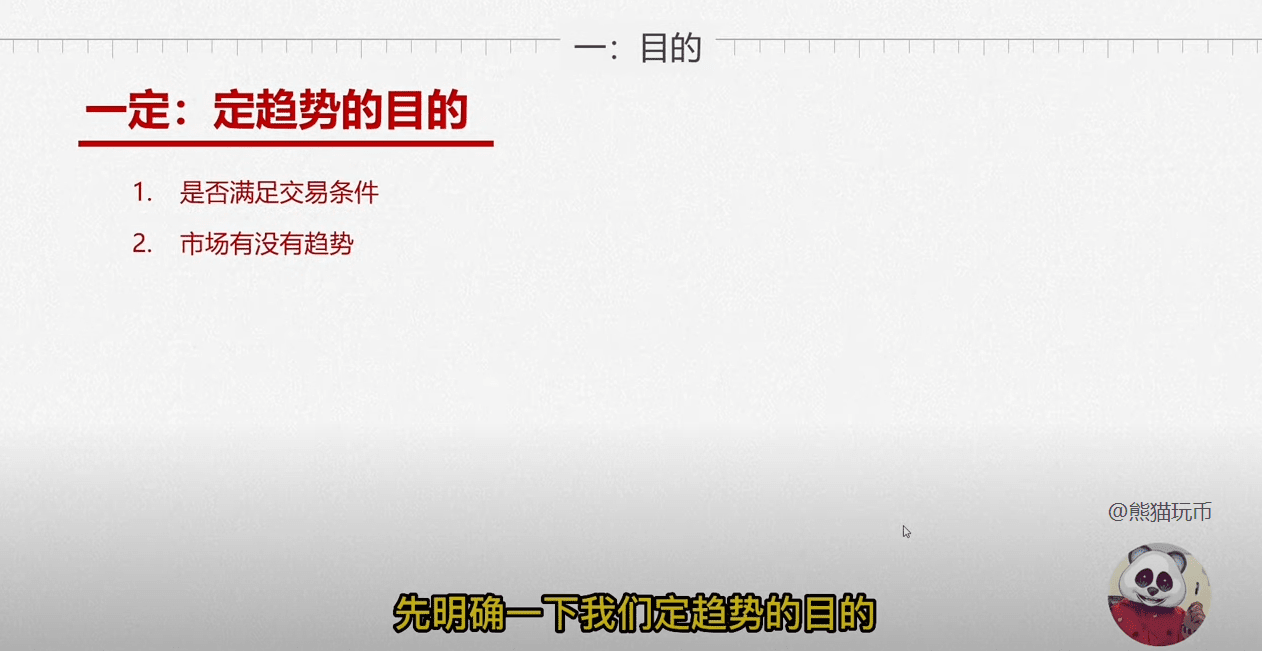
Let’s first clarify our purpose of setting trends
The purpose is to see if there is a trend in the current market
Does it meet our trading conditions?
If the current market trend is not clear, it is not the trend we want
Then we will wait and see, waiting and seeing is also a strategy in itself
If the first step fails
Naturally, there will be no more steps 2 and 3.
Just turn off the computer and do whatever you need to do.
Opportunity is waiting
It was not created by us retail investors.
If you can't stand the loneliness and insist on entering
Please think carefully about the consequences of your impulse
If you can bear the consequences
Then you just do it
No one can stop it
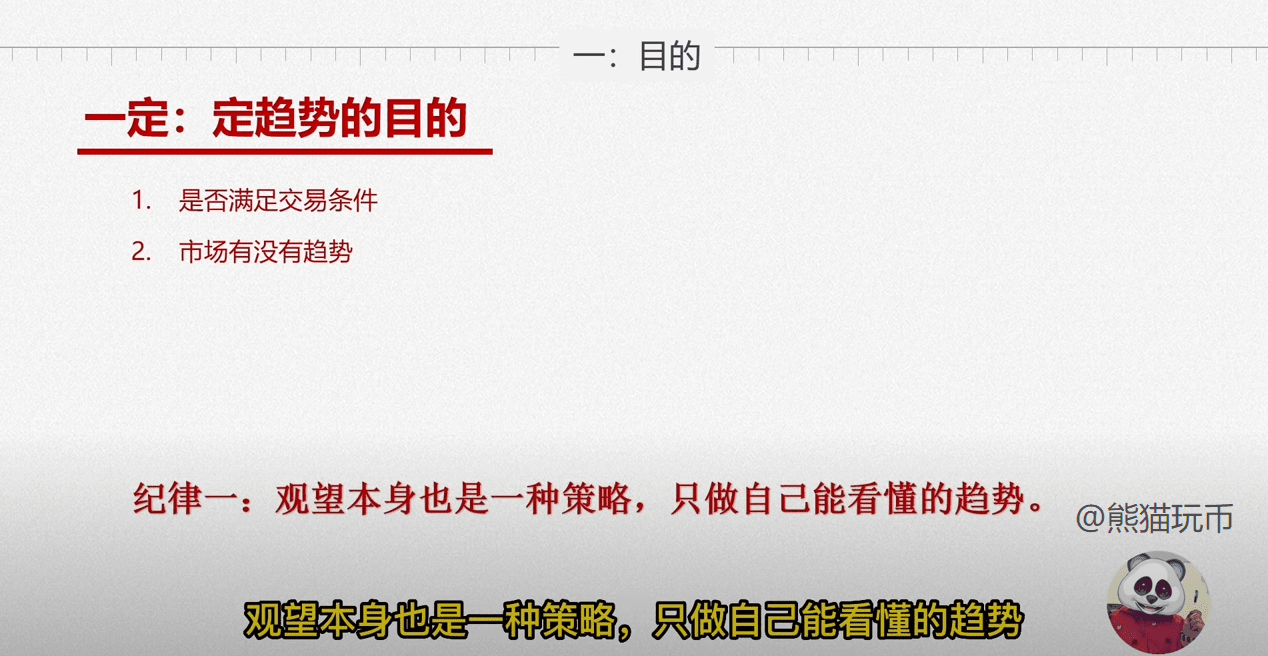
So the first rule I hope everyone will remember is:
Waiting and watching is also a strategy. Only follow the trends that you can understand.
Now let’s discuss the second question.
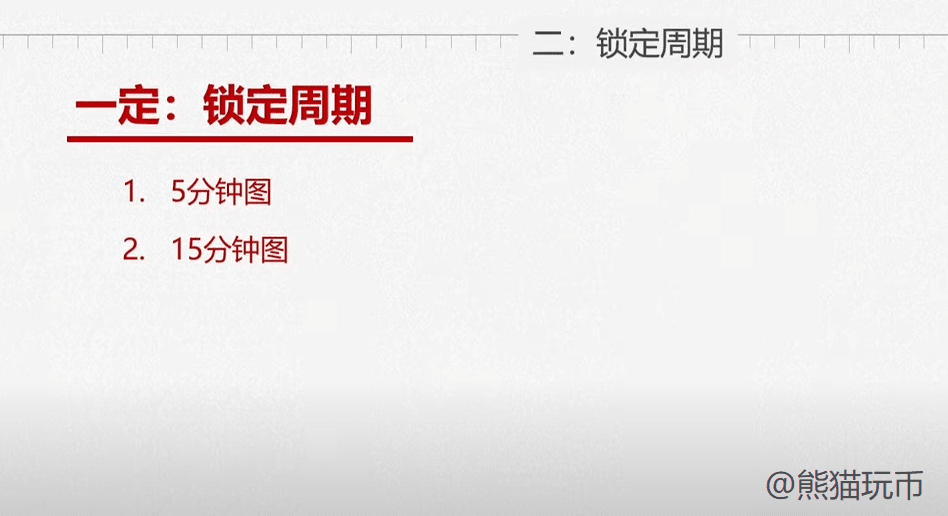
Which cycle should I look at?
For day traders
The most suitable period is the 5-minute chart and the 15-minute chart
But considering that this trading system is for beginners
So I ask everyone to abandon the 5-minute chart
Only 15 minutes
I personally rarely make 5-minute charts.
Because the 5-minute chart changes too quickly
1. Not enough time to watch the market
2. I didn’t have enough time to think and make decisions.
So please keep in mind
starting today
Our transaction cycle is 15 minutes
You are only allowed to have one transaction cycle
That's 15 minutes.
If you are relatively experienced
A veteran trader
Then you can look at the daily chart, 4H chart, 1H chart, and 5-minute chart in turn.
You can even look for entry signals on the 5-minute chart.
But for beginners
My request is not to make it so complicated
You only look at the 15-minute picture
Don't look at the others
Now I will formally teach you a simple and effective method to judge the trend
Use the long, medium and short EMA moving average group to determine the trend
For the convenience of calling
I will call this moving average combination the long, medium and short moving average combination in the future.
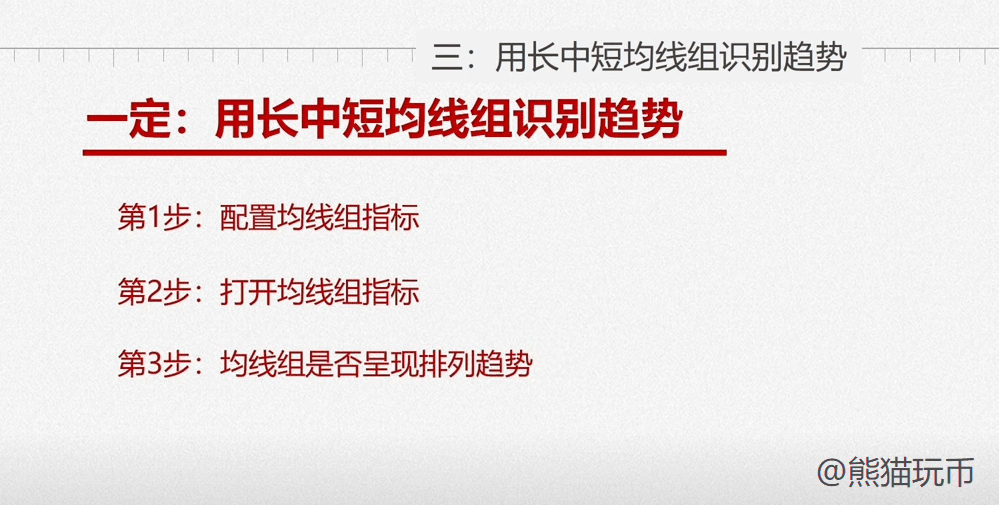
3 steps to teach you how to use long, medium and short moving averages to identify trends
Step 1: Configure the Moving Average Group indicator
Step 2: Open the Moving Average Group indicator
Step 3: Does the moving average group show an arrangement trend?
The focus is on step 3
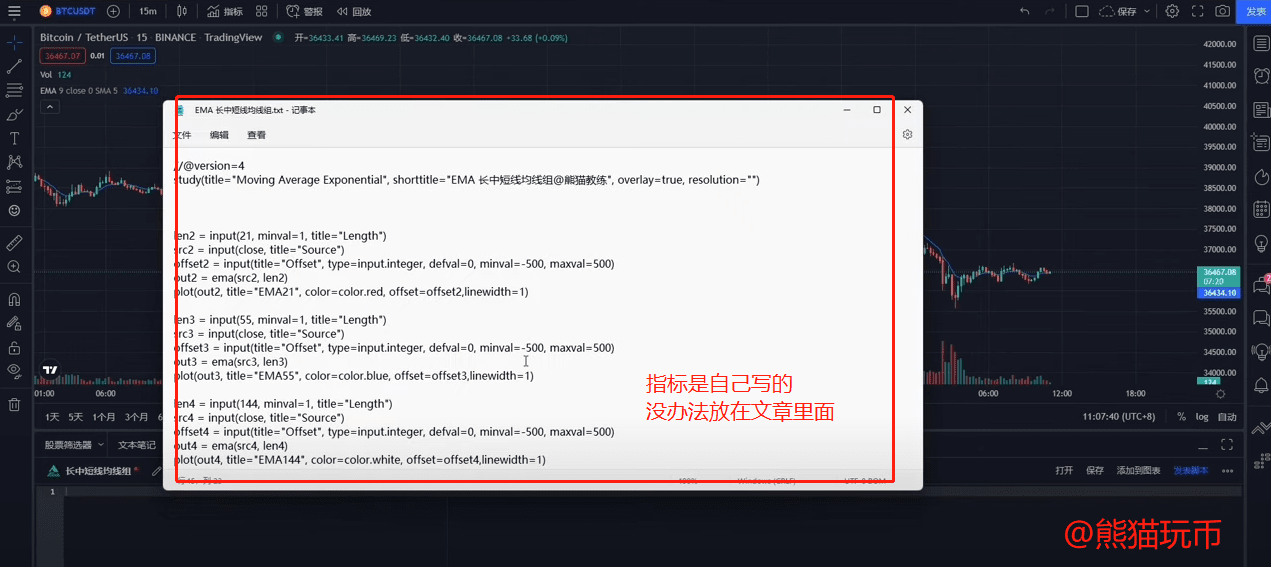
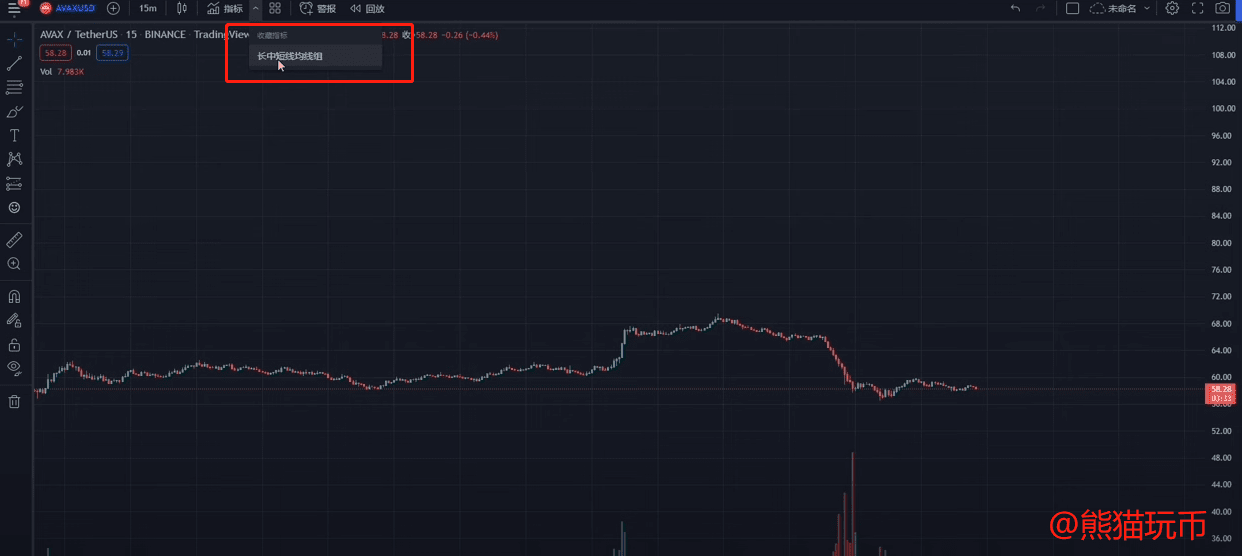
The first step is to configure the moving average group indicator
Take TradingView as an example
We all know that the free version of TradingView can only add three indicators
If we add these 3 moving averages to the chart in the formal way
The free quota was used up in no time.
If we want to open something like
Indicators such as MACD and RSI are more troublesome
So we have to learn a little trick:
How to combine these 3 moving averages and 3 indicators into 1 indicator
One more thing to add
We have no mandatory requirements for stock market viewing software
But I personally have always used TradingView
Because it is indeed recognized as the best stock viewing software in the world
Take my TradingView as an example
I'm using the client
The operation of the web version or client is the same
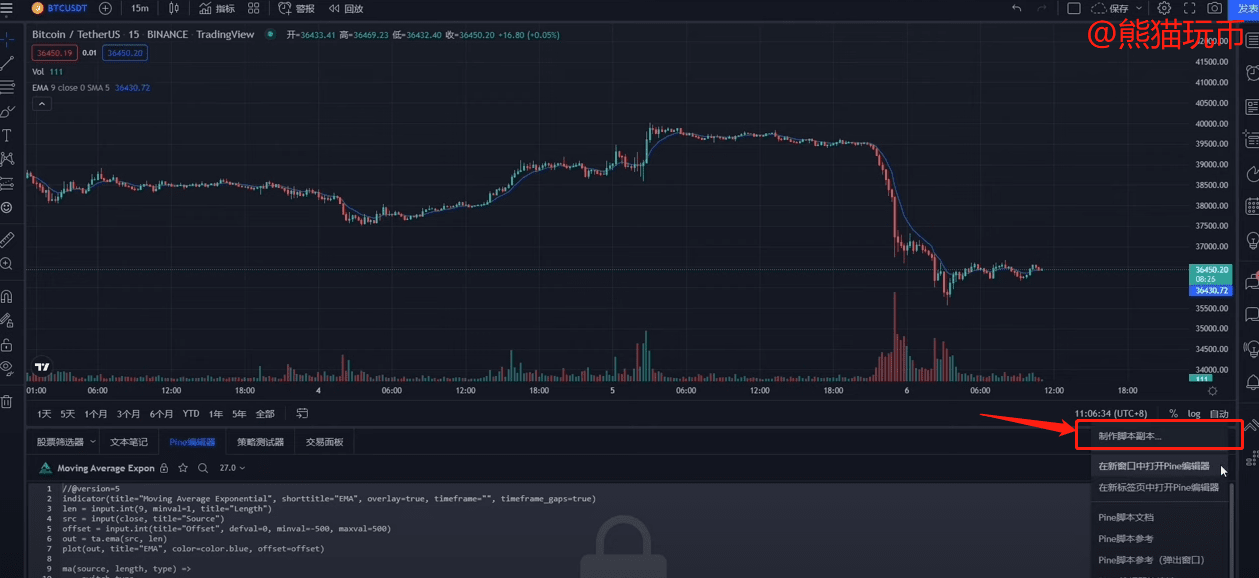
First click on the indicator above
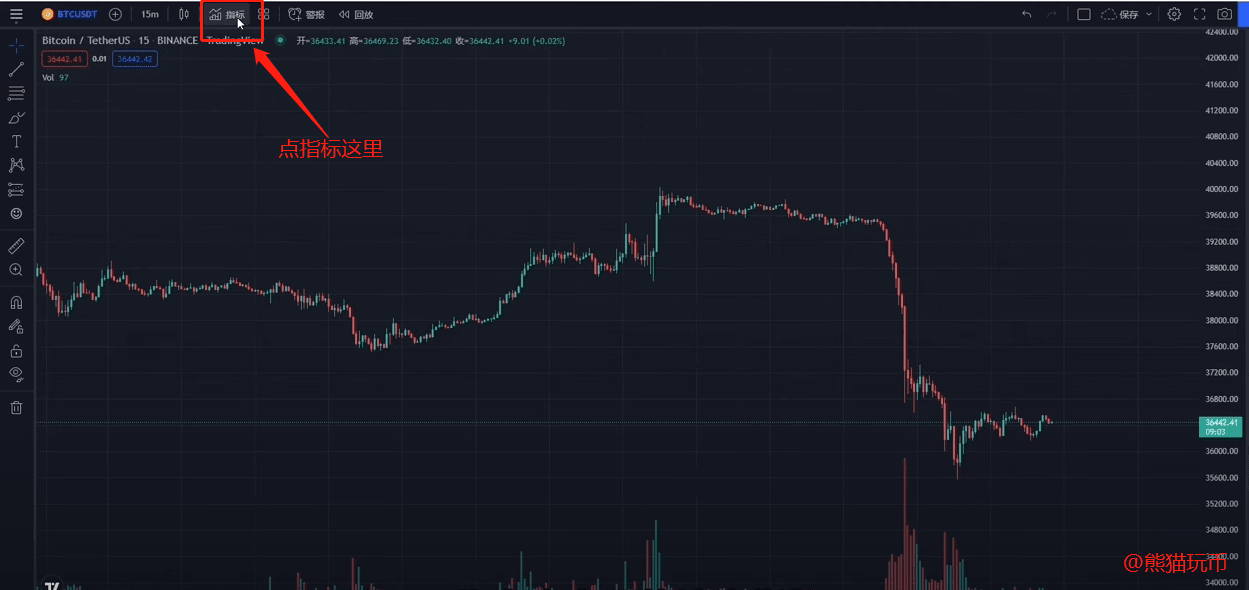
In the Technical group, select Exponential Moving Average
Click Add to Chart
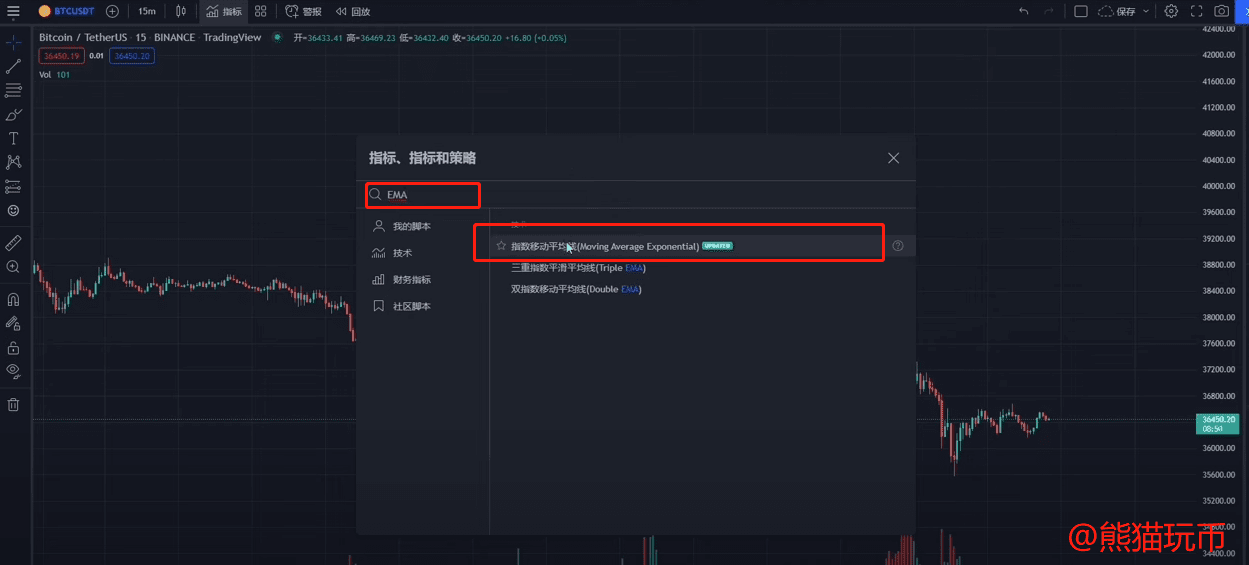
Then in the chart
Click on the curly brackets behind this indicator "Source code
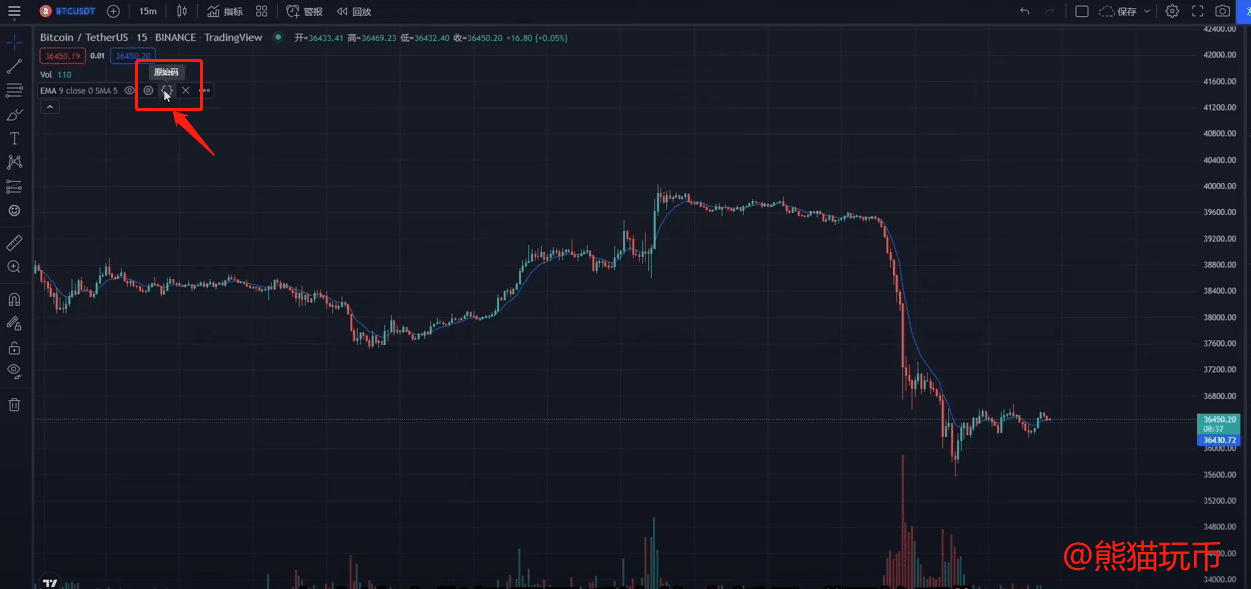
The source code of this indicator will be displayed
Then click on the three dots in the upper right corner
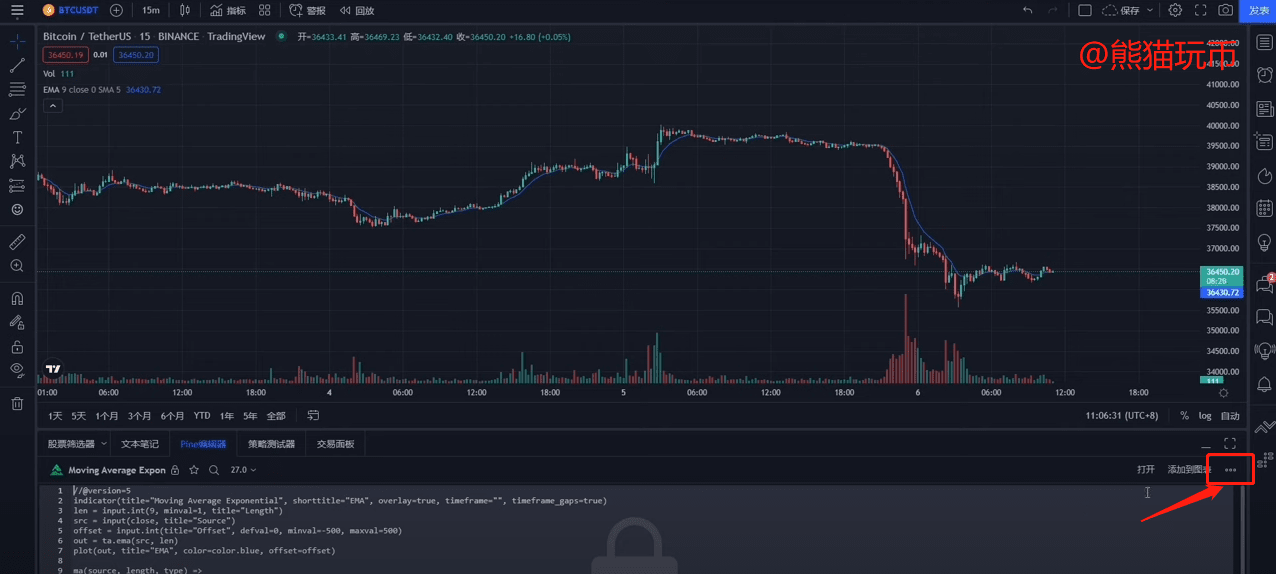
Select Make a copy of the script
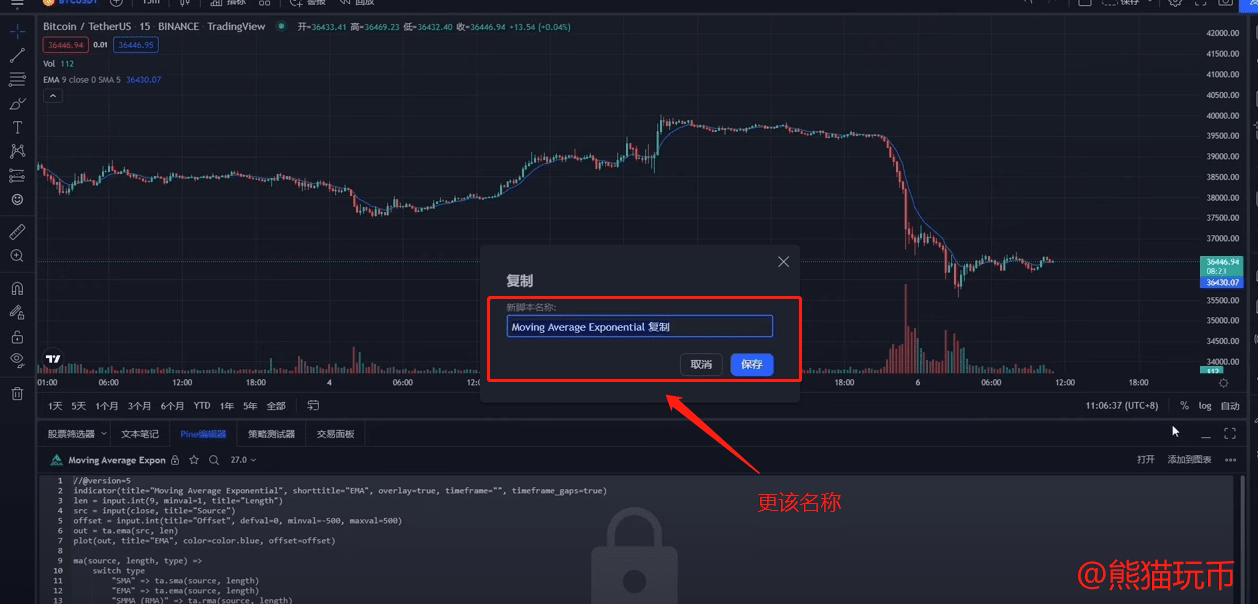
Enter the name we just gave: Long, Medium and Short Moving Average Group, click Save
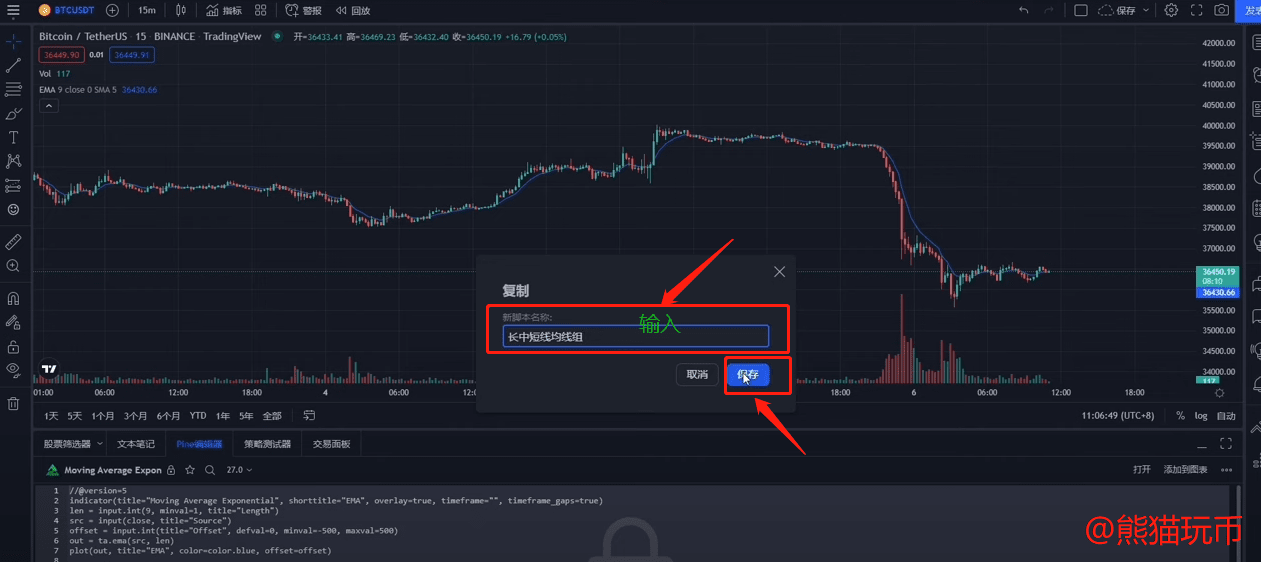
Then the most important step
We need to clear the contents first.
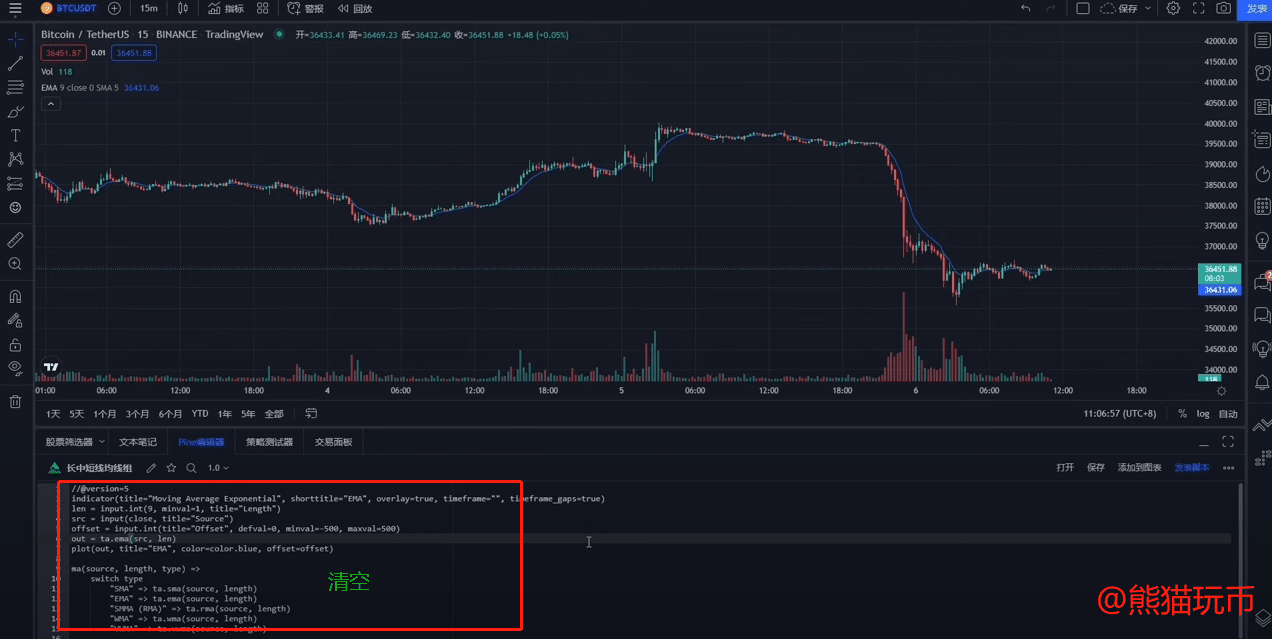
Then select, copy and paste all the codes we prepared in advance.
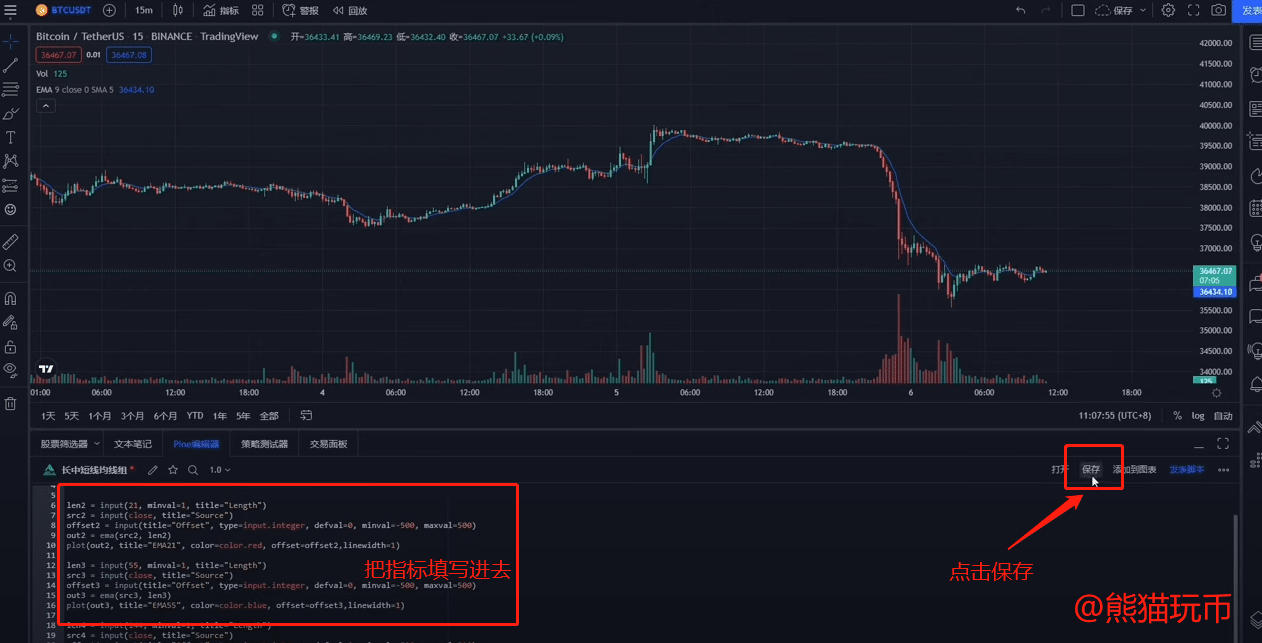
Under normal circumstances, if there is no pop-up box below prompting red font
That proves that your operation was successful.
If red text appears, it means there is something wrong with your configuration.
Please repeat all the steps above.
Or ask assistants or other classmates for help.
then
Don't forget to click the little star in the upper left corner of this location
Add to favorites button
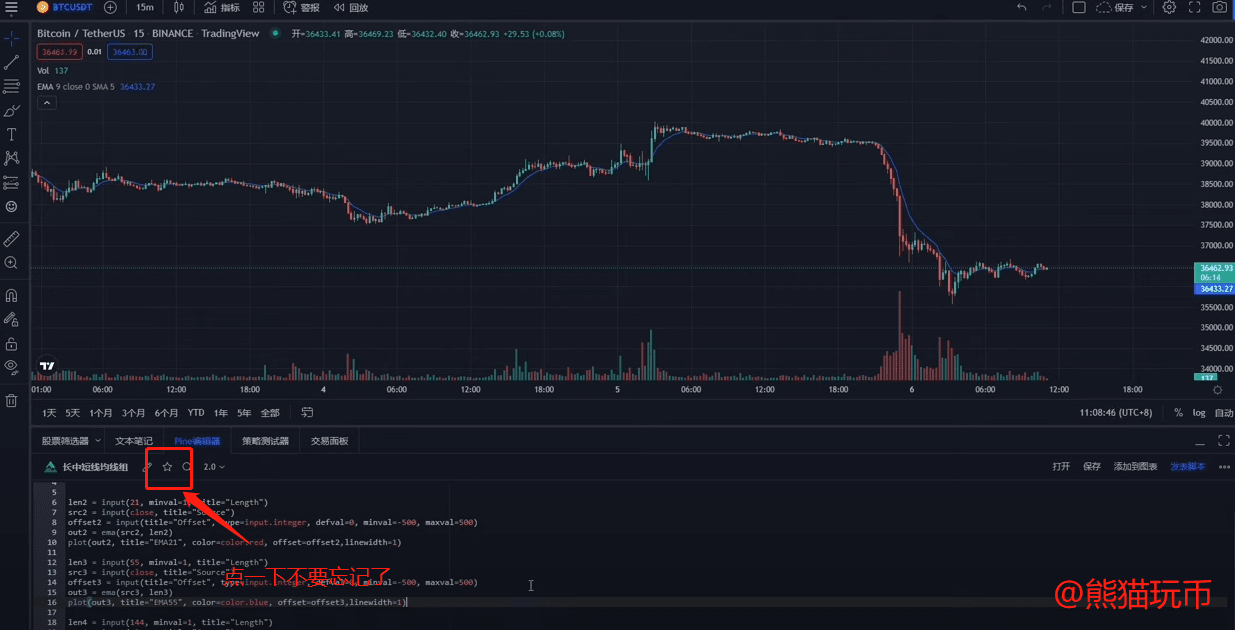
This will ensure that we can use it easily when we want to use it in the future
Step 1: Configure the moving average group indicator and you are done
Next, let’s look at the effect
When we want to use
Click the small triangle next to the indicator to select the indicator we just DIY
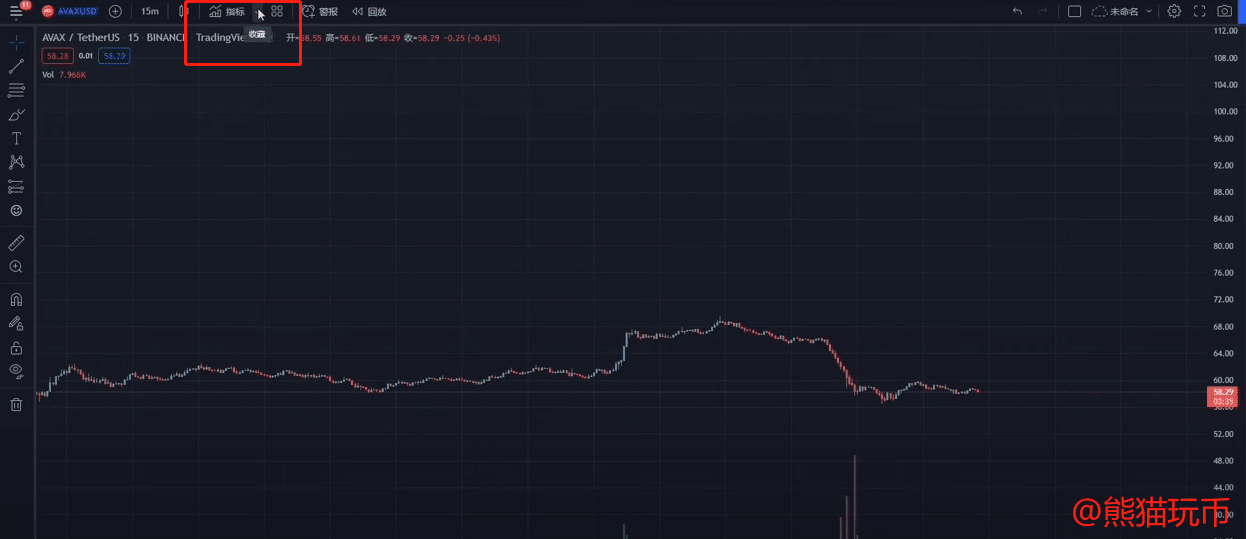
Add to chart
Step 2: Open the moving average group indicator and it is done
Then to our most important step 3:
Check whether the moving average group shows an arrangement trend
simply put

If it is a long arrangement, we only buy on dips
If it is a short position, we only short on rallies
These two situations are called trends.
That's what we hope to see
There may be trading opportunities
Any other form
For example, we ignore entanglement and crossing.
These are not what we want, so we can just go to bed.
What is a multi-head arrangement?
What is a short arrangement?
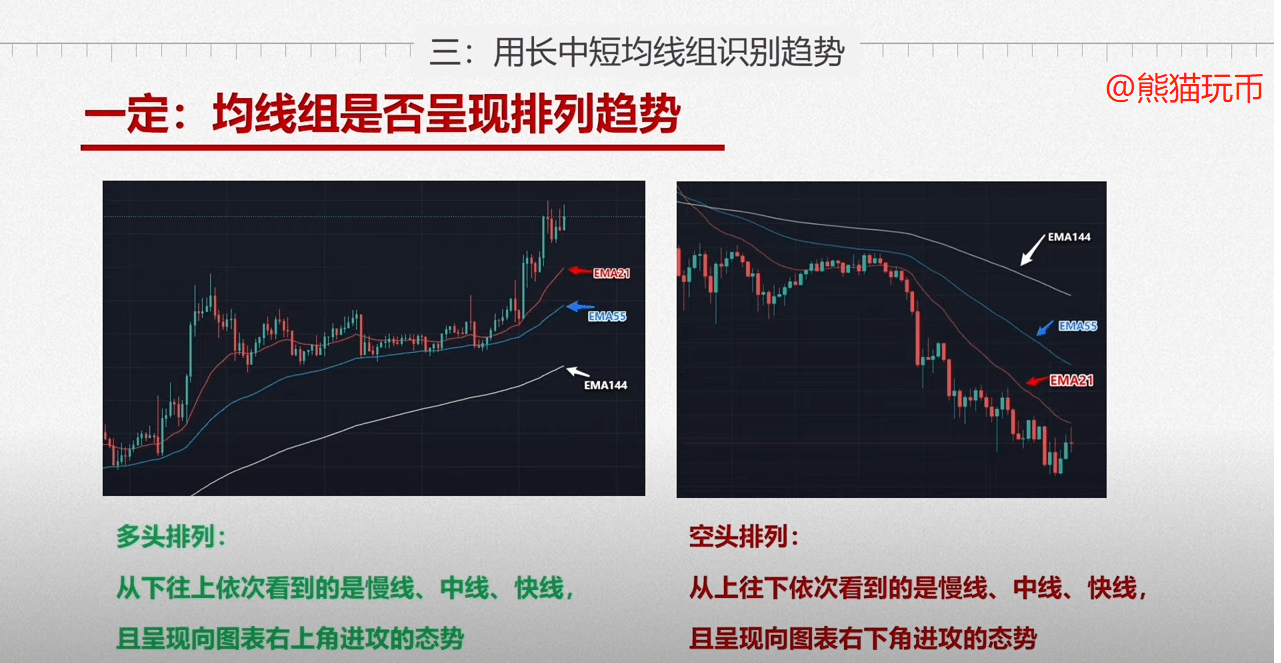
This red line is our EMA21 (that is, the fast line)
This blue line is EMA55 (also known as the middle line)
This white line is EMA144 (also known as the slow line)
If we look from bottom to top,
Slow line, medium line, fast line
And these three moving averages are trending towards the upper right corner of your chart.
That's a long arrangement.
If we look from top to bottom,
Slow line, medium line, fast line
And these three moving averages are showing an attacking trend towards the lower right corner of your chart.
This is the empty arrangement
It's that simple.
Let’s look at a few cases
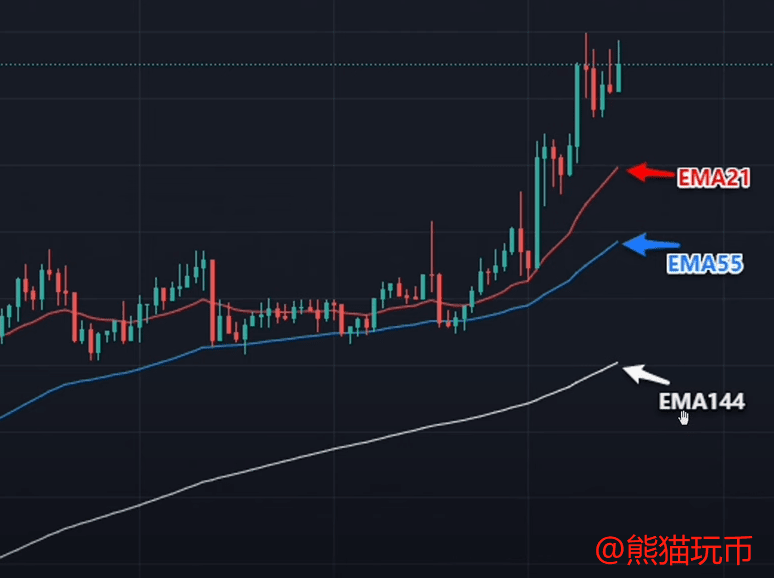
Case 1
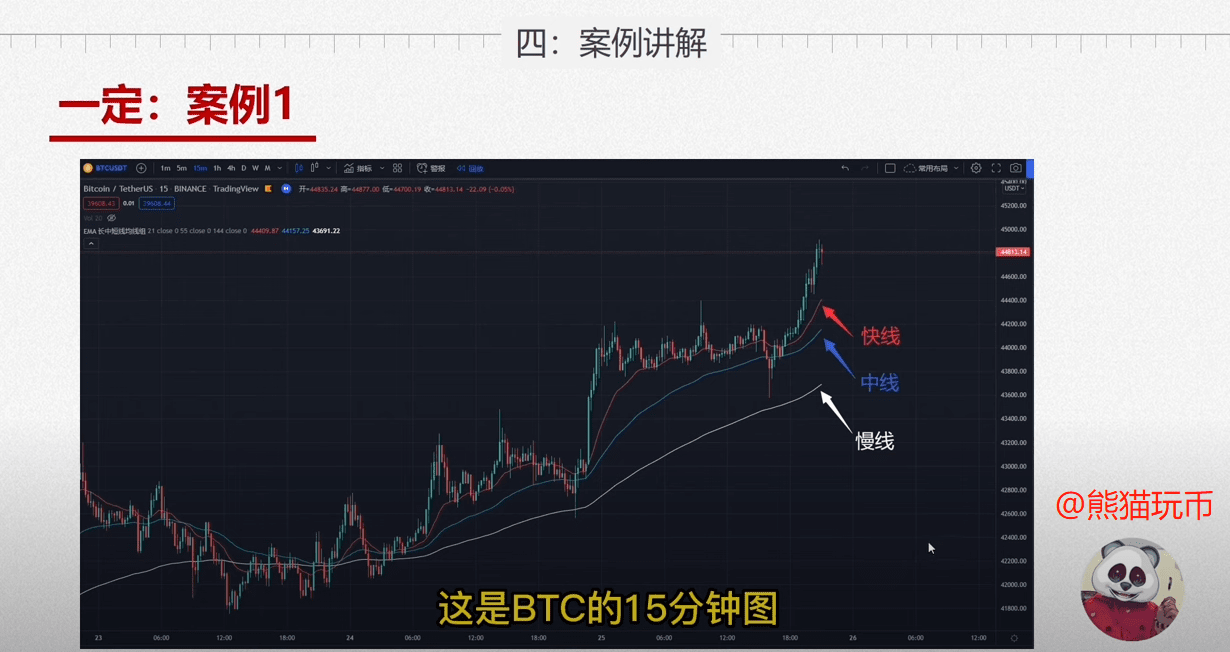
We see the current three moving average arrangement characteristics
From bottom to top, you can see the slow line, the middle line, and the fast line.
And it is showing an attacking trend towards the upper right corner of the chart
This is a textbook multi-head arrangement.
Case: 2
This is also the BTC 15-minute chart
Do you think the current trend is a bullish one?
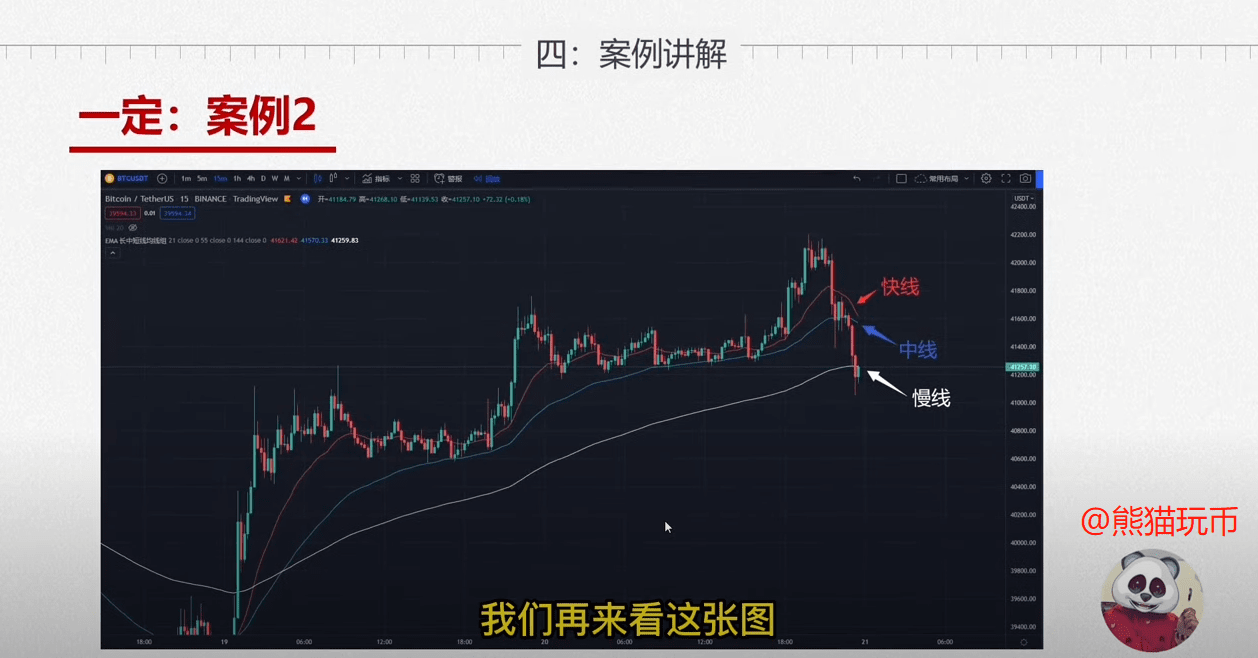
Answer: Yes
You may have doubts
Isn't this a short position arrangement for the fast line and the mid-line?
And the white line is about to head down
How can it be a multi-head arrangement?
Please note! "Almost bowing" does not mean that you have already bowed your head
In addition to the stability of the moving average indicator
Don't forget that there is another important feature called hysteresis.
So you just see
From bottom to top, we can see the slow line, the middle line, and the fast line.
That's called a multi-head arrangement.
The current trading direction is to buy on dips only, not to sell on rallies.
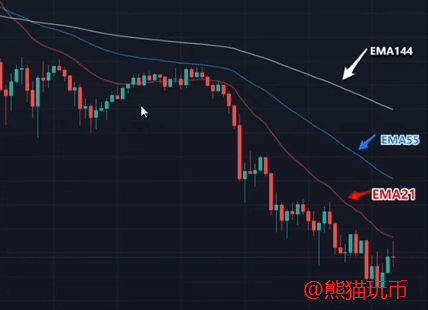
Case: 3
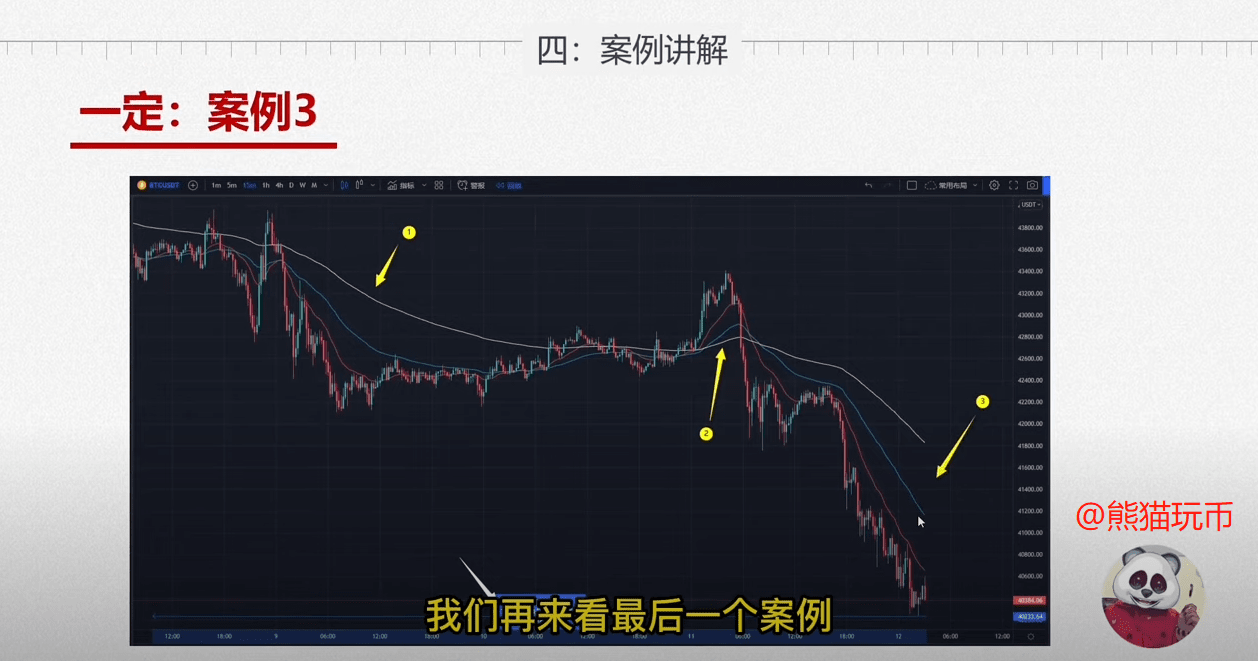
At points 1 and 3
From top to bottom, we can see the slow line, the middle line, and the fast line.
And it is showing an attacking trend towards the lower right corner of the chart
This is a textbook short position arrangement.
It is worth noting that point 2
Isn't this also considered a long arrangement?
So should I go long here?
The answer is no
Because the location of point 2 did not give us a good signal
Even if the signal is given, there is no profit and loss ratio!
We will explain this in detail in future articles.
It is also worth mentioning that
I made a very obvious mistake on this chart.
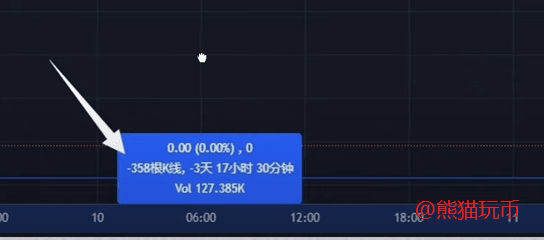
It is clear from this chart that
More than 300 K lines are visible
My request is that in your trading cycle
In your visual range
No more than 250 K lines are allowed
I hope everyone will remember this!
We will discuss more cases in detail in Lesson 3.
In this article, we focus on learning theoretical knowledge
Just a simple understanding
We just need to skillfully apply the method we just talked about.
It is certain that you can make stable profits
Finally, the summary
Let’s briefly review the content of Lecture 2 of this article.
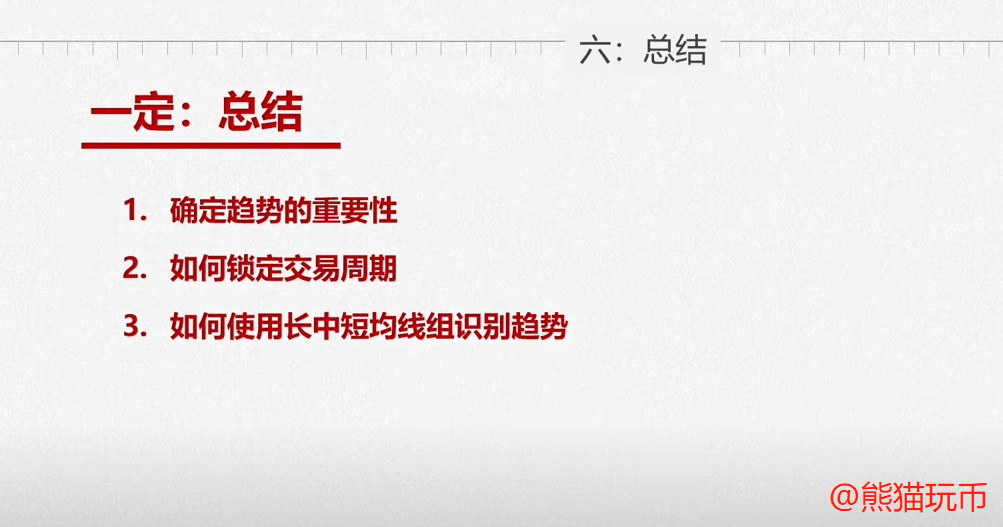
We first understand the importance of step 1.
And know how to choose the trading cycle that suits us
Then I focused on learning how to configure
How to use long, medium and short moving averages to identify trends
To sum up,
If it is a long or short arrangement, then there is a trend
We can continue to judge steps 2 and 3
Check if all conditions are met before entering
If there is no trend, or it is flat, or we don’t understand
Then there is no need to continue to judge steps 2 and 3.
It's already broken at this point
In fact, as a mature and complete trading system
When identifying the trend in step 1
We not only need to know whether it is a long arrangement or a short arrangement
And also know the stage of the current trend
Is it early, mid or late stage?
As well as the strength and shape of the trend
And also to predict the future direction
But since what we have learned so far is a set of
Entry-level intraday short-term trading system
So there is no need
I don't have time to learn something so complicated.
If you are really interested
You can ask the assistant about the content of the system course
But this does not mean that our course is meaningless.
Get started first and then enter the industry
This simple trading system
If you can use persistence skillfully
It is also possible to achieve stable profits
Be sure to avoid arrogance and impatience!
The above is all our content today. The moving average settings are explained in detail in the pictures.
If you don't understand, just look at the pictures.
I am Coach Panda, who is good at making complex issues simpler.
The second half will be updated tomorrow. If you like this article, please give me a little love.
This is the greatest encouragement to me, and I will continue to produce more high-quality content.