
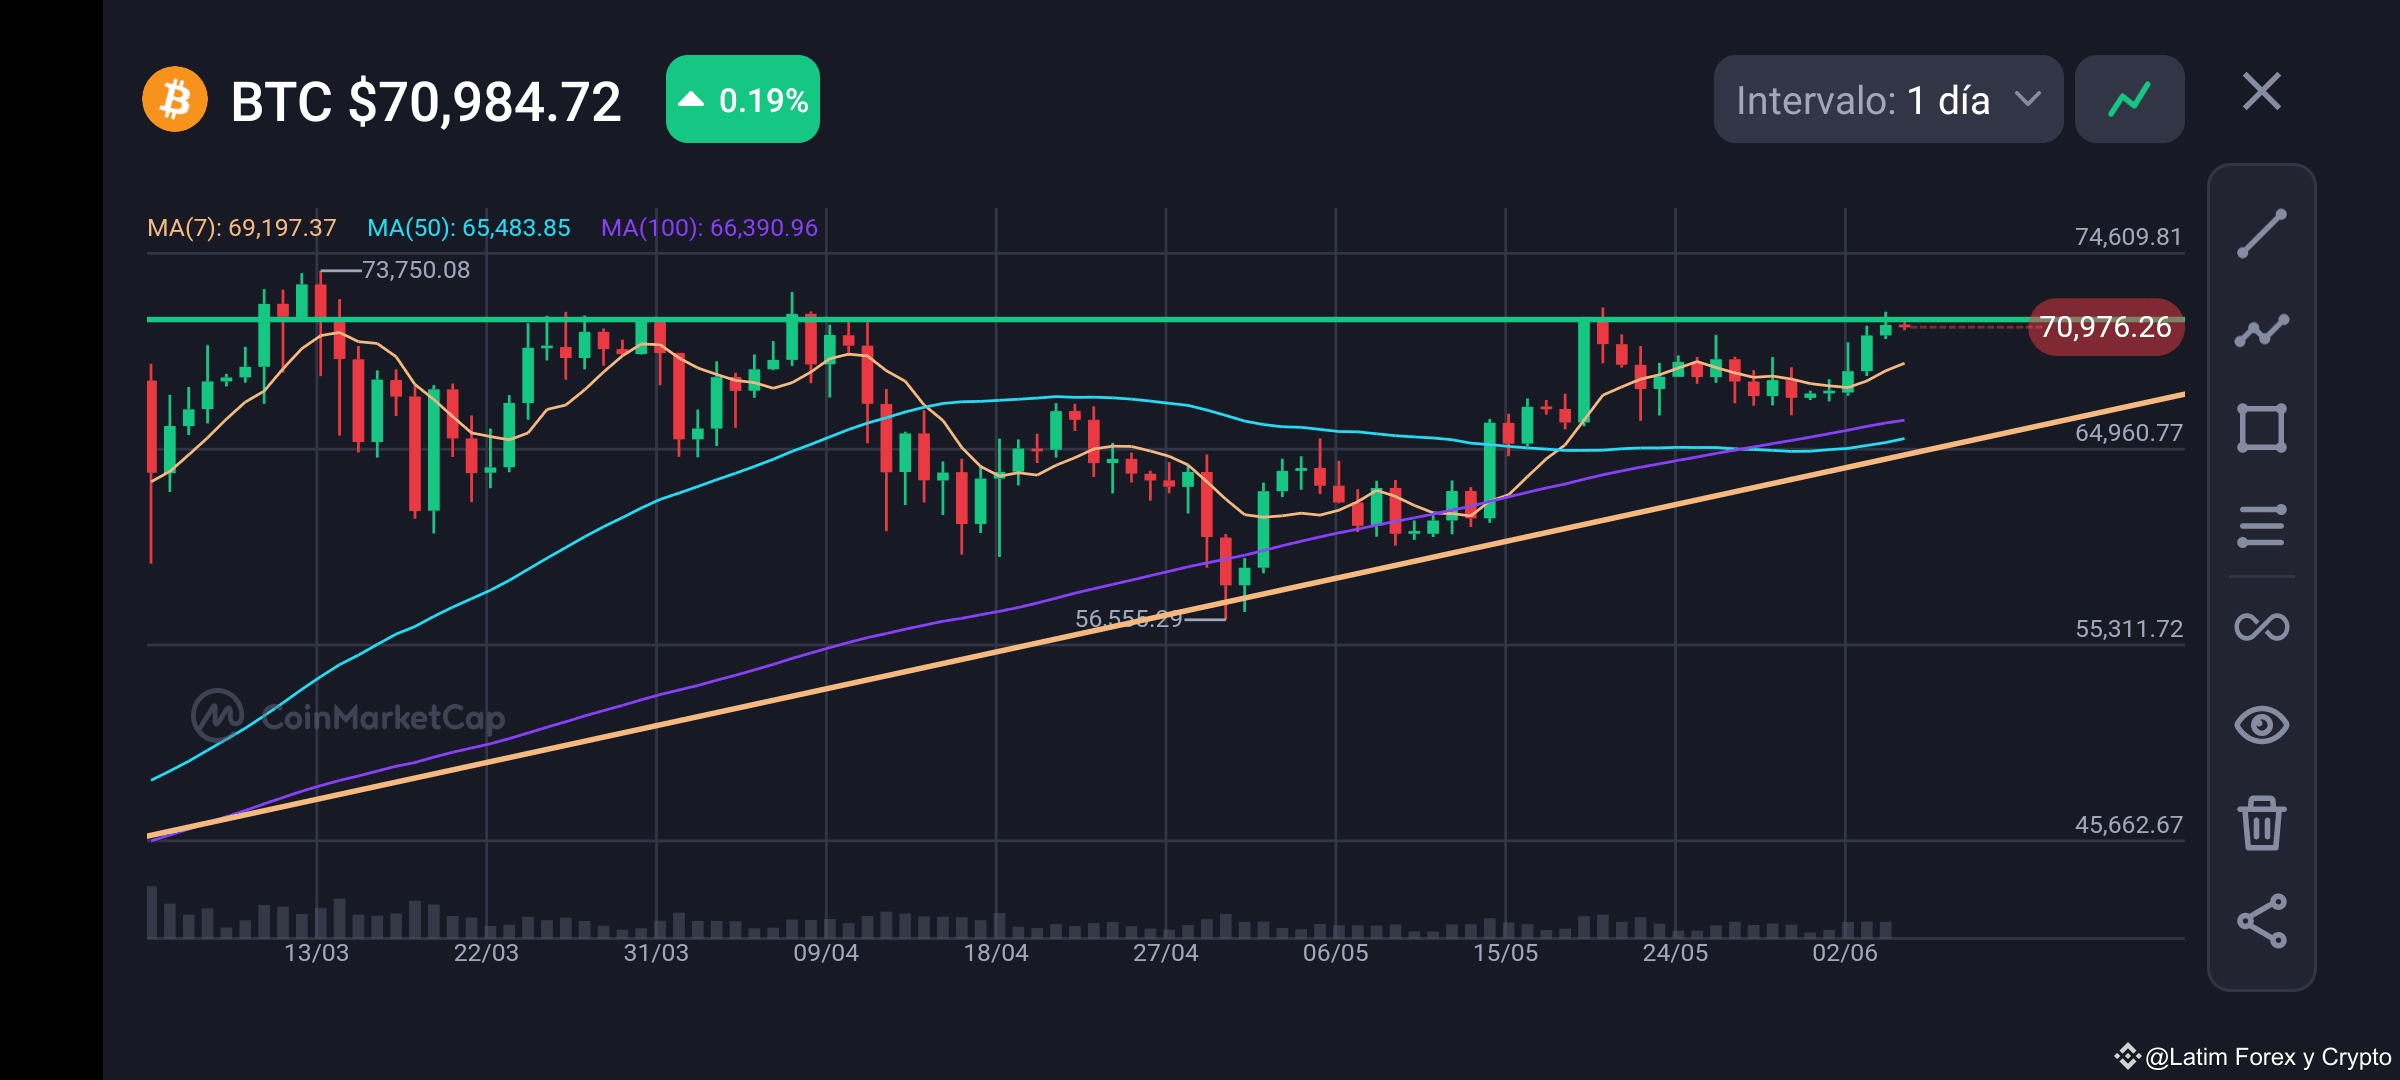
### BTC Set to Soar or Correct? Key Analysis for This Week
Current Status:
- Price: $70,984.72 (up 0.19%)
- Moving Averages:
- MA(7): $69,197.37
- MA(50): $65,483.85
- MA(100): $66,390.96
Technical Overview:
1. Resistance and Support Levels:
- Current Resistance: $73,750.08
- Immediate Support: $64,960.77
- Long-term Support: $56,555.29
2. Trend Analysis:
- The BTC price is above the 7-day, 50-day, and 100-day moving averages, indicating a strong bullish trend.
- The ascending support line (orange) is well-maintained, further confirming the upward trend.
Possible Scenarios for This Week:
1. Bullish Scenario:
- Breakout Above Resistance: If BTC can break through the resistance at $73,750.08, it could move towards the next psychological level of $75,000 and potentially higher, given the strong upward momentum.
- Support from Moving Averages: The proximity of the 7-day MA to the current price suggests strong support, potentially driving the price higher in the short term.
2. Bearish Scenario:
- Failure to Break Resistance: If BTC fails to surpass the resistance at $73,750.08, it may experience a pullback towards the immediate support at $64,960.77.
- Breakdown Below Support: A breach below the immediate support level could lead to a deeper correction towards the long-term support around $56,555.29.
### Conclusion:
The overall trend for BTC remains bullish with strong support from the moving averages and the ascending trendline. Key resistance and support levels will play a crucial role in determining the price movement for this week. A successful break above the current resistance could see BTC targeting new highs, while failure to maintain the current levels might lead to a short-term correction. Traders should watch for price action around these key levels to make informed decisions.