The head and shoulders bottom is the most common and familiar pattern. You can see it on Weibo or other places every now and then. However, the truly standard and effective head and shoulders bottom does not appear very often.
But at the same time, once this pattern is truly formed, the energy it brings is enormous, enough for us to make a lot of money and have a full meal.

1. The formation process of head and shoulders bottom
1. After a period of continuous price decline, the trend comes to an end and the left shoulder begins to form. During this decline, the trading volume will be significantly larger; and when the left shoulder bottoms out and rebounds, the trading volume will be reduced.
2. The price falls below the left shoulder and breaks down. The break will cause panic in the market, which will increase the trading volume again and form panic selling.
3. The head starts to rise, but the rebound encounters resistance near the high point of the left shoulder rebound, and the price moves downward again. Generally, the volume of this rebound will be significantly smaller.
4. The price falls again after encountering resistance, but this time the decline stops near the low point of the left shoulder.
5. The price began to rise for the third time, and this time the trading volume was significantly enlarged. When the price broke through its neckline resistance, a huge amount of trading was released, announcing the establishment of a head and shoulders bottom.
6. There may be a pullback after the breakthrough. The pullback is required to be accompanied by a reduction in trading volume and stop falling above the neckline.

2. The significance of the head and shoulders bottom
From the three declines, the head and shoulders bottom shows that the long-term trend is gradually changing.
The price falls again and again. Although the second low point is lower than the previous one, it is likely to turn around and return to the high point of the first rebound, which shows that the downward energy has been fully released.
The next third decline stopped falling and rebounded before reaching the low point of the head, reflecting that the power of the bulls has overcome that of the bears here.
When the resistance level (neckline) formed by the high points of two rebounds is broken by a large volume, it indicates the confirmation of the shift of power between bulls and bears, confirming that the bulls have completely controlled the market.
(III) Operational Strategy
There are two best buying points in the head and shoulders bottom pattern. The first is when the pattern just breaks out (A), and the second is when it pulls back and stabilizes (B).
Point A is more aggressive, and once a large-volume breakthrough occurs, a position is immediately opened. The key here is to see a large-volume breakthrough. The advantage is that it can ensure that the market is captured, but the disadvantage is that the entry point is generally higher, and once a pullback occurs later, you will have to suffer the pain of multiple rescues.
Point B is relatively stable. A successful pullback after the breakthrough is a further confirmation of the pattern. If the pullback transaction shrinks significantly and the decline becomes slower and slower, it can be basically confirmed that the head and shoulders bottom is solid and effective. At this time, the buying price is more appropriate and the stop loss can be relatively small - stop loss below the neckline. The disadvantage is that this pullback may not appear. When the trend is very strong, the price may directly break through to a very high position before starting to adjust. Then the buyers waiting for the pullback can only miss the opportunity first and then chase the high.
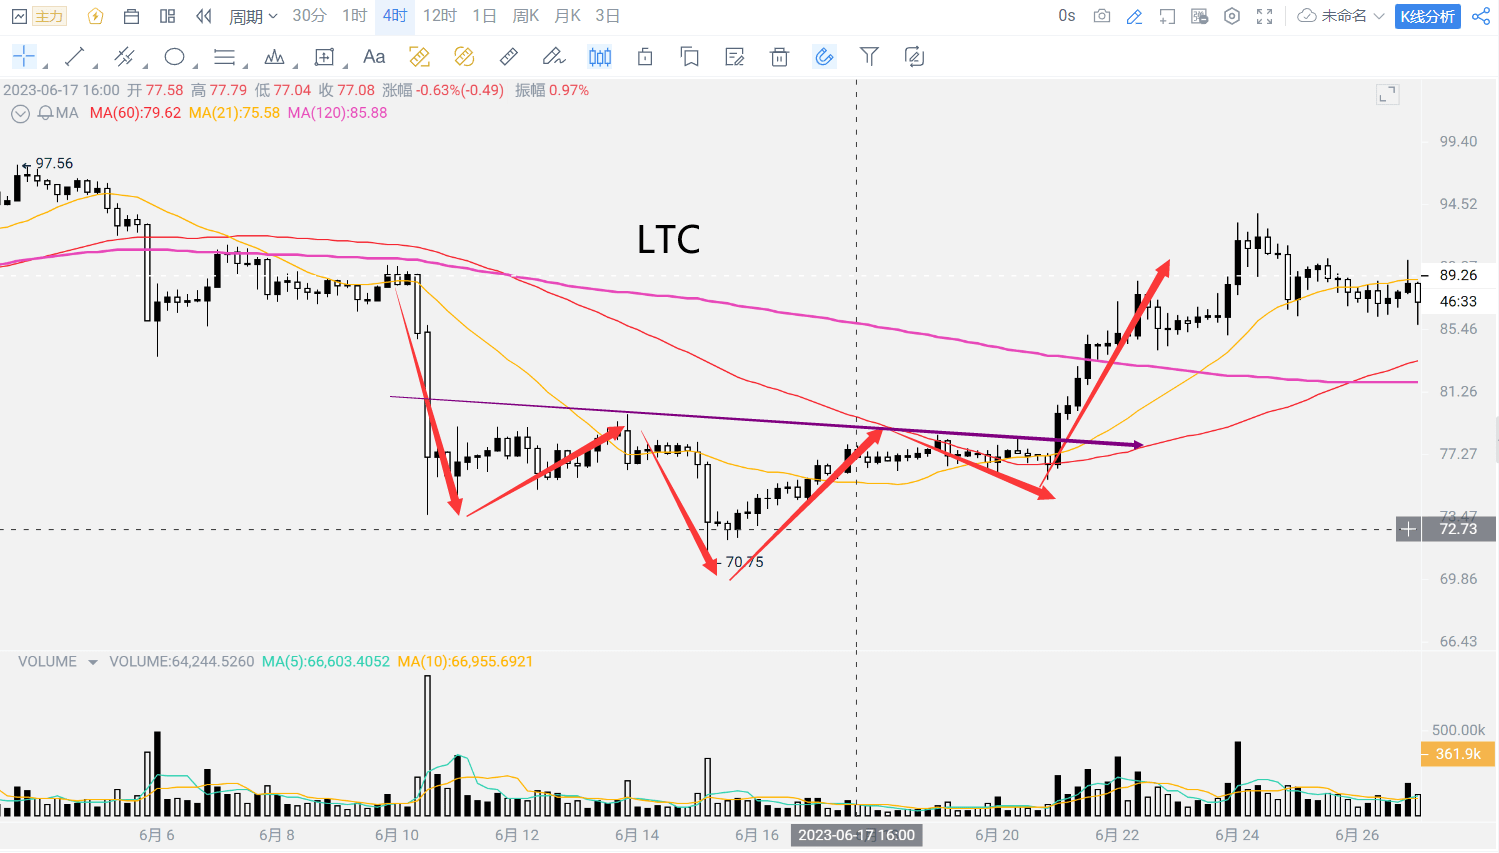
(IV) Some head and shoulders bottom patterns that have appeared in the cryptocurrency market