
### Analysis of the PEPE Asset
#### Spanish
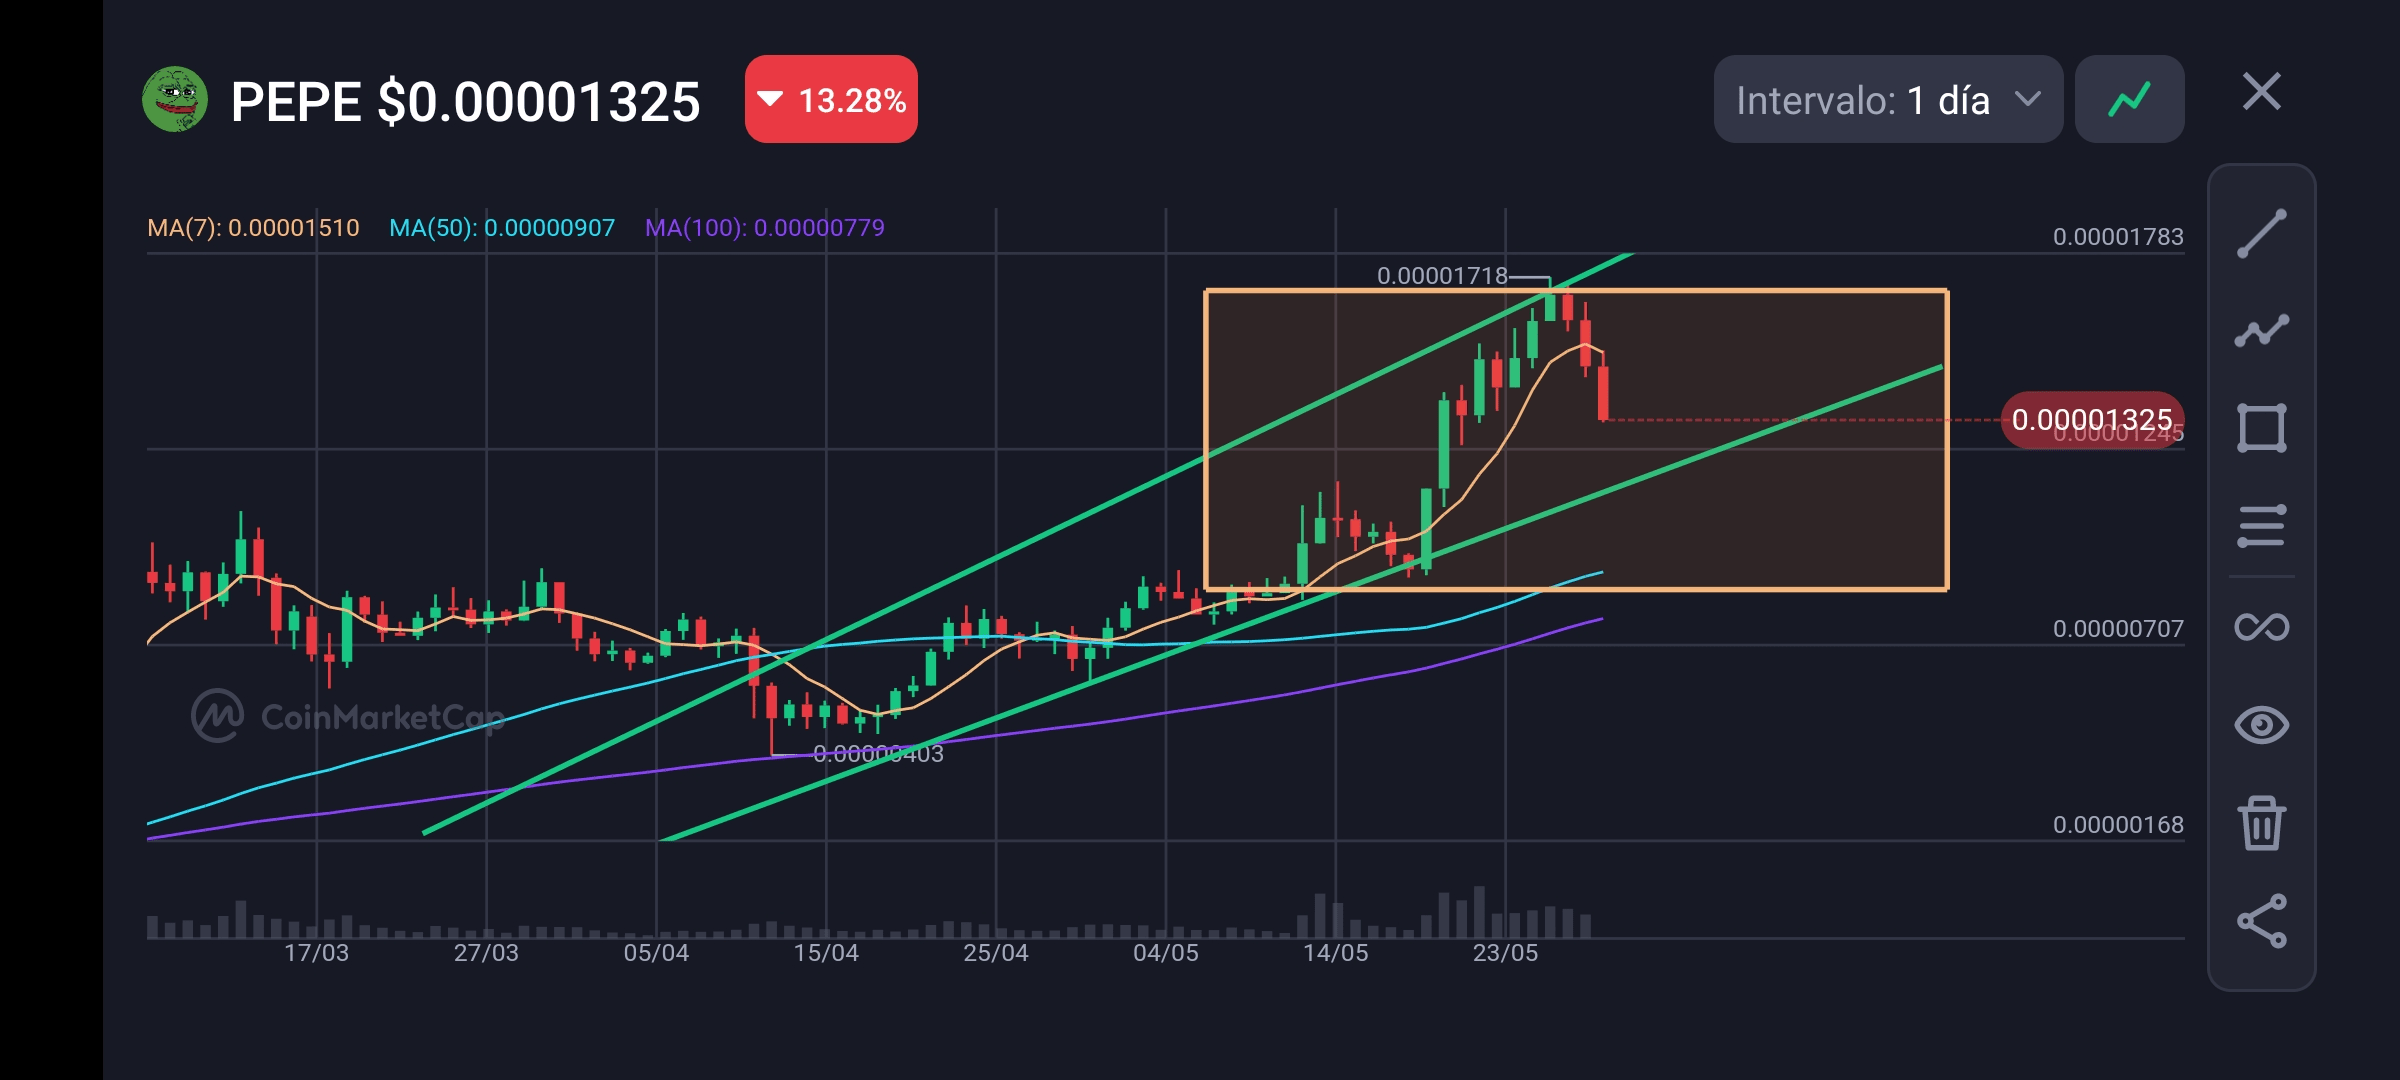
In the latest chart of the PEPE asset, we see that the current price is $0.00001325, with a significant drop of 13.28%. Yesterday, we predicted a possible correction in the orange rectangle range between $0.00001209 and $0.00001718. Currently, the price is at the bottom of this range, indicating that the correction is underway.
The chart shows that the 7-day moving average (MA7) is $0.00001510, the 50-day moving average (MA50) is $0.00000907, and the 100-day moving average (MA100) is $0.00000779. These moving averages indicate an uptrend in the medium and long term, although the current price is below the MA7, confirming the short-term correction.
Furthermore, the 30-day chart shows an increase of 90.61% and an increase of 322% in the last 90 days, reflecting a strong upward trend in the long term. However, the recent drop could be a consolidation or a correction before a new bullish momentum.
In summary, although a correction is underway, the medium and long-term trends remain positive. It is crucial to monitor the support at $0.00001209 to assess whether the price can hold or is heading for a deeper correction.
---
### Analysis of PEPE Asset
#### English
In the most recent chart of the PEPE asset, the current price is $0.00001325, with a significant drop of 13.28%. Yesterday, we predicted a possible correction within the range of the orange rectangle, fluctuating between $0.00001209 and $0.00001718. Currently, the price is at the lower end of this range, indicating that the correction is ongoing.
The chart shows that the 7-day moving average (MA7) is $0.00001510, the 50-day moving average (MA50) is $0.00000907, and the 100-day moving average (MA100) is $0.00000779. These moving averages indicate an upward trend in the medium and long term, although the current price is below the MA7, confirming the short-term correction.
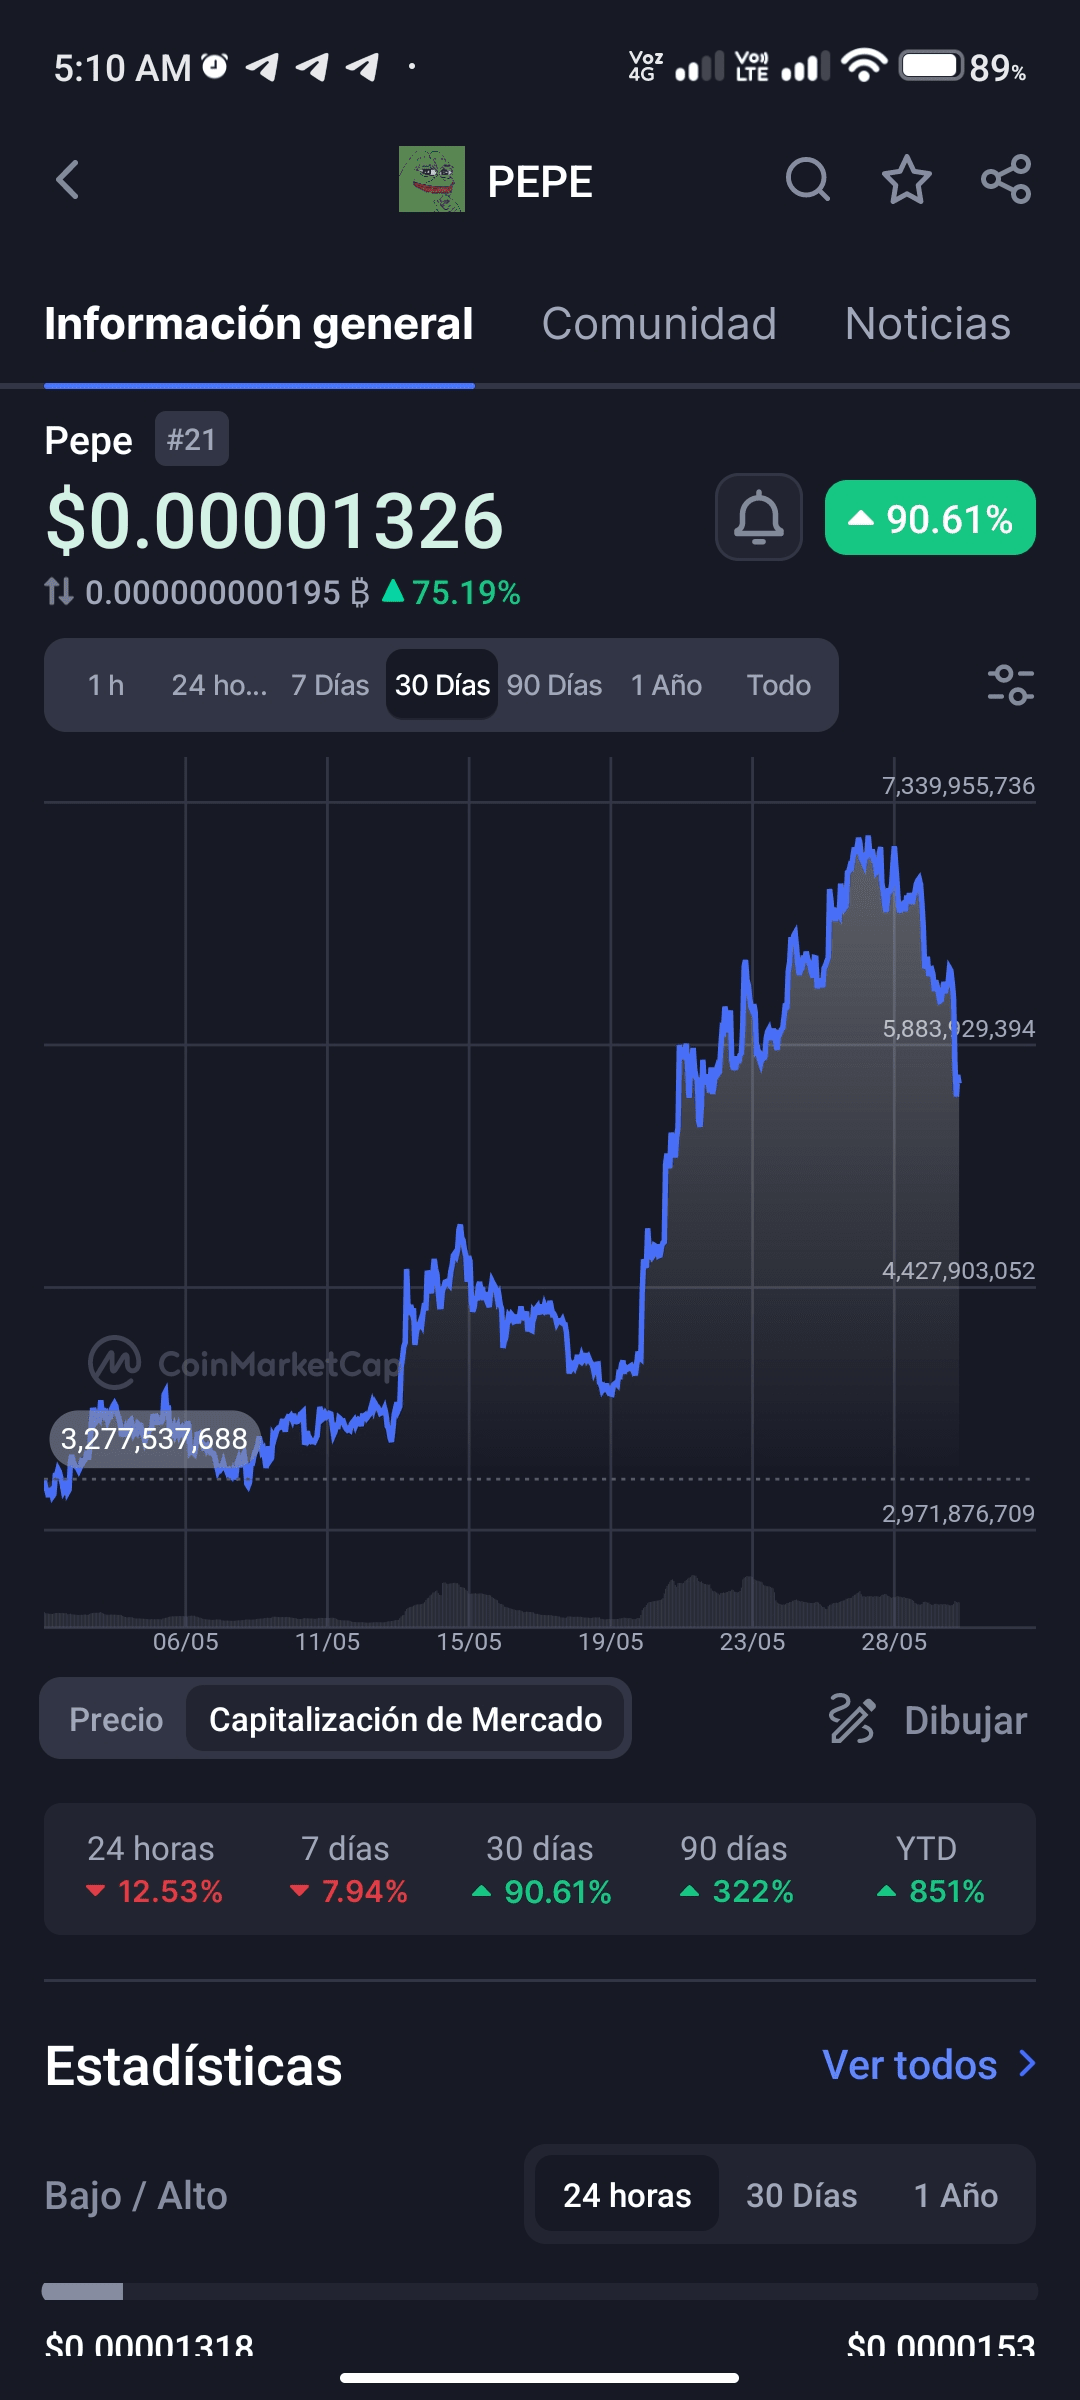
Additionally, the 30-day chart shows a 90.61% increase and a 322% rise in the last 90 days, reflecting a strong long-term uptrend. However, the recent drop might be a consolidation or a correction before a new upward momentum.
In summary, although there is an ongoing correction, the medium and long-term trends remain positive. It is crucial to monitor the support at $0.00001209 to evaluate if the price can hold or if it is heading for a deeper correction.