Dogecoin (DOGE) growth has slowed, but momentum persists
Dogecoin (DOGE) price broke out of a bullish pattern a week ago, but since then the upward momentum has been fading amid bearish market signals
Let's see if Dogecoin will be able to develop an uptrend or if the bullish momentum will finally fade, leaving the coin at the mercy of sellers
Investors show optimism
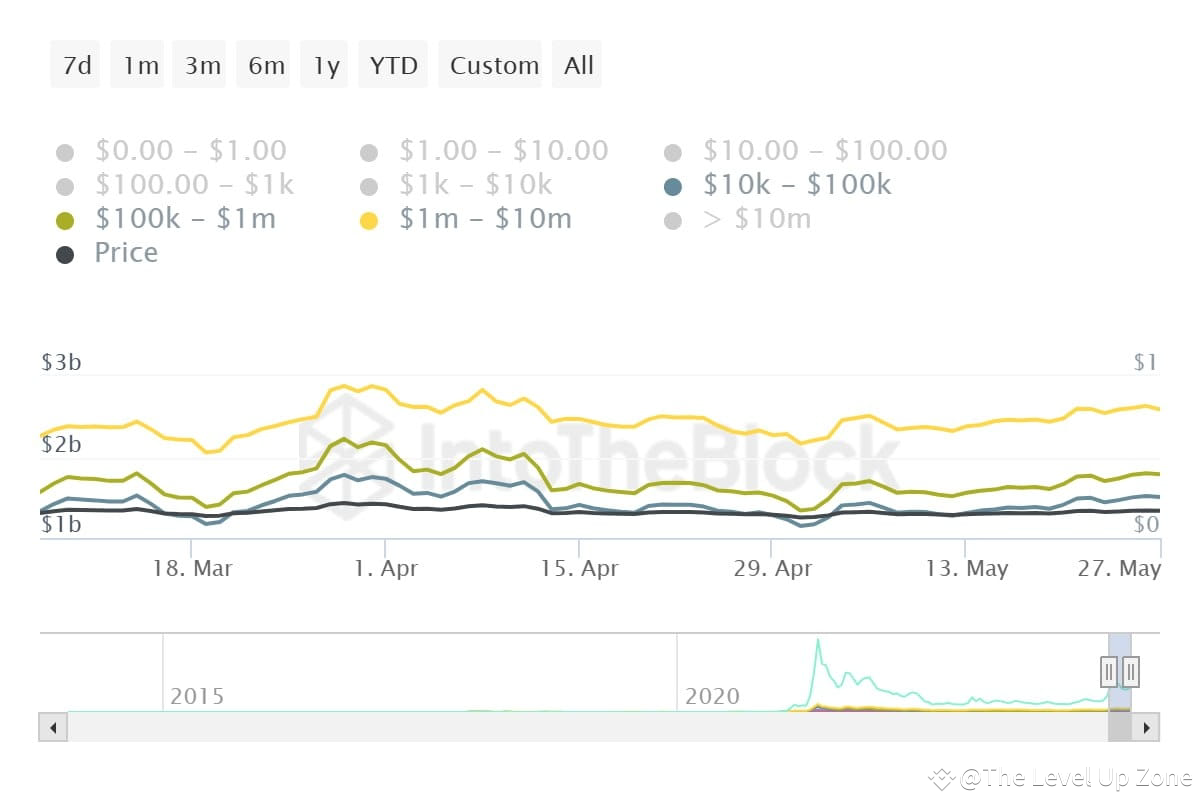
DOGE holders support the popular memcoin with their behavior. Since the beginning of the month, large investors have been steadily increasing their investments in Dogecoin. The total value of coins at addresses storing from $10,000 to $10 million in DOGE has increased by more than $1.1 billion.
This indicates that investors are optimistic and preparing for a rally. The actions of whales usually have a big impact on the price of Dogecoin, and this time too, they may give it a direction.
Technical indicators are also giving bullish signals. For example, the Moving Average Convergence Divergence (MACD) metric, which reflects the relationship between the two moving averages of the asset price, still supports the bullish crossover formed three weeks ago. The histogram formed a double top as the bullish bias weakened several times. Nevertheless, the overall indicator signal is still bullish.
Dogecoin (DOGE) price broke out of a bullish pattern a week ago, but since then the upward momentum has been fading amid bearish market signals
Let's see if Dogecoin will be able to develop an uptrend or if the bullish momentum will finally fade, leaving the coin at the mercy of sellers
Investors show optimism
DOGE holders support the popular memcoin with their behavior. Since the beginning of the month, large investors have been steadily increasing their investments in Dogecoin. The total value of coins at addresses storing from $10,000 to $10 million in DOGE has increased by more than $1.1 billion.
This indicates that investors are optimistic and preparing for a rally. The actions of whales usually have a big impact on the price of Dogecoin, and this time too, they may give it a direction.
Technical indicators are also giving bullish signals. For example, the Moving Average Convergence Divergence (MACD) metric, which reflects the relationship between the two moving averages of the asset price, still supports the bullish crossover formed three weeks ago. The histogram formed a double top as the bullish bias weakened several times. Nevertheless, the overall indicator signal is still bullish.