
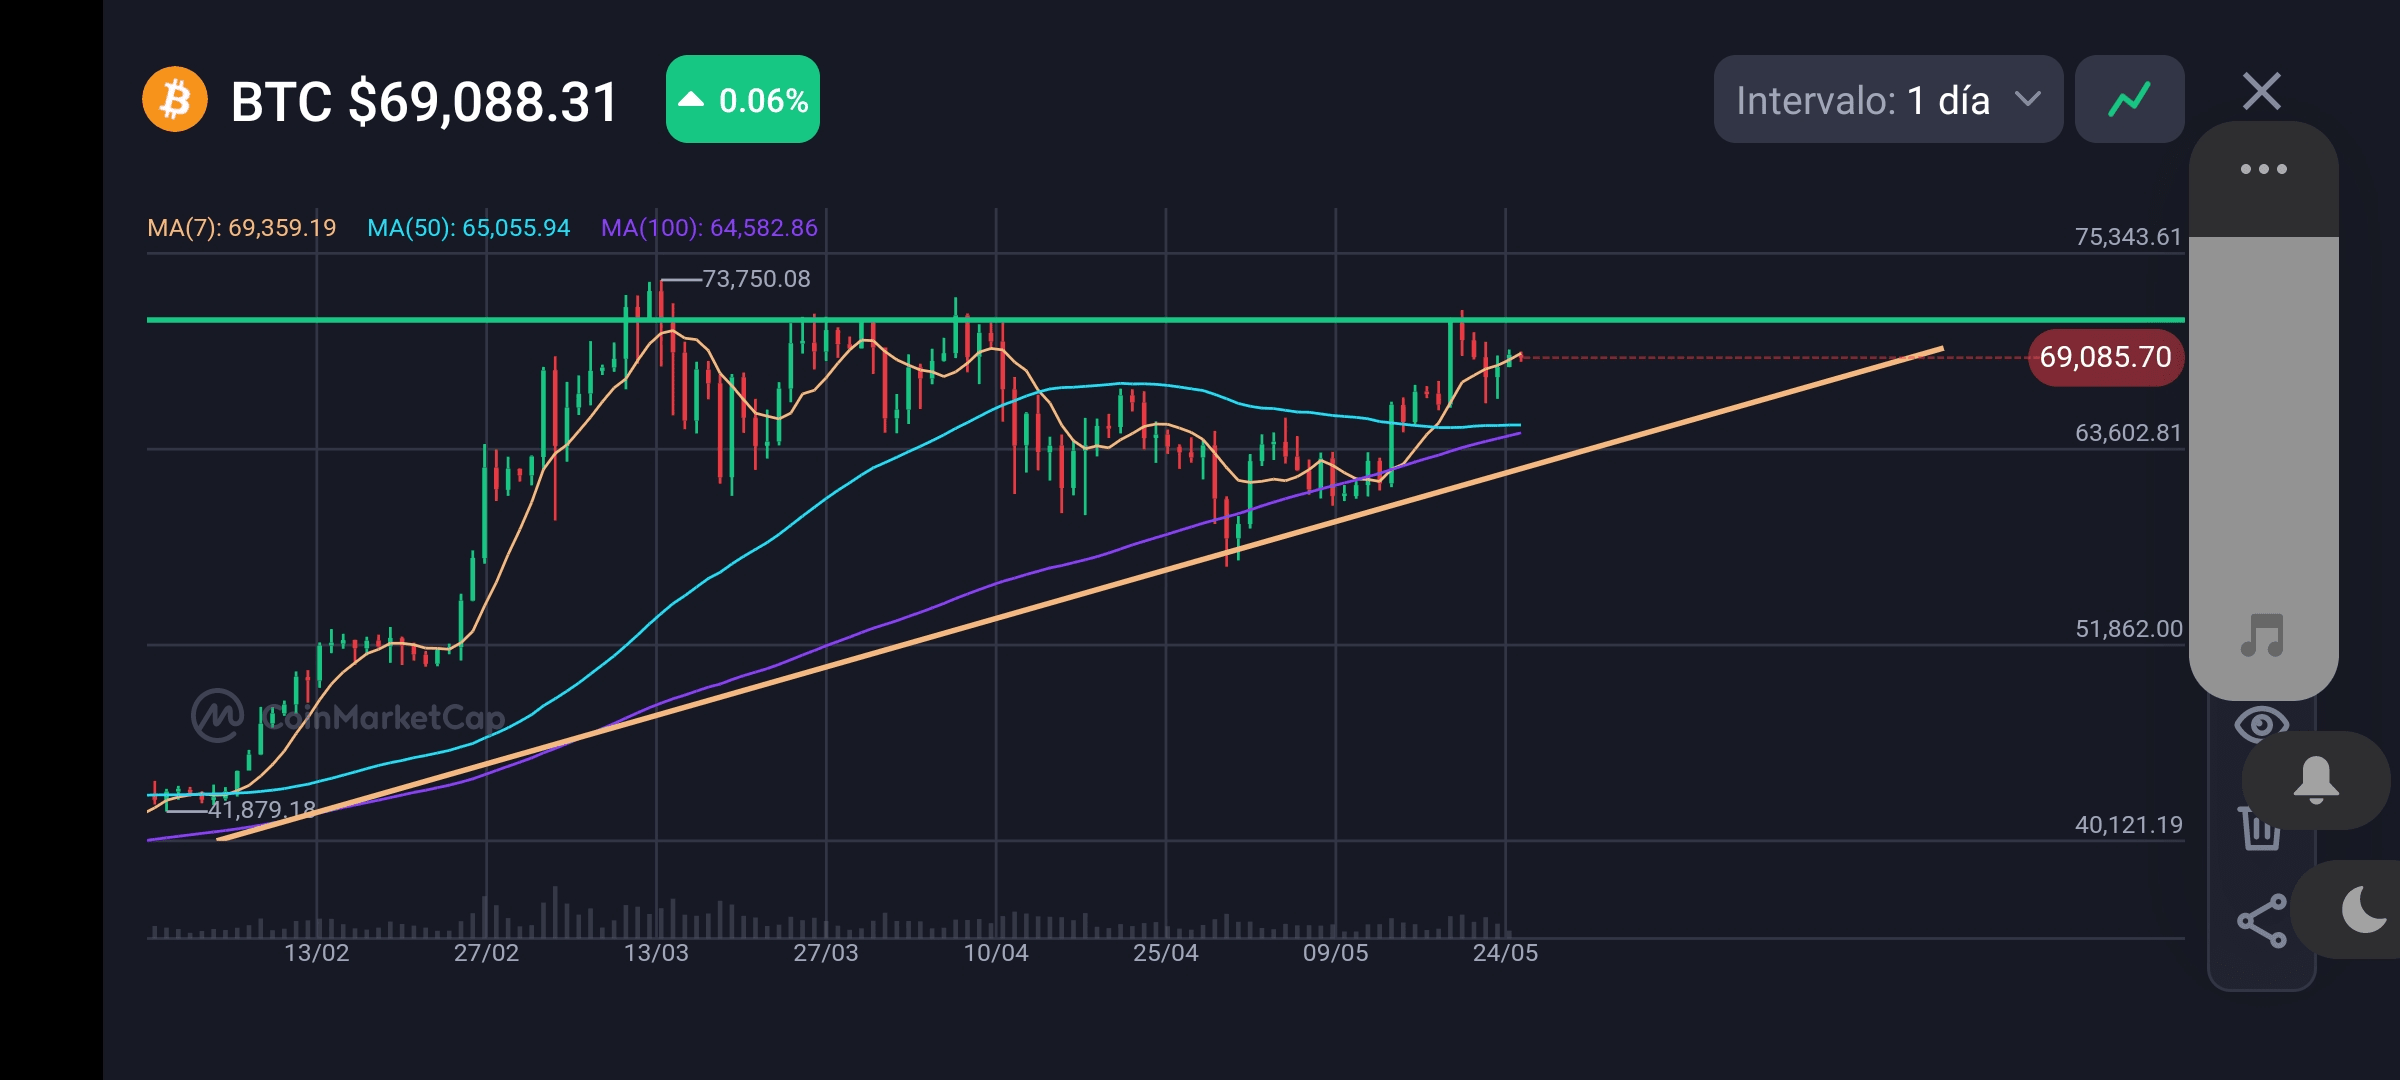
The chart shows the price of Bitcoin (BTC) with various moving averages and support and resistance lines. Here are some key points from the analysis:
1. Current Price: The price of Bitcoin is at $69,088.31.
2. Moving Averages:
- MA(7): The 7-day moving average is at $69,359.19, just above the current price.
- MA(50): The 50-day moving average is at $65,055.94.
- MA(100): The 100-day moving average is at $64,582.86.
3. Support and Resistance Lines:
- Horizontal Resistance: Around $73,750.08.
- Ascending Trend Line: Since mid-February, the chart has shown a clear ascending trend line, acting as dynamic support.
4. Interpretation of the Chart:
- Ascending Support: The ascending trend line suggests that the price has been rising steadily since mid-February.
- Horizontal Resistance: The resistance at around $73,750.08 is a critical level that the price needs to overcome to continue higher.
- Moving Average Convergence: The 7-day moving average is just above the current price, which can act as immediate resistance. The 50-day and 100-day moving averages are below the current price, acting as additional supports.
5. Volatility and Consolidation:
- The price seems to be consolidating just below the mentioned resistance, which could indicate accumulation before a possible significant move.
Conclusion: The chart shows a bullish structure with support at the ascending trend line and resistance at $73,750.08. To confirm a bullish continuation, the price would need to break and sustain above the key resistance. On the other hand, if the price fails to overcome this resistance and breaks the ascending trend line, it could signal a correction. It is important to monitor the upcoming candles and see how they interact with these key zones.