

✔️Like + subscribe if you want to receive crypto box $BNB in the next post!🎁🎁 🎁 🎁
BTC/USDT Analysis: Neutral Signals and Possible Scenarios
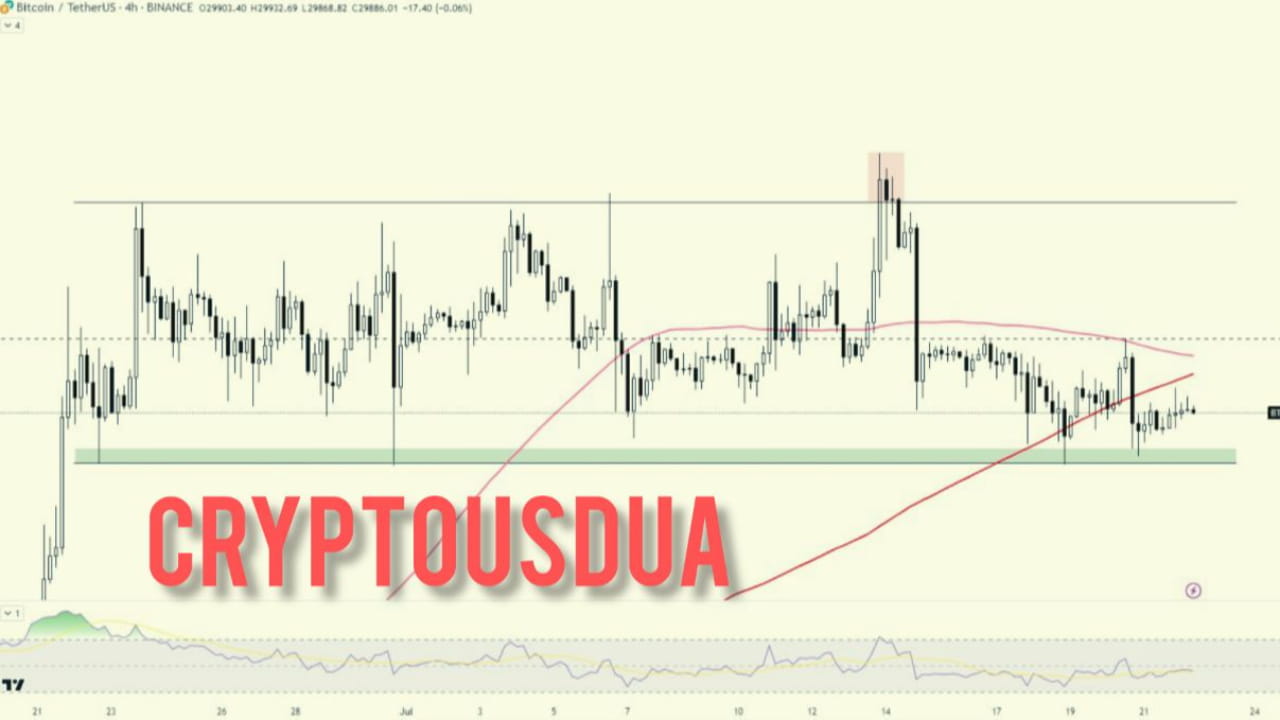
Bitcoin (BTC) continues to hold above the horizontal support on the BTC/USDT chart and is currently trading below the 200-day moving average (MA 200). Technical analysis points to neutral signals that require more detailed consideration to make meaningful decisions in the market.
It is important to note that a move above the 200 MA with good volume will be considered a sign of further consolidation. This may mean that the market continues to be in a sideways trend, and Bitcoin remains relatively stable at this level.
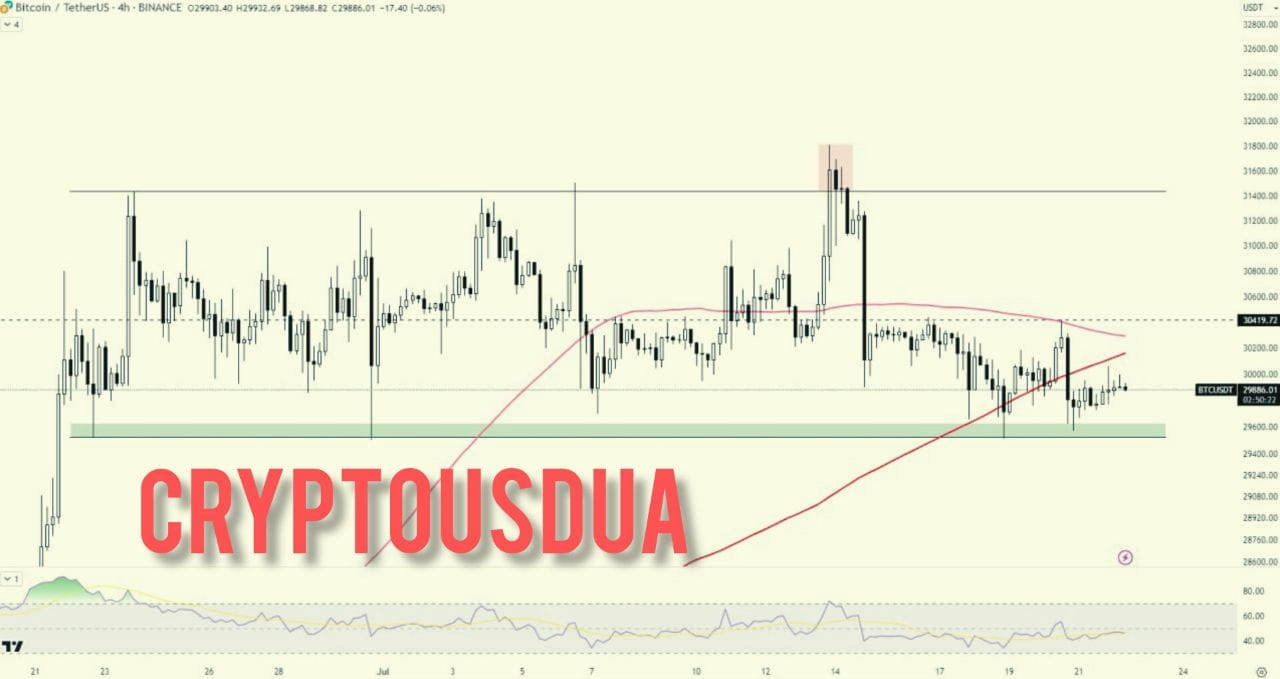
On the other hand, a sustained breakout of the marked horizontal support could be a sign of a correction in the market. This could lead to further declines in the price of Bitcoin and traders should monitor this level closely.
The relative strength indicator (RSI) is in the middle zone, indicating neutral signals. This may indicate that the market is in a state of equilibrium and there is no obvious overbought or oversold condition present at the moment.
However, the cryptocurrency market is characterized by a high degree of volatility, and any external factors can affect its movement. Traders and investors should be careful and informed in their decisions, considering the risks associated with trading cryptocurrencies.
It is important to monitor price dynamics and trading volume on the $BTC /USDT market, as well as take into account fundamental factors that may affect the cryptocurrency market as a whole. As always, smart and informed decision making will help you achieve more successful results in Bitcoin trading.