

✔️Like + subscribe if you want to get a $BNB crypto box in the next post!🎁🎁 🎁 🎁
Dow Jones Index Analysis: Potential Bullish Market Move
The Dow Jones Industrial Average (Dow Jones) is one of the leading stock indices in the United States, which includes shares of the 30 largest companies in various industries. Let's look at the technical analysis of the Dow Jones index based on the data provided.
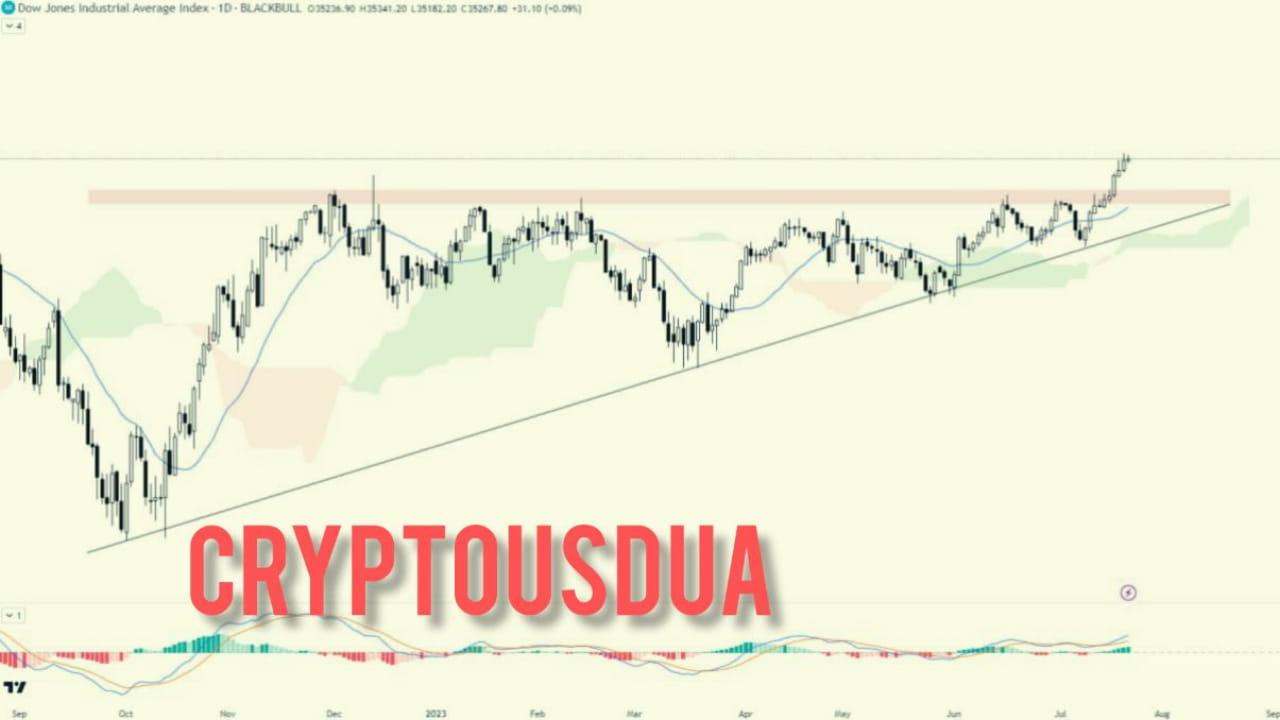
At the moment, the Dow Jones index has demonstrated a breakout of the ascending triangle with the closing of several candles above it. This could signal the possible start of a bullish movement in the market.
Technical indicators also support a possible bullish move. The Ichimoku cloud indicates a bullish trend, and the MACD crossover is gaining bullish momentum. This may confirm the likelihood of growth in the Dow Jones index.
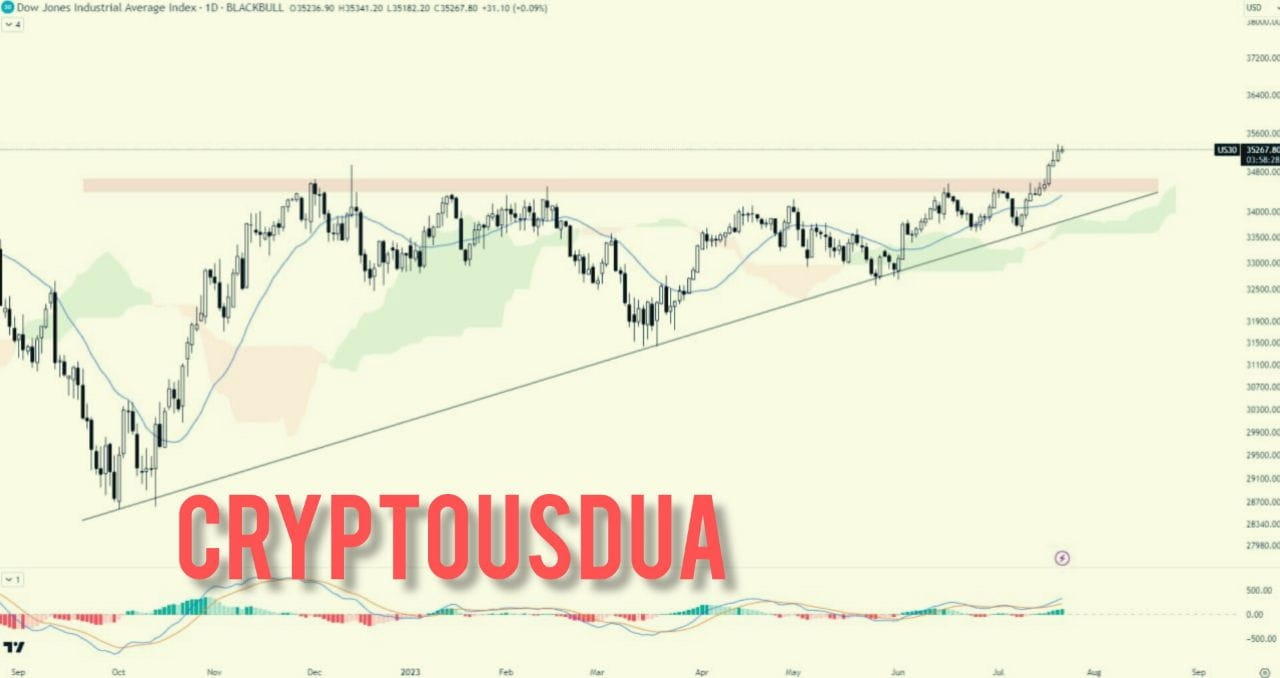
In addition, the 21-day moving average (MA 21) is acting as support, which can support the index and contribute to its further growth.
Investors and traders pay special attention to the future movement of the Dow Jones index in order to make informed decisions in the market. It is important to note that the stock market always involves risks and all investment decisions should be based on analysis and caution.
Let us remind you that technical analysis is one of the tools for predicting market movements, but you should also take into account fundamental aspects and external factors that can affect the stock market. Investors should always be prepared to adapt to changing conditions and make informed decisions based on their financial goals and strategies.