
While most cryptocurrency market observers remain focused on Bitcoin’s continued struggle at $31,000, Ethereum has recently closed above the psychologically important $2,000 mark for the first time in weeks. Now poised to close lower for four consecutive days, let’s take an evidence-based approach to determine whether Ether’s four-day losing streak is historically bullish or bearish. Let’s take a deeper look!
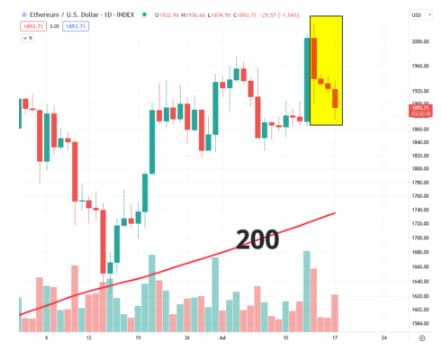
Ethereum closes above $2,000 before pulling back
After closing at an impressive multi-week high on July 13th and moving back above $2,000, Ethereum has pulled back for four consecutive trading days, which is one of the conditions we will immediately test. To better add context to our test, we will also add two conditions requiring that [1] Ethereum is above its 200ma, and [2] its 200ma is rising. Why? Both the 200ma and its slope act as simple filters to help determine market conditions. For example, Ethereum's recent four-day pullback occurred in the context of an improving market, where Ethereum was above its rising 200-day moving average. If the current four-day pullback occurred in a downtrending market system, we would require ETH to fall below its falling 200-day moving average.
What does a pullback in Ethereum do to its price? To find out, we will look at all signals since inception and compare them to a simple “buy and hold” approach. This will give us a baseline to better understand today’s test results.
Four days down vs. buy and hold
The holding time chart below shows historical results for Ethereum's current technical setup at the top, and a simple "buy and hold" approach at the bottom. In other words, we will show hypothetical results using different holding times only when Ethereum closes lower and above its rising 200-day moving average for four consecutive days. Assuming unconditional purchase of ETHUSD and exit after n days, the bottom result will serve as the baseline.
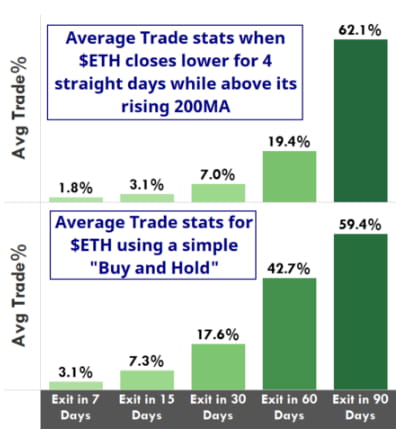
While both methods show positive average trading results in every exit we tested between seven and 90 days, our baseline Buy & Hold actually outperforms the current technical setup of the four-day decline. The only exception is the Exit Within 90 Days, where the current setup is slightly above the historical average Buy & Hold trade, beating it by 62.1% to 59.4%.
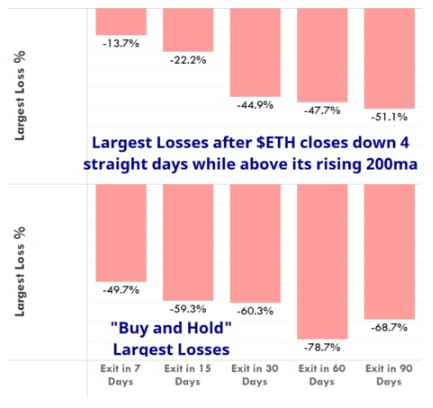
While the average trade statistic is still important, it doesn’t always tell the full story. When comparing the maximum hypothetical losses of the two approaches using the same conditions described previously, note that the maximum loss (i.e., worst trade) for the current four-day down setup is much lower than the simple “buy and hold” approach. This maximum loss comparison suggests that while the current setup may not beat “buy and hold” in terms of average trades, Ethereum’s current exposure may be lower than usual – something most experienced traders will appreciate.
While the past is not predictive of the future, based on our analysis, Ethereum looks poised for potential upside, mostly in line with typical “buy and hold” expectations. In other words, it’s not too exciting right now, and clearly lacks any meaningful upside. That said, the risk also appears lower than usual relative to the “buy and hold” maximum loss statistic. Traders take note. Ethereum may now offer typical returns based on its current technical setup, but with lower overall risk exposure.