
Original author: Sam Andrew
Original translation: TechFlow
If we look at Ethereum from a corporate perspective, what kind of company is it?
In the second quarter of 2023, there were 340,000 daily active users, gross profit equivalent to US$700 million (453,000 ETH), gross profit margin of 84%, and net income equivalent to US$420 million (227,000 ETH), a month-on-month increase of 187%.
Under the strong network effect, the ETH destruction rate has accelerated from 0.3% to 0.8%. With the successful implementation of the Shapella upgrade and no ETH sell-off, the indicators of the Ethereum ecosystem (including L2) are growing across the board.
This article is an unofficial data report on Ethereum for the second quarter of 2023. It mainly analyzes and comments on the following contents, giving you a comprehensive understanding of Ethereum's operations and financial situation from a data level.
Ethereum’s operational metrics;
Ethereum ecosystem (integration of L2 metrics);
Ethereum’s profit and loss statement;
Main impact.
2023 Q2 Operational Metrics
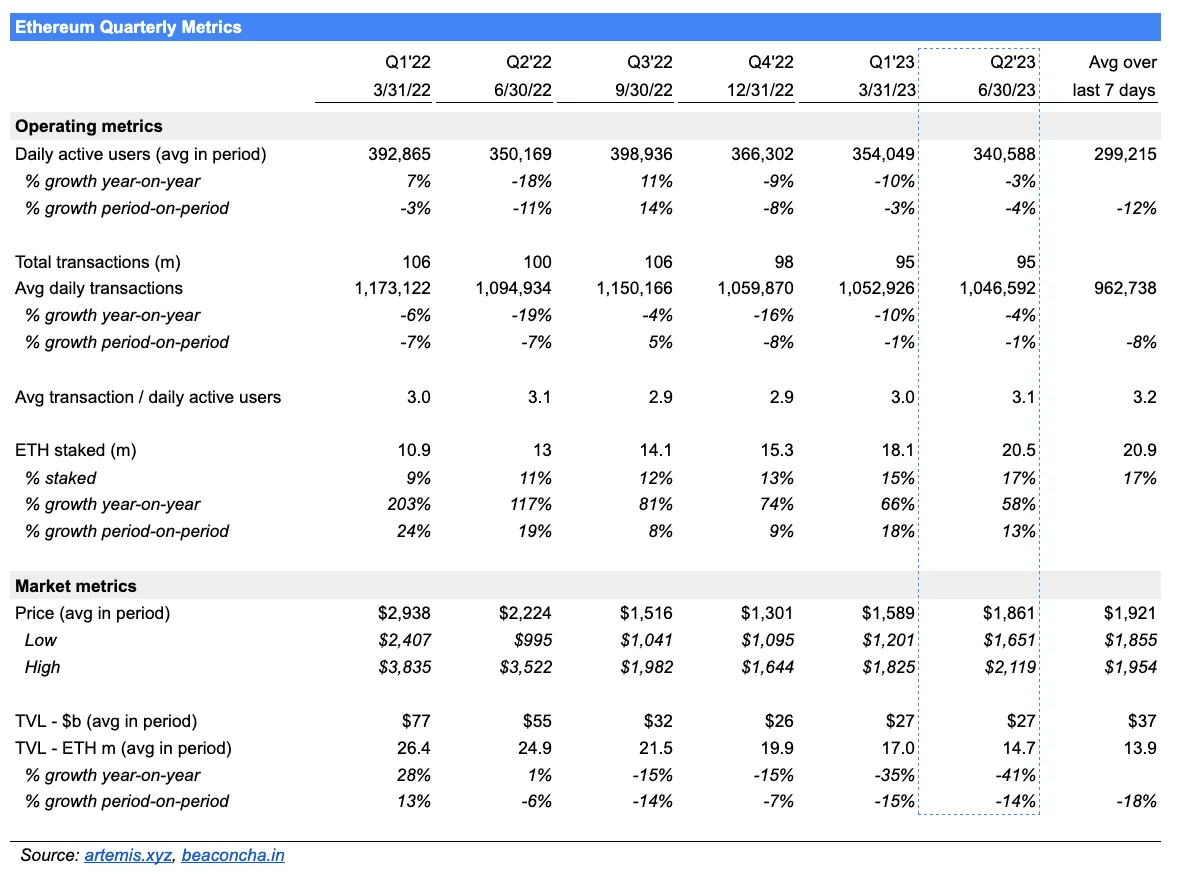
Daily Active Users: Q2 DAU was 340,588, down 3% year-over-year, an improvement from about 10% in Q1 2023 and Q4 2022. In the first few days of July, average DAU was down 12% compared to Q2 2023. A decline in DAU means that fewer people are using Ethereum every day.
Average Daily Transactions: Average daily transactions were 1,046,592, down 4% year-over-year. The rate of decline has slowed compared to the previous two quarters. Average daily transactions were almost stable at -1%. The decline in average daily transactions was due to a decrease in daily active users. Average daily transactions were trending downward in the first week of July.
Staked ETH: Staked ETH accounts for 17% of total supply. Staked ETH increased 58% year-over-year and 13% month-over-month.
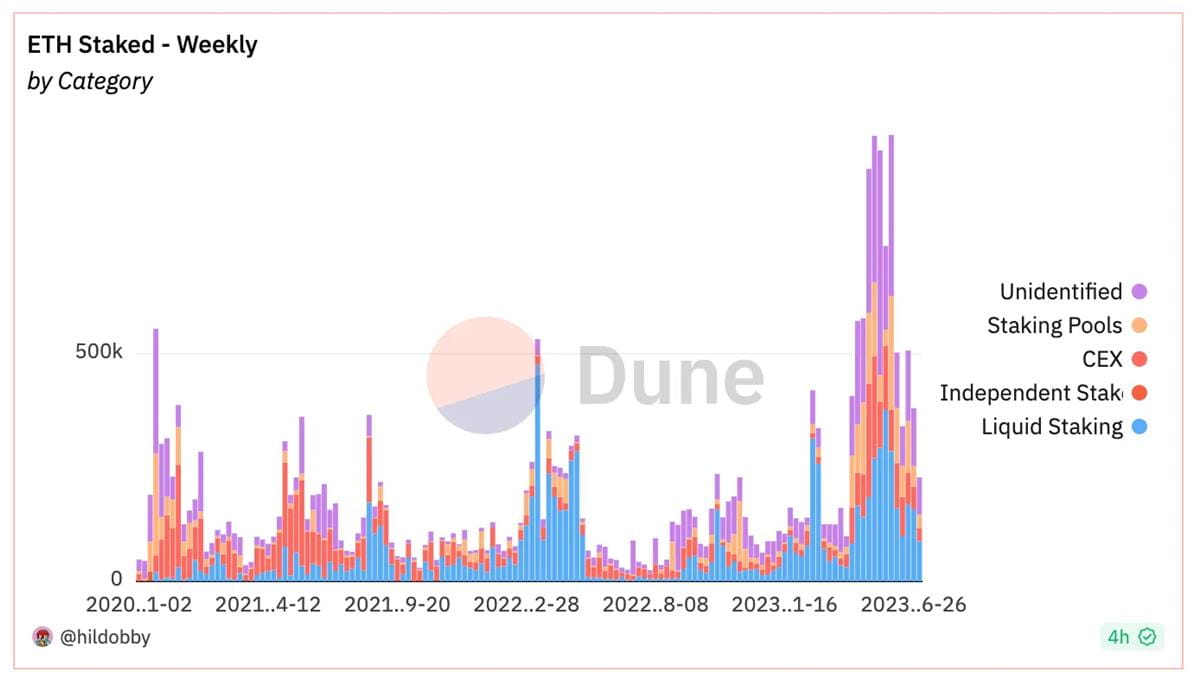
The Shapella upgrade was successfully executed on April 12, 2023. Unlike what some feared, there was no sell-off in ETH following Shapella.
The amount of staked ETH continues to grow. But the rate of growth has slowed. The amount of incremental ETH per week has dropped before and after Shapella (see chart below). About 1.8 million ETH was staked in April, 4 million ETH was staked in May, and 2.2 million ETH was staked in June.
Price: With an average price of $1,861 in Q2, ETH is up 55% year-to-date and 4% quarter-to-quarter. ETH was volatile during the quarter. ETH fell 22% from the highest point to the lowest point during the quarter, and then rebounded.
Total Value Locked (TVL): ETH’s TVL fell 41% year-over-year, and the downward trend is still worsening. TVL is in line with the decline in Q1 2023, which fell 14%.
Ethereum Ecosystem
The health of Ethereum is increasingly being assessed by the health of the Ethereum ecosystem. The Ethereum ecosystem includes its second-layer scaling solutions. Arbitrum, Optimism, Polygon zkEVM, StarkNet, and zkSync Era are used to determine the health of Ethereum's second layer. Activity has migrated to the second layer, which provides cheaper and faster transaction settlement. Assessing the Ethereum ecosystem, including activity on both Ethereum's base layer and the second layer, presents a different picture. Daily active users (DAU) and average daily transactions in the Ethereum ecosystem are growing.
Ethereum’s daily active user (DAU) growth has been stagnant since 2021. Over the past year, the number of DAUs in the Ethereum ecosystem has grown from 400,000 to around 800,000 (see the chart above). However, the growth of DAUs in the Ethereum ecosystem does not necessarily mean that more people are interacting in the Ethereum ecosystem. A more likely explanation is that a portion of Ethereum’s DAUs have also become Ethereum’s second-layer DAUs.
Data for Polygon PoS is not included in the Ethereum ecosystem. Polygon PoS is a sidechain of Ethereum. Users of Polygon PoS may gradually migrate to the Polygon zkEVM chain. Polygon's focus is on the zkEVM chain. This migration may be beneficial to the Ethereum ecosystem. There are 360,000 DAUs on Polygon PoS, which exceeds Ethereum's 300,000 DAUs. Ethereum's DAUs will not double after the migration. A considerable number of Polygon PoS's DAUs are likely to be Ethereum's DAUs as well.
With the advent of Layer 2, the DAUs in the Ethereum ecosystem are performing more and more transactions. Ethereum’s average daily transaction count has been hovering around 1 million since the second half of 2020. Ethereum’s transactions are limited to about 1 million per day. Layer 2 adds a total of 2 million transactions per day. The total number of transactions in the Ethereum ecosystem has almost quadrupled in the past year (see chart below). For every 1 transaction on Ethereum, there are 2 transactions on Layer 2.
Polygon’s PoS chain averages 2.4 million transactions per day. If these transactions were migrated to the Polygon zkEVM chain or other Ethereum second layers, it would nearly double the number of daily transactions in the Ethereum ecosystem.
The average daily transaction volume of the entire Ethereum ecosystem reached 3 million transactions in the second quarter of 2023, up from 2 million transactions in the first quarter of 2023. The quarter-on-quarter growth rate of the average daily transaction volume of the entire Ethereum ecosystem accelerated from 17% in the first quarter of 2023 to 50%. In the second quarter of 23, the average daily transaction volume of the Ethereum ecosystem increased by 139% year-on-year (see the figure below).
The average daily transaction volume occurring on the Ethereum ecosystem is 3 million, which accounts for 16% of the total daily transactions of programmable blockchains other than Solana (see figure below). Solana’s transaction data is not directly comparable to other chains. Solana performs 20 million transactions per day. It is arguably one of the highest performing blockchains. However, due to its very high transaction throughput and low fees, a large portion of these transactions are junk transactions.
If Polygon PoS is taken into account, the Ethereum ecosystem’s share of total transaction volume doubles to about 30%. Without taking BNB and Tron into account, the Ethereum ecosystem has a 60% market share in daily transaction volume. BNB and Tron are very different from the other blockchains in this group and are more centralized.
Ethereum Profit and Loss Statement
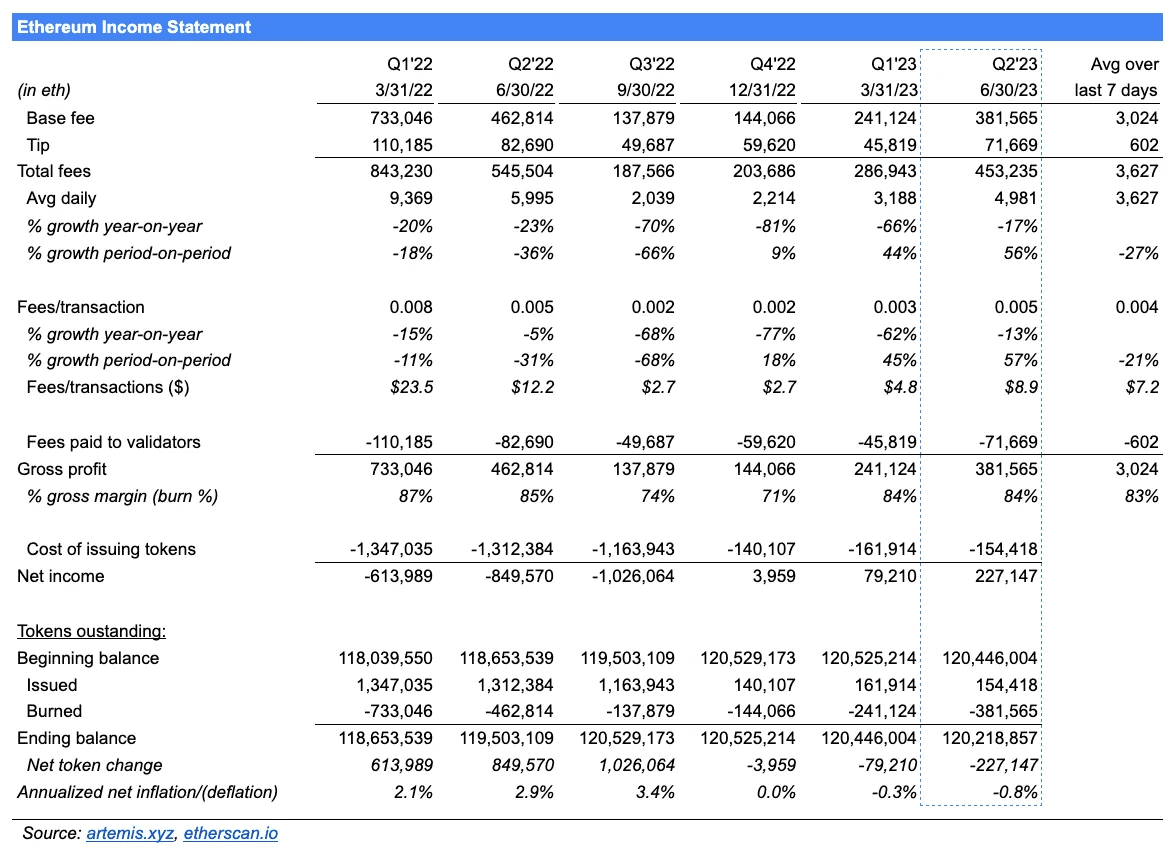
Total Fees: Total fees in Q2 were 453,235 ETH ($843,470,335), down 17% year-over-year, with transaction fees down 13% and volume down 4%. Total fees increased 56% quarter-over-quarter. The quarter-over-quarter increase was due to a 57% increase in fees per transaction and a 1% decrease in volume. Total fees represent the total cost paid by users to process all transactions posted to Ethereum. In traditional financial terms, this is the total revenue generated by the "company".
Gross Profit: Gross profit was 381,565 ETH ($710,092,465), with a gross profit margin of 84% during the quarter, meaning 84% of total fees were burned. Gross profit is often referred to as "network revenue". It captures a portion of total fees accrued to token holders. Gross profit and total fees increased year-over-year.
Daily fees and gross profit (i.e. revenue) tripled in May (see chart below). This growth was driven by the meme coin craze driven by Pepe. Subsequently, fees and gross profit (i.e. revenue) returned to normal levels. Unless there is another one-time fee driver, fees should decline month-over-month in Q3 2022. Average daily fees fell 27% in the first week of July compared to average daily fees in Q2 2023.
Net Revenue: Net revenue for Q3 was 227,147 ETH ($422,720,567), up nearly 3x QoQ. The increase in net revenue was due to a 56% QoQ increase in total fees. The QoQ increase in net revenue demonstrates Ethereum’s operating leverage. Ethereum’s costs do not grow as total fees grow. Ethereum’s costs do not grow as total fees grow. Total fees grew 56% QoQ, but Ethereum’s fixed costs (the cost of issuing tokens to validators) fell 5% QoQ. As a result, net revenue grew 187% QoQ.
Ethereum has been profitable every quarter since the introduction of PoS. The significant improvement in profits is due to a 90% reduction in the cost of issuing tokens.
Outgoing Tokens: Ethereum destroyed more tokens than it issued in Q2 2023. Outgoing tokens decreased from 120.45 million to 120.22 million. Net issuance (calculated as annualized net issuance divided by opening balance) decreased from a low single-digit percentage to -0.8%. Ethereum increased its outgoing tokens by about 3% in 2022. It has now reduced its circulating tokens by about 1%.
How to read Ethereum's profit and loss statement?
Total Fee represents the fee paid by users for posting their transactions on the Ethereum blockchain. Total Fee includes Base Fee and Tip. Tip is the pass-through fee, which is paid to the validator. Note that the Tip item is the same number as the Fee item paid to the validator. It is a variable cost. It grows in proportion to usage. Users pay Tip to have their transactions processed first.
The base fee is the fee users pay to process their transactions. Note that the base fee number is the same as the gross profit number. Gross profit indicates how much money (denominated in ETH) the Ethereum blockchain earns for the transactions it processes. It is sometimes referred to as "network revenue." The gross profit rate indicates how much of the total Ethereum fees are destroyed. Tokens that are destroyed are removed from circulation. This is similar to a share buyback.
The cost of issuing tokens is the fee paid to validators to keep the network secure. This is a fixed cost. It does not grow in proportion to usage.
Net revenue is the difference between base fees (i.e. gross profit) and newly issued tokens. Ethereum’s net revenue in Q2 2023 was 227,147 ETH, meaning it collected 227,147 more in base fees than it issued. Therefore, Ethereum had 227,147 fewer tokens to be issued.
The more net income Ethereum generates, the more ETH is destroyed, and the fewer tokens are issued. The fewer tokens are issued, the more valuable each token is, all else being equal.
in conclusion
1. The surge in total expenses in the second quarter was short-lived
The Q2 surge in total fees and resulting token burns was short-lived. It was driven by a one-time event, the meme coin frenzy. The surge lasted for about two weeks. Q3 2023 is expected to be poorer quarter-over-quarter.
2. Focus on L2 solutions
Operational metrics for the Ethereum ecosystem, including layer 2 scaling solutions, show a healthy growing network. In contrast, Ethereum’s operational metrics alone show a stagnant network. Ethereum’s growth is driven by layer 2 scaling solutions. Their success is critical to Ethereum. The upcoming implementation of EIP-4844 will have a significant impact on layer 2 scaling solutions and Ethereum.
In the short term, the only way to increase fees on Ethereum is through increasing the fees per transaction, i.e. higher gas prices. Currently, Ethereum has a maximum of about 1 million transactions per day. It is believed that second layer transactions will grow significantly. Second layer transactions will be batched as one input to the Ethereum base layer. The cost of one expensive Ethereum transaction will be spread over many second layer transaction fee payers.
3. The growth of the number of staked ETH has slowed down
The amount of staked ETH grew rapidly before and after Shapella was successfully implemented. The slowing growth trend suggests that the amount of staked ETH may not grow as fast as previously expected by more than 50%. To reach a 50% stake ratio, an additional ~40 million ETH needs to be staked. At the current rate of ~1 million additional ETH staked per month, it would take 40 months, or 3 years and 4 months, to reach a 50% stake ratio.
This is not necessarily a bad thing for ETH stakers. The lower the stake ratio, the higher the staking rewards paid to validators, and therefore, the higher the ETH yield. The ETH yield is the sum of stake, yield, and MEV yield, as well as inflation or deflation of the token supply. The most economically attractive scenario is a low stake ratio, so staking yields are high, fees are high, and therefore yields are high. The least economically attractive scenario is the opposite. The economic perspective is not the only parameter that drives the value of ETH. The higher the stake ratio, the higher the security of the blockchain, theoretically leading to higher ETH value.
Slowing growth in ETH staked led to poor performance for Lido and Rocket Pool. During the quarter, LDO and RPL fell 17% and 18% respectively, while ETH was essentially flat. Slowing growth in ETH staked combined with the smaller size of Rocket Pool mini pools meant that there were fewer buyers for RPL.
4. Ethereum’s operational leverage leads to massive destruction
Ethereum’s profitability and burn mechanism is very important. Ethereum went from $22 million of selling pressure per day (at an ETH price of $1,860) to $5 million of buying demand per day, a difference of $28 million. This $28 million change is equivalent to 4.5% of Ethereum’s market cap.
Ethereum’s PoW model has two economic problems. First, Ethereum historically issues 17,000 tokens per day to miners, which equates to an annual dilution rate of 5%. Second, it is estimated that 70% of these tokens are immediately sold to cover expensive mining. At an ETH price of $1,860, issuing tokens to miners and subsequently selling them results in $22 million of selling pressure per day.
The introduction of PoS and the introduction of a burn mechanism turned $22 million of selling pressure per day into $5 million of buying pressure per day. Ethereum is now destroying (i.e. buying back) $5 million worth of tokens per day, whereas it used to sell $22 million worth of ETH tokens per day. The following table outlines the projected profit and loss statement from PoW to PoS.
Most people misunderstand Ethereum's operating leverage. Operating leverage is a traditional financial term used to describe an asset that has profit growth much faster than revenue growth. Profits grow so much because operating costs do not grow, while revenue grows. Technical people generally do not understand operating leverage. Traditional financial investors do not understand cryptocurrencies.
The "Forecast" column in the above chart shows Ethereum's operating leverage. The forecast column assumes a 5x increase in total fees. A 5x increase in fees results in a 9.9x increase in net revenue. Ethereum's fixed operating costs, the cost of issuing tokens to validators, do not increase when total fees increase. The net result is a 9.9x increase in Ethereum's deflation rate. Compared to the current 0.4% deflation rate, Ethereum will reduce the number of tokens to be issued per year when revenue increases 5x. Buying demand will increase 5.2x, from $5 million per day to $28 million.