
Traders often use several common Fibonacci retracement levels to identify potential areas of Fibonacci retracement. The most commonly used levels are:
1. 23.6%: This level is calculated by multiplying the price range (from the start point to the end point of the trend) by 0.236. This level is often used as the first support or resistance area after a trend.
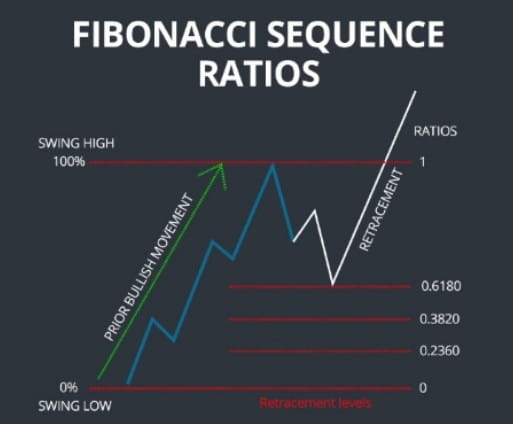
2. 38.2%: This level is calculated by multiplying the price range by 0.382. This level is also often used as a support or resistance area in trends.
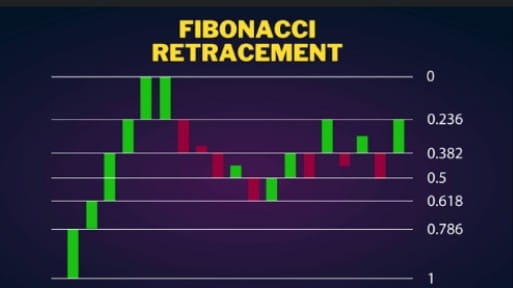
3. 50%: This level is not a true Fibonacci ratio, but because it is the middle of the price range, it is often considered a key level. Price often tests the 50% level before resuming its trend.
4. 61.8%: This level is calculated by multiplying the price range by 0.618. This level is considered a strong support or resistance level in a trend. If the price goes beyond this level, the ongoing trend can be said to be weak.
Apart from that, there are also additional retracement levels such as 78.6% which are often used by some traders.
The golden ratio is a special mathematical ratio which is the ratio of two numbers in the Fibonacci series. The golden ratio is approximately 1.618 or 0.618. This ratio is considered to have a unique beauty and harmony in mathematics and is applied in various fields, including trading.
In Fibonacci retracement, 61.8% (0.618) is often considered the most important golden ratio. This is known as the "golden ratio" or "golden retracement". Some traders believe that the 61.8% Fibonacci retracement level has particular power in determining significant support or resistance in a trend.
However, it is important to remember that the use of Fibonacci retracements and the golden ratio in trading is only a tool and there is no guarantee that prices will always behave according to these levels. It is important to incorporate other analytical tools and consider other factors in making trading decisions.