Hail investors!
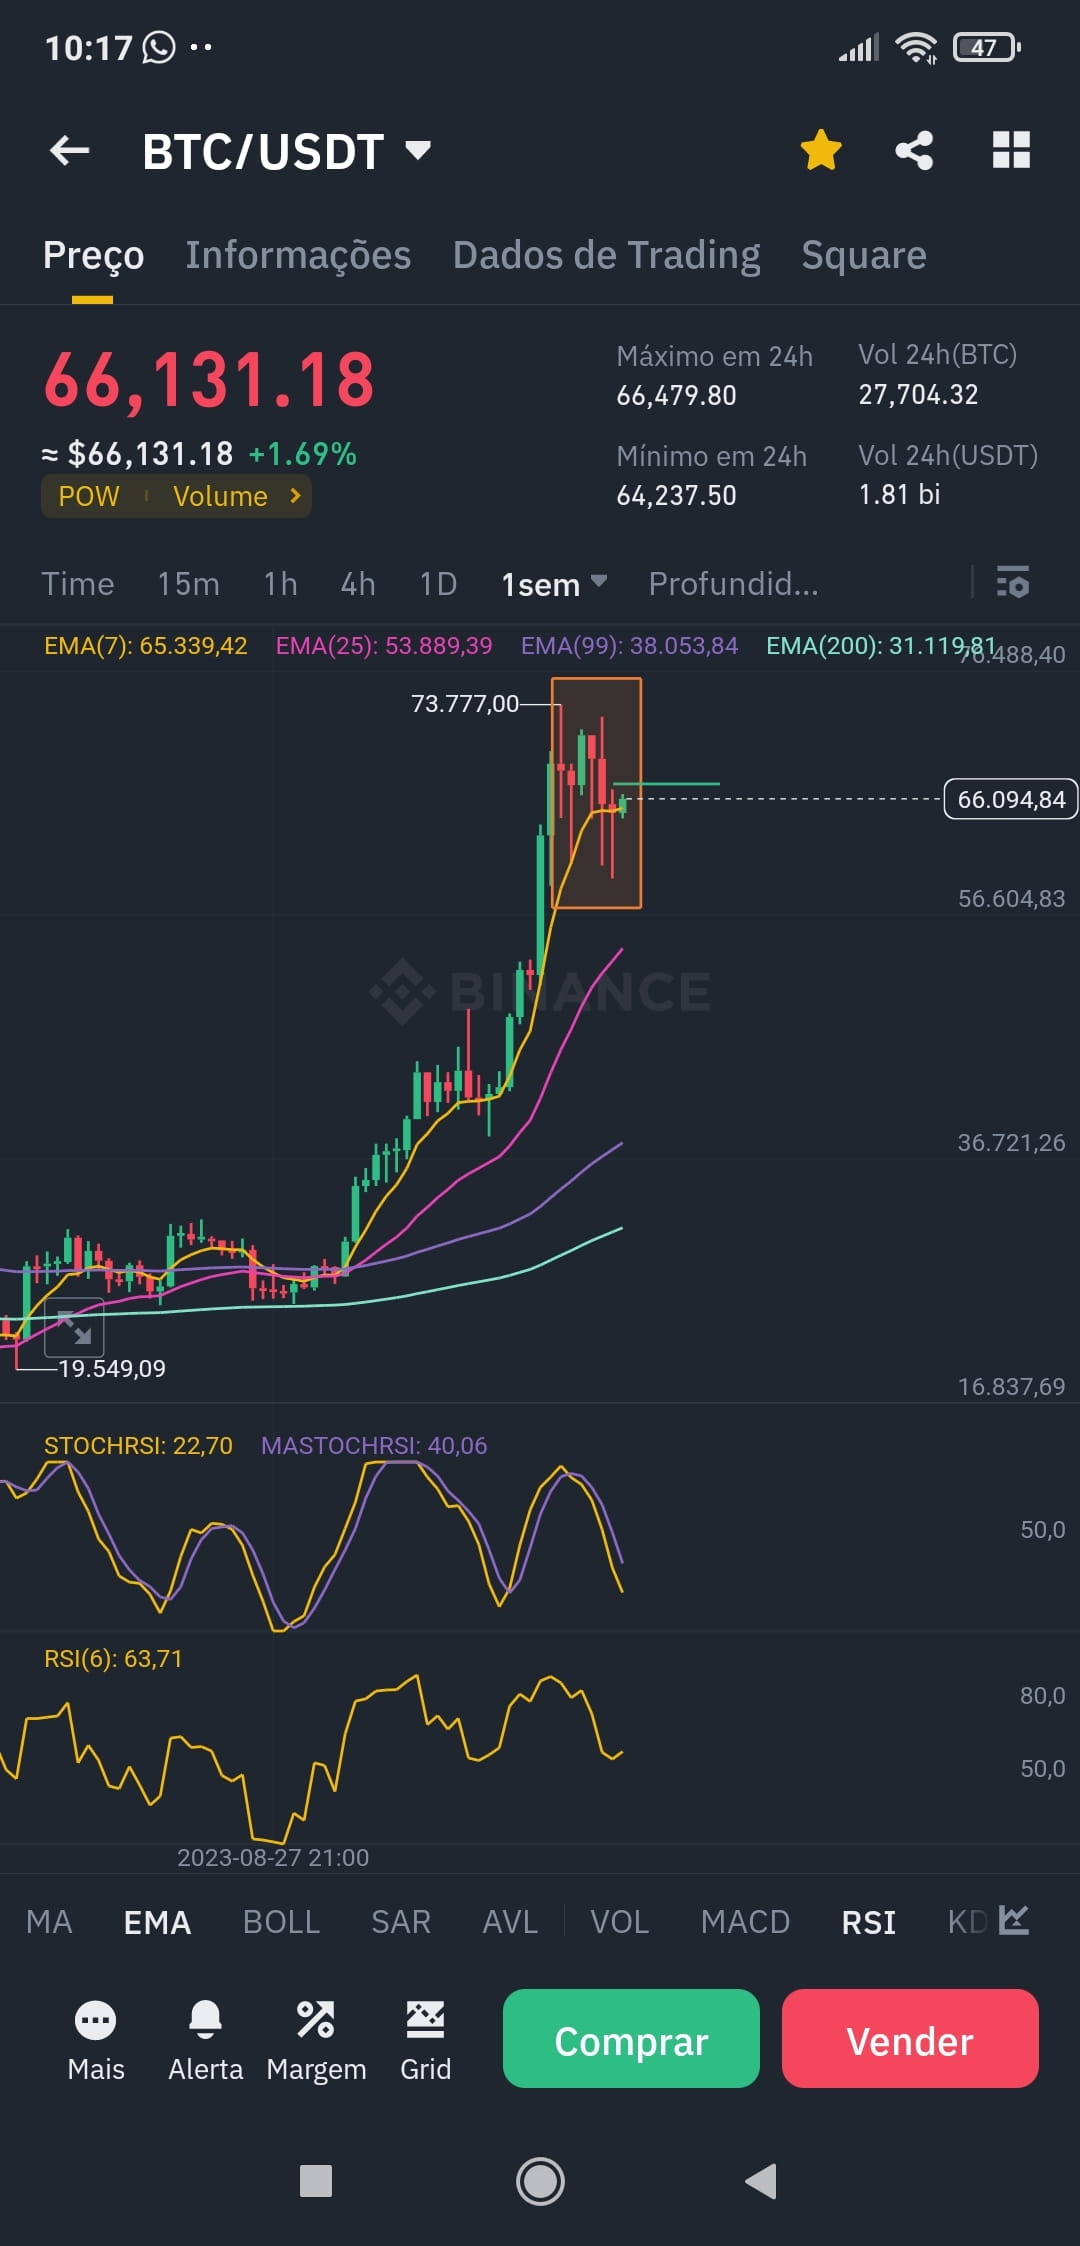
By following the weekly chart of $BTC , we can see optimistic patterns for the market!
Inside the red rectangle we can see two patterns that represent patterns "1, 2, 3"
Within an upward movement we have a correction, after the correction a green candle, after the green candle we have another correction, ending the cycle of 3 movements and starting a possible new upward movement.
The second possible formation of the pattern is given by the last three candles, which form a low, lower low and a higher low.
Both movements have the green line as a possible entry. Indicators also point out good times when assets are oversold. We continue to keep an eye on and look for good entry points to load positions. Stay tuned! 🫡🚀#Binance #bitcoin
By following the weekly chart of $BTC , we can see optimistic patterns for the market!
Inside the red rectangle we can see two patterns that represent patterns "1, 2, 3"
Within an upward movement we have a correction, after the correction a green candle, after the green candle we have another correction, ending the cycle of 3 movements and starting a possible new upward movement.
The second possible formation of the pattern is given by the last three candles, which form a low, lower low and a higher low.
Both movements have the green line as a possible entry. Indicators also point out good times when assets are oversold. We continue to keep an eye on and look for good entry points to load positions. Stay tuned! 🫡🚀#Binance #bitcoin