
Written by: Kaname Madoka, IOBC Capital
In the FTX crash incident that we just experienced, many analysts and researchers tried to gain a better understanding of the overall picture of this incident by analyzing the on-chain assets of FTX and Alameda and the financial transactions between them and other entities.
The development history of Web2 tells us that data has become one of the most important means of production.
On-chain data analysis has always been an indispensable and important tool in the blockchain industry. In the early days when public chains were not abundant, data analysis tools were mainly used to analyze simple indicators such as the number of addresses, number of coins held, holding time, and number of transactions on Bitcoin and Ethereum.
With the rise of many public chains, the gradual development and growth of DeFi, the surge in NFT trading volume, and the enrichment of on-chain social activities, users have more demand for analyzing on-chain data, and the dimensions of analysis have become more complex.
As we all know, the data on the chain is open and transparent, and everyone is equal in front of this data. However, this does not mean that everyone has the same amount of information. The difference in data analysis level leads to different understanding of the market, and ultimately leads to different trading behaviors.
How to extract valuable information from public data is a question that every trader in this industry will think about. Whether it is a small trading fund or a large institution, they are increasingly relying on various analytical tools to make their investment decisions.
In recent years, many excellent products have emerged in the field of on-chain data analysis, and their valuations in the primary investment market can easily reach hundreds of millions or even billions.
The following is a brief introduction to the models and service contents of Nansen, glassnode, Token terminal, Eigenphi, Dune Analytics and Footprint Analytics.
Nansen
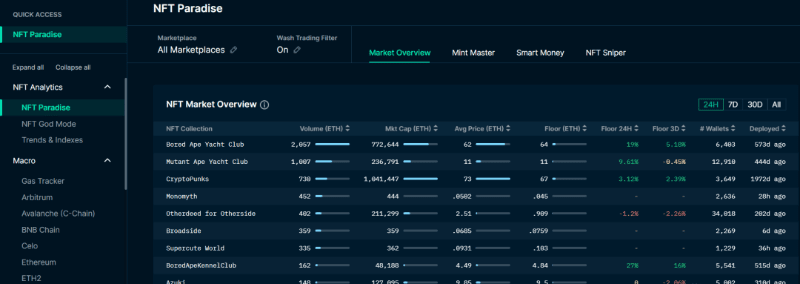
Nansen focuses on tracking on-chain activities and is famous for "labeling on-chain addresses", the most famous of which is "smart money". The smart money labels are the wallet addresses of the elites in the crypto world. Their trading behaviors usually bring considerable profits, and other traders naturally want to follow their trading behaviors.
Nansen has a strong ability to iterate quickly. For example, after the rise of the NFT market, it quickly launched a series of NFT-related products and services, such as NFT Paradise, NFT God Mode, NFT Wallet Profiler, etc.
【The main function】
The main functions provided by Nansen include portfolio, smart alerts, watchlist, etc. On the main interface of Nansen, you can view the macro data, defi data, stablecoin data of major public chains and the basic situation of the NFT market, including the market value, floor price, trading volume, transaction amount and number of wallets held by major NFTs.
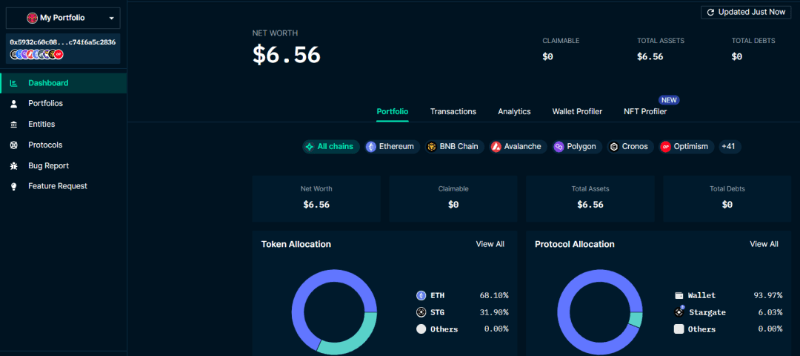
portfolio: Nansen users can use their wallet address to log in to their website. After logging in, they can view all assets, transaction records, asset analysis, etc. under the wallet address on the page.
Smart alerts: Nansen allows users to subscribe to smart alerts, where they will be notified when there is activity at the addresses they have subscribed to.
Watchlist: Users can add the wallet address they want to monitor to the watchlist to monitor the movement of the address at any time.
Currently, Nansen provides some free functions, but most of the functions require payment, which is also the main source of income for Nansen.
[Whether to support custom data]
Currently, the data provided by Nansen has been processed by them and does not support user-defined data analysis. Since they are mainly targeting institutional investors who need highly available data, the data they provide are basically finished data that has been modeled and processed.
【Blockchain Coverage】
Nansen already supports data on 41 public chains, including Layer 2.
Data delay
Delayed by minutes.
【Research Report】
Nansen has an analysis team of 18 analysts who provide research reports to users in the nansen research section of their website. The research covers L1/L2, NFT, GAMING, DEFI and macro trends.
glassnode
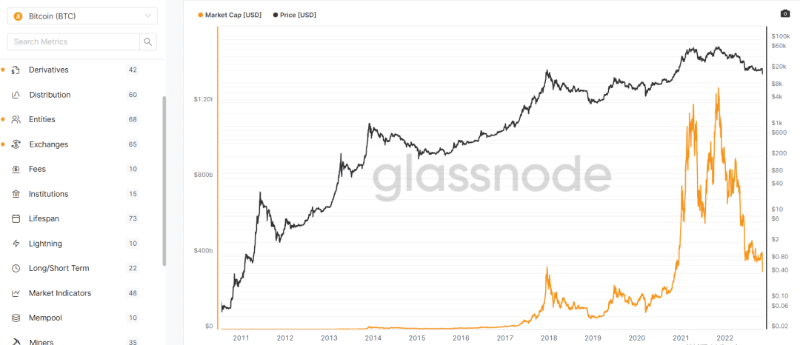
glassnode mainly provides on-chain data of Bitcoin, Ethereum, DEFI tokens, exchange tokens and some stablecoin data. Their feature is that they focus on a vertical aspect, focusing only on data on the BTC, ETH and LTC chains. However, for these three chains, especially the Bitcoin chain, they provide a variety of rich data indicators that can help users judge their current position in the encryption cycle.
【The main function】
It provides various modeled data indicators, such as addresses, token distribution, coin holders, fees, derivative interest rates and leverage, exchange funds, miners, markets, profits and losses, supplies, number of transactions, etc., to help users comprehensively analyze the positions of the entire market and make trading decisions.
[Whether to support custom data]
Most of the data provided by glassnode are officially modeled analytical data, but user customization functions are also provided in the dashboard and workbench modules. Users can define the indicators they need and generate charts on glassnode.
【Blockchain Coverage】
glassnode mainly focuses on the data on the BTC, ETH, and LTC chains, including these three main currencies and mainstream ERC-20 tokens, stablecoins, mainstream defi tokens, and exchange tokens.
Data delay
Delayed by minutes.
【Research Report】
Glassnode's glassnode insights module provides various research reports. Just like the data they provide, the main focus of the research reports is also on macro-cycle research. It provides a series of weekly reports on the situation on the chain, as well as research related to Ethereum and DeFi.
Token Terminal
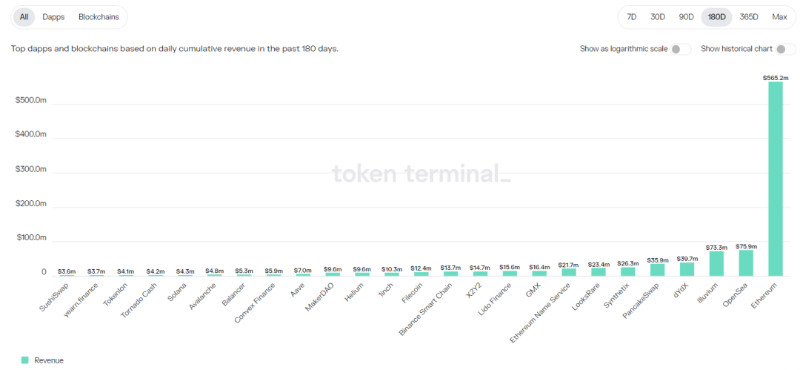
Token Terminal focuses on the revenue of each on-chain project, including total revenue, expenses, TVL, and price-to-sales ratio and price-to-earnings ratio estimated based on revenue, providing reliable reference data for project valuation in the same way as traditional companies.
【The main function】
Token Terminal mainly provides revenue data charts of many on-chain protocols, as well as data on major exchanges and mainstream chains in the market.
[Whether to support custom data]
Token terminal now supports downloading of all data charts and also provides an API interface so that users can use this data to create their own charts.
【Blockchain Coverage】
Currently, it supports querying data of more than 20 mainstream chains and more than 150 protocols.
Data delay
Two days. Since the analysis is mainly about income data, it needs to be in days, so the data delay time is relatively longer.
【Research Report】
Research report service is not available yet.
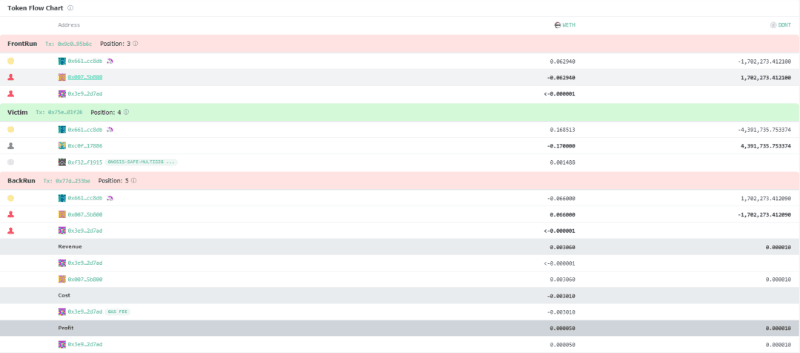
Eigenphi
This is a tool that mainly analyzes MEV behavior data for DEFi activities. Their features are to provide real-time token flows, filter out redundant information, and connect traders' trading behaviors scattered in various Defi protocols, making it easier for users to identify their trading strategies.
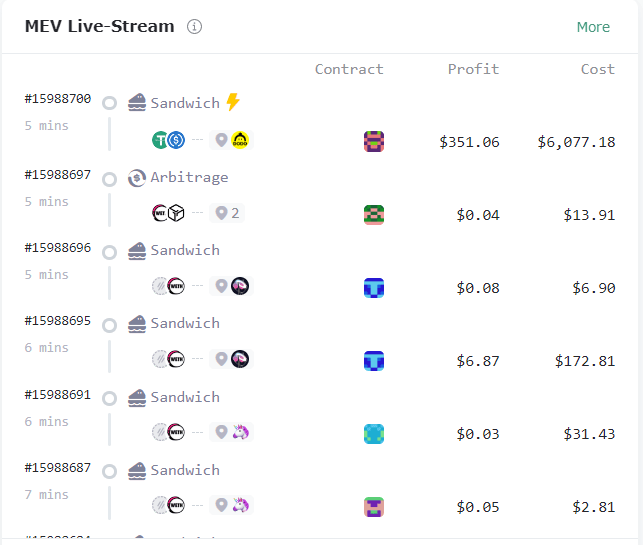
【The main function】
Eigenphi provides sandwich attack monitoring, lending and real-time liquidation data monitoring, flash loan behavior monitoring, and MEV real-time token flow display. It also provides tools to monitor the most popular liquidity pools, the most popular tokens, and tokens with malicious behavior.
[Whether to support custom data]
User-defined data analysis is not currently supported.
【Blockchain Coverage】
It mainly supports data on Ethereum, and also covers some data on the BSC chain. This is mainly because the Defi infrastructure on Ethereum is more complete and MEV arbitrage activities are relatively more abundant.
Data delay
Almost real time.
【Research Report】
Research is a newly launched feature that provides Defi-related research reports.
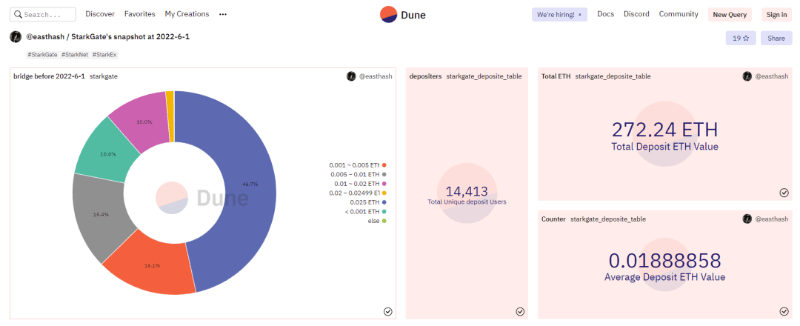
Dune analytics
The feature of Dune is that they are an open UGC community that opens up raw on-chain data queries to users, allowing users to use SQL code for customized data analysis and generate their own customized data visualization dashboard for other users to view. However, for users who want to customize their own data indicators, there is a certain code usage threshold.
【The main function】
Provide users with raw data on multiple chains, and users can use SQL language to analyze and publish analysis results according to their needs.
At the same time, Abstraction is open to project parties, who can process the data of their own protocols and generate customized data analysis charts for users to view.
[Whether to support custom data]
Supported. All displayed data are user-defined data.
【Blockchain Coverage】
Supports data on six chains: Ethereum, BSC, Optimism, Polygon, Gnosis Chain, and Solana.
Data delay
Minutes of delay.
【Research Report】
Not available yet.
Footprint analytics
Footprint and Dune are similar, but also different. Footprint also opens data to users, allowing users to customize data analysis charts, but the data provided by Footprint includes both raw data on the chain and processed data that is easier to analyze and use.
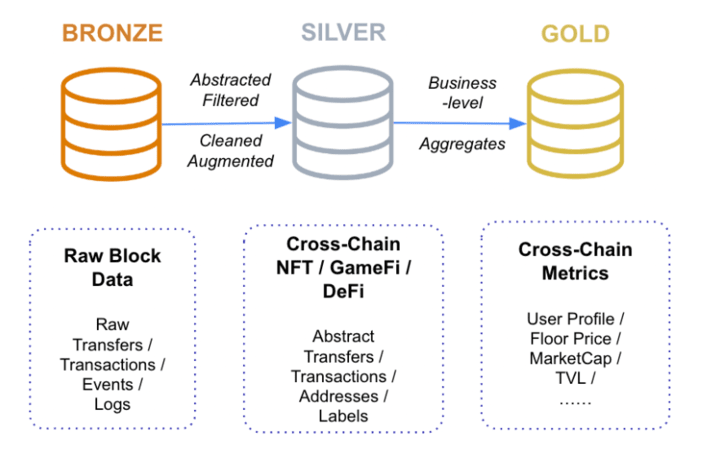
Footprint divides data into three categories: gold, silver and bronze. Bronze-level data are unprocessed raw on-chain transactions, transfers, activities, logs and other data; silver-level data are NFT, GameFi, and Defi data on multiple chains, with transactions, addresses, etc. extracted and marked; gold-level data are aggregated business-level data, including user portraits, market value, TVL and other data, which can be used directly.
Footprint also provides users with simple charting tools that allow them to customize their own data panels without using code.
【The main function】
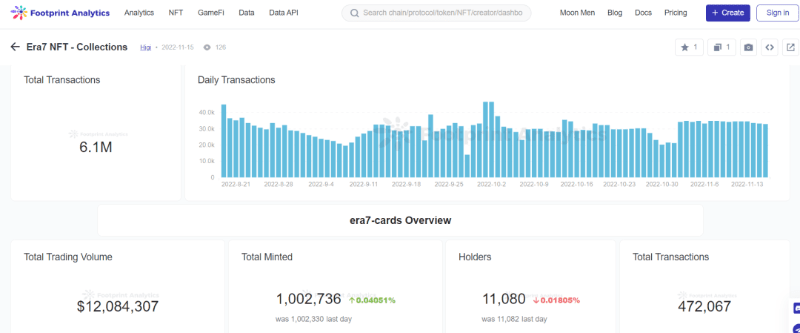
Provides raw and processed data and chart tools for users to customize their own data analysis dashboards. User-generated dashboards can also be viewed by other users.
[Whether to support custom data]
Yes. There are both user-defined data analysis charts and officially generated dashbooards.
【Blockchain Coverage】
Supports data on 16 chains including Ethereum, BSC, Polygon, Fantom, Hive, Avalanche, Arbitrum, Harmony, Boba, Celo, DFK, HSC, IoTeX, Moonbeam, Moonriver and ThunderCore.
Data delay
The delay time of different data ranges from a dozen seconds to several hours.
【Research Report】
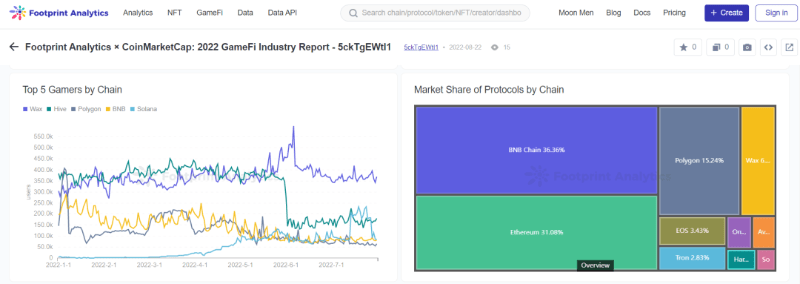
Cooperate with CoinMarketCap to provide industry research reports such as GameFi.
Compared
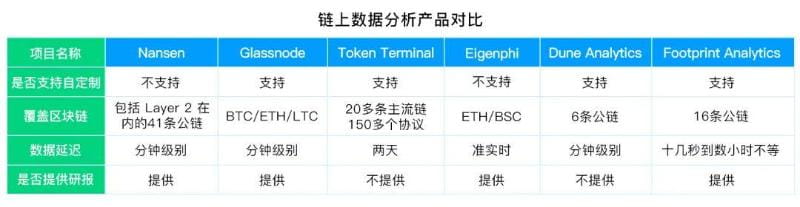
Conclusion
With the formation of a multi-chain landscape (including Layer 1 and Layer 2), the field of on-chain data analysis will be a huge cake in the foreseeable future. Whether in terms of depth or breadth, there will be a lot of room for subsequent development.
The current on-chain data analysis products each have their own areas of focus, showing a trend of vertical development. Although there are already several leading products, it is still possible to create a dark horse if you can find the right entry point.
Since all data on the blockchain is open and transparent, it does not have a moat like Web2 companies in terms of data sources, so data analysis tools can only continuously polish their products, perform rapid updates and iterations, and provide more and better indicators to attract users.
This track has great potential and can bring great value to traders. We are still full of expectations for the development of this track in the future.