
A candlestick chart, also known as a candlestick chart, is a popular chart type that is widely used to analyze price trends in stocks, forex, and cryptocurrencies. It can provide more information than a simple line chart or bar chart. To become a professional trader, the first task you need to learn is to read K lines.
K-line charts usually include three main parts: entity, shadow line and color. The entity shows the opening price and closing price of the day, the shadow line shows the high point and low point of the day, and the color indicates the moving direction of the K-line formation period.
There are four data points in each candlestick: the opening price, the highest price, the lowest price, and the closing price for a specific period of time. The opening price refers to the transaction price of the first transaction in that specific period, and the closing price is the transaction price of the last transaction in that period.
Entity: The rectangle drawn by connecting the opening price and closing price is considered the entity of the K-line.
Shadow line: The vertical line connecting the highest price and the real body is called the upper shadow line of the candlestick, while the vertical line connecting the lowest price and the real body is called the lower shadow line.
Color: If the closing price is higher than the opening price, the K-line is usually drawn in hollow green, forming a positive line representing a rise in price. On the contrary, if the closing price is lower than the opening price, the K line is usually painted in solid red to indicate a negative line.
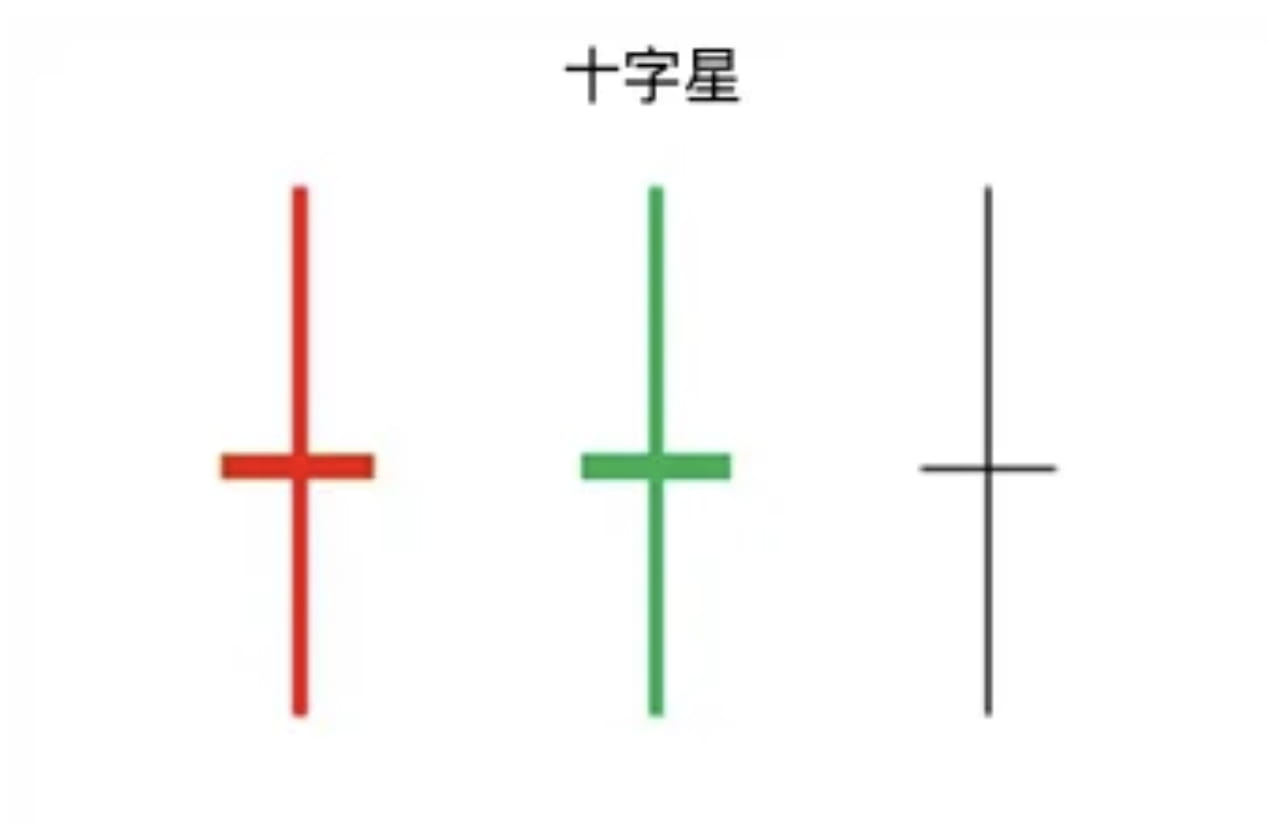
A special situation occurs when the opening price and closing price are almost equal. In this case, the K line is usually called a "cross star".
Each candlestick tells the story of the game between bulls and bears. Generally speaking, traders can interpret the K-line by checking the following three aspects:
Entity size: Indicates the range of price changes. A positive candlestick with a large real body indicates that buyers are in a strong position. Conversely, a negative line with a large real body indicates that sellers are in strength.
Shadow line length: indicates price volatility. The long shadow line indicates that the price fluctuated greatly for a time, but eventually returned to the original price level, showing that market sentiment is in uncertainty. The short shadow line indicates that the market is relatively benign. Generally speaking, the longer the shadow line, the more likely it is that the price will move in the opposite direction of the shadow line.
Trading volume: A key indicator worth noting when analyzing the K-line is the trading volume bound to it. If a rise in price is accompanied by an increase in trading volume, there is a greater chance that the upward trend will strengthen. However, if the price rises sharply and volume decreases, it suggests that the rally may not be sustainable for long.
Special note: Although candlestick charts can provide a lot of useful information, they cannot guarantee future market behavior. They are only one tool and need to be used in conjunction with other analytical tools and appropriate risk management strategies.