Bullish XRP price prediction for 2023 ranges from $0.5660 to $0.7095.
Ripple (XRP) price could hit $2 soon.
The bearish XRP price prediction for 2023 is $0.3567.
In this Ripple (XRP) Price Prediction 2023, we will use accurate trader-friendly technical analysis indicators to analyze XRP’s price patterns and predict the future movement of the cryptocurrency.
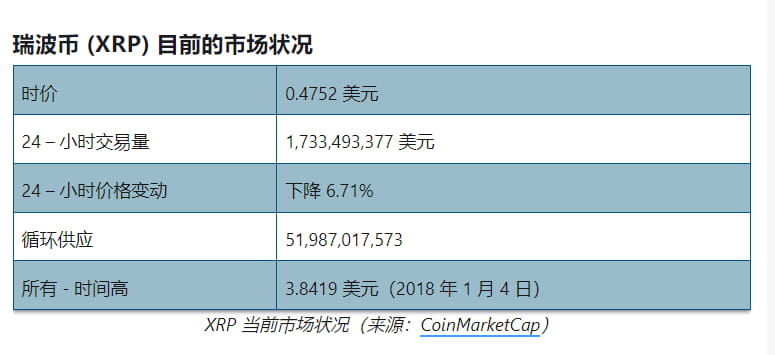
What is Ripple (XRP)?
Ripple (XRP) is the native cryptocurrency of the XRP Ledger (XRPL). XRPL is an open source public blockchain launched in 2011 by Ripple, a blockchain-based payment system. XRP is used as a transaction fee and potential payment and investment option on the local network.
Ripple has attracted investor interest with its unique consensus protocol. It is based on a federated consensus mechanism to verify transactions. The network allows any user to use verification software and verify transactions against their "unique node list." As a result, transactions are verified on the ledger within 4-5 seconds at a lower cost.
Ripple (XRP) Price Prediction 2023
Ripple (XRP) is ranked sixth on CoinMarketCap in terms of market capitalization. An overview of the Ripple price prediction for 2023 is explained below on a daily time frame.
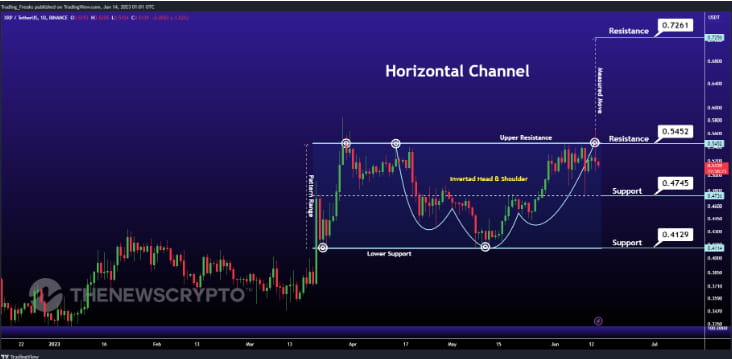
In the image above, Ripple (XRP) has laid out a horizontal channel pattern, also known as a sideways trend. Generally speaking, horizontal channels are formed during price consolidation. In this pattern, the upper trendline (the line connecting the highs) and the lower trendline (the line connecting the lows) are horizontally parallel and the price action is contained within them.
Horizontal channels are often considered one of the suitable market timing patterns because buying and selling points are consolidating.
At the time of analysis, the price of Ripple (XRP) was recorded at $0.5051. If the pattern trend continues, then XRP price may reach the $0.5452 and $0.7261 resistance levels. If the trend reverses, XRP price may drop to the $0.4129 support.
Ripple (XRP) resistance and support levels
The chart below clarifies the possible resistance and support levels for Ripple (XRP) in 2023.
From the chart above, we can analyze and determine the following resistance and support levels for Ripple (XRP) in 2023.
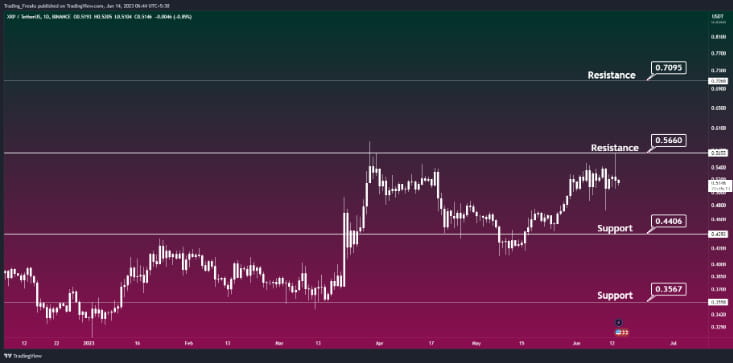
From the above chart, we can analyze and determine that the following are the resistance and support levels for Ripple (XRP) in 2023.
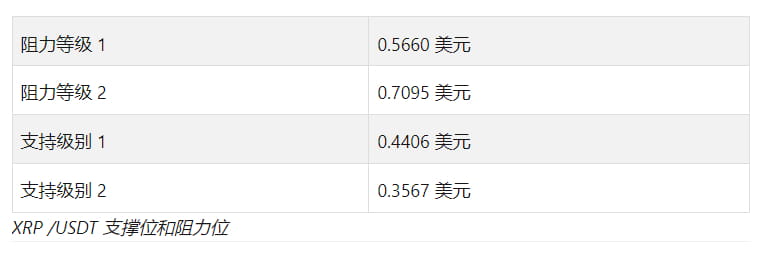
Based on the above analysis, if Ripple (XRP) bulls take the lead, it is likely to reach and break above its resistance level at $0.7095.
Conversely, if Ripple (XRP) bears dominate the trend, the price of XRP could plummet to $0.3567.
Ripple (XRP) Price Prediction for 2023 – RVOL, MA and RSI
The technical analysis indicators of Ripple (XRP) such as relative volume (RVOL), moving average (MA), relative strength index (RSI), etc. are shown in the figure below.
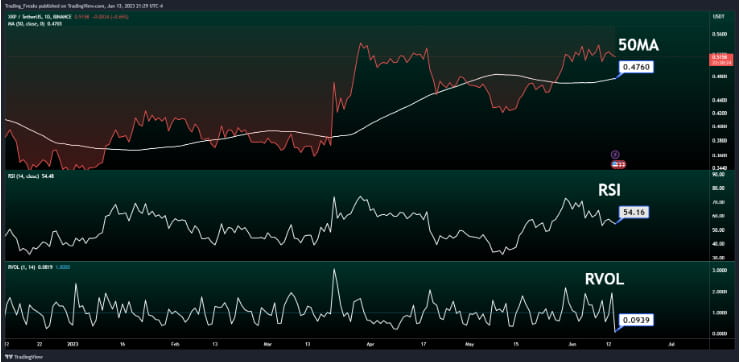
The technical analysis indicator Relative Volume (RVOL) measures an asset's trading volume in relation to its recent average volume. It is usually calculated by dividing the current day's trading volume by the average trading volume over a specified period, such as the past 20 or 50 trading days. Additionally, it helps traders identify unusual trading activity and changes in market sentiment.
At the time of analysis, it was found that RVOL of Ripple (XRP) is below the cut-off line. Therefore, it indicates that the number of participants trading in the current trend is smaller.
The next technical indicator is the Moving Average (MA). This momentum indicator is used to smooth price data and identify market trends. It helps in calculating the average price of an asset during a specific period. In particular, the 50-day moving average (50 MA) evaluates the average closing price of an asset over the past 50 days. When an asset's price is above the 50MA, it is considered to be in an uptrend (bullish), and if it is below the 50MA, it is in a downtrend (bearish). Notably, in the chart above, XRP price is trading above the 50 MA (short-term), indicating that it is in an uptrend. Therefore, XRP is in a bullish position. Although this is the current state, a trend reversal is possible.
Next is the Relative Strength Index (RSI). Notably, this analytical indicator helps traders determine the strength and momentum of an asset's price movements over a specific period. In this analysis, RSI is calculated by comparing an asset's average gain and loss over the last 14 periods. The resulting value is between 0 and 100. Therefore, a reading above 70 indicates overbought conditions and a reading below 30 indicates oversold conditions.
It is worth noting that traders often use the RSI to identify potential trend reversals or confirm the direction of a trend. For example, if an asset is in an uptrend and the RSI reaches an overbought reading of 70, it may indicate that the asset is due for a pullback or correction. Conversely, if an asset is in a downtrend and the RSI is at an oversold reading of 30, it may hint at a potential reversal.
At the time of analysis, the RSI for XRP was 54.16. Therefore, this suggests that XRP is neither overbought nor oversold. However, XRP is giving a buy signal.
Ripple (XRP) Price Prediction 2023 — ADX, RVI
In the chart below, we use the following technical analysis indicators – Average Directional Index (ADX) and Relative Volatility Index (RVI) to analyze the strength and volatility of Ripple (XRP).
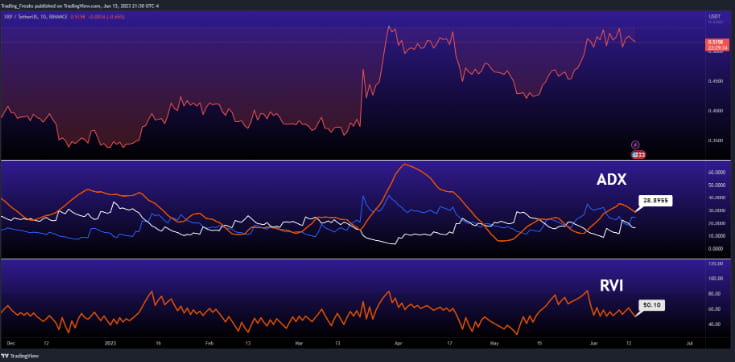
To analyze the strength of trend momentum, let's pay attention to the Average Directional Index (ADX). The ADX value is derived from two Directional Movement Indicators (DMI) +DI and -DI and is expressed between 0 and 100.
According to the data above, XRP’s ADX is in the 28.89 range, indicating a strong trend.
The above chart also shows another technical indicator - the relative volatility index (RVI). This indicator measures the volatility of asset price movements over a specific period of time. Regarding the chart data, XRP's RVI is above 50, indicating high volatility.
Comparison of XRP with BTC and ETH
Now let’s compare the price action of Ripple (XRP) with Bitcoin (BTC) and Ethereum (ETH).
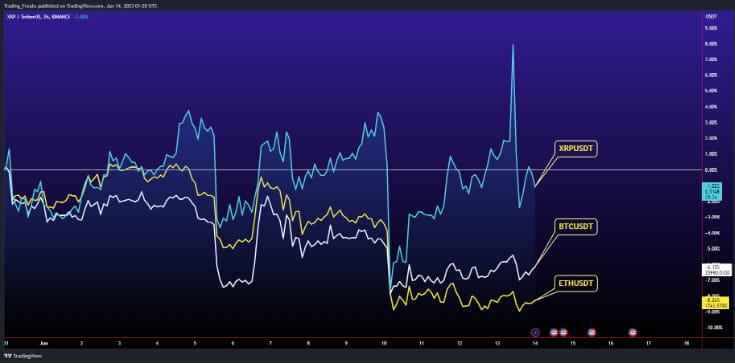
As can be seen from the above chart, the price trend of XRP is similar to that of BTC and ETH. That is, when the prices of BTC and ETH rise or fall, the price of XRP also rises or falls respectively.
in conclusion
If Ripple (XRP) turns out to be a good investment in 2023, this year will be good for the cryptocurrency. All in all, the bullish Ripple (XRP) price prediction for 2023 is $0.7095. In comparison, the bearish Ripple (XRP) price prediction for 2023 is $0.3567.
Ripple (XRP) could hit $2 if there is a positive lift in market momentum and investor sentiment. Furthermore, with future upgrades and advancements in the Ripple ecosystem, XRP may surpass its current all-time high (ATH) of $3.8419 and hit a new ATH.