

What is the KDJ line? The KDJ index is also known as the stochastic index. It was first used for the analysis of the futures market and later for the short-term trend analysis of the stock market. It is a novel and practical technical analysis indicator.
KDJ line is usually used in the statistical system of stock analysis. According to the principle of statistics, the immature randomness of the last calculation cycle is calculated based on the highest price, the lowest price and the closing price of the last calculation cycle that appeared in a certain period (usually 9, 9 weeks). And the proportional relationship between them. Value RSV, then calculate the K value, D value and J value according to the smooth moving average method, and draw a curve to judge the stock trend. The KDJ index originated from the futures market. The random index KDJ first appeared in the form of the KD index, and the KD index was developed on the basis of the William index. However, the KD index only judges the oversold and oversold phenomena of stocks. In the KDJ index, the concept of moving average speed is integrated to form a more accurate basis for buying and selling signals. In practical applications, the K line and the D line cooperate with the J line to form the use of the KDJ line.
What is the KDJ line? The KDJ index mainly studies the relationship between the highest price, the lowest price and the closing price in the design process, and combines some advantages of the momentum concept, the strength index and the moving average. Therefore, it can study and judge the market quickly, quickly and intuitively. It is widely used in the medium and short-term trend analysis of the stock market.
What is the KDJ line? A simple analysis of the KDJ line
The first aspect is the deviation of the KD indicator. When KD is at a low level, if the stock price trend deviates, it is a signal to buy.
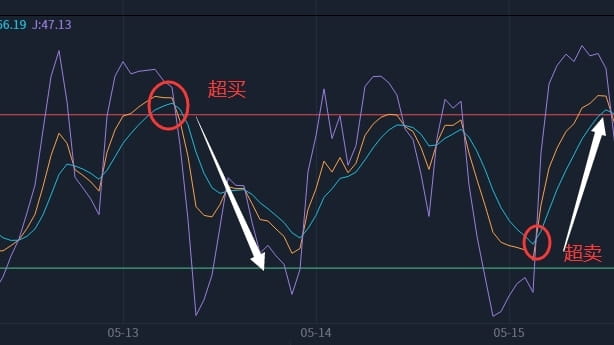
Secondly, if the value of the J index exceeds 100 or falls below 0, it is an abnormal price area. Exceeding 100 indicates overbought, while less than 0 indicates oversold.
The third aspect is that the uniform value range of KD is 0 ~ 100, which can be divided into three areas: the overbought area above 80, the oversold area below 20, and the hovering area between 20 and 80. However, investors here need to note that this division is only a signal prompt and cannot be operated completely according to this analysis method.
The fourth aspect is the crossover of KD indicators. The relationship between K and D is just like the relationship between stock price and MA, but there are also problems of death crossover and golden crossover.
The fifth aspect is the shape of the KD indicator curve. When the KD index is at a higher or lower position, forming a head and shoulders shape and multiple tops (bottoms), it is a buy signal. Here, stock investors should also pay attention to the fact that these patterns must appear at a higher or lower position, and the higher or lower the position, the more reliable the conclusion.