The cycle of kdj usually represents the long and short cycle of kdj. Consider the intersection of KD indicator. The relationship between K and D, like the relationship between stock price and MA, also has the problem of dead cross and golden cross. But the application of cross here is very complicated, and many other conditions are attached. Take the intersection of K and D from bottom to top as an example:
K crossing D is a golden cross, which is a buy signal. But whether to buy when the golden cross appears depends on other conditions. For example, Wang Yu’s reference is to look at the K-line pattern and the Bollinger track space.
The first condition is that the position of the golden cross should be relatively low, especially the position in the oversold zone, the lower the better.
The second condition is the number of intersections with D. Sometimes at a low level, K and D have to intersect back and forth several times. The more times they cross, the more accurate the reference entry will be.
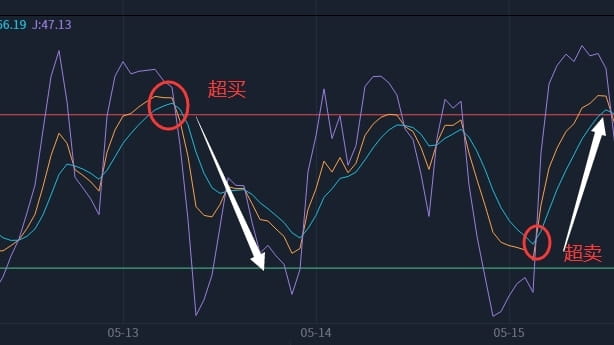
The third condition is the position of the intersection relative to the low point of the KD line, which is often called the "right-side intersection" principle. K intersects with D only when D has risen, which is much more reliable than when D is still falling. Take into account the deviation of the KD indicator. When KD is at a high or low level, if the trend of the stock price diverges, this is a signal to take action. If the index value of J exceeds 100 and is lower than 0, it belongs to the price anomaly zone. If the index value exceeds 100, it is overbought, and if the index value is less than 0, it is oversold.
The kdj cycle is relatively simple to understand. If the definition and origin of kdj are clearer, it will be easier to understand its cycle.
The stochastic swing index, also known as KDJ, is a kind of swing index as the name implies. The KDJ indicator is not used to analyze the running status of the trend, but is mainly used to analyze the overbought and oversold conditions in the market in the short term, so as to guide investors to conduct short-term high-selling and low-buying operations. In a continuous upward trend or a continuous downward trend, the KDJ indicator cannot play any role, but it is one of the most effective tools to consolidate the oscillating trend in short-term high-selling and low-buying operations.
Have you learned it? Wang Yu gives analysis and explanation based on the trend every day. Let’s talk about this indicator.
