

Bitcoin, the world’s leading cryptocurrency, recently completed a major milestone in its price action as it successfully reached the 61.8% Fibonacci retracement level.
This retracement pattern is based on a mathematical ratio derived from the Fibonacci sequence and is often used by traders and analysts to identify potential support and resistance levels in the markets.
Completion of the 61.8% retracement indicates a critical turning point in Bitcoin’s price trajectory.
In this Bitcoin price prediction, we will take an in-depth look at the implications of this retracement level and explore possible scenarios for Bitcoin’s future movements.
Bitcoin Price
As of today, Bitcoin is trading at $26,742 with a trading volume of $11.9 billion in the past 24 hours.
During this period, the cryptocurrency has seen gains of around 1.30%. In terms of market capitalization, Bitcoin maintains its lead with a real-time market cap of $518 billion.
The circulating supply of Bitcoin is 19,384,918 BTC coins, while the maximum supply is capped at 21,000,000 BTC coins.
Bitcoin Price Prediction
On Saturday, Bitcoin fluctuated in a narrow range, with the upper boundary near the 26,875 level and the lower boundary near the 26,675 level.
A closer look at the four-hour timeframe shows that Bitcoin has completed a 61.8% Fibonacci retracement of the 26,875 level.
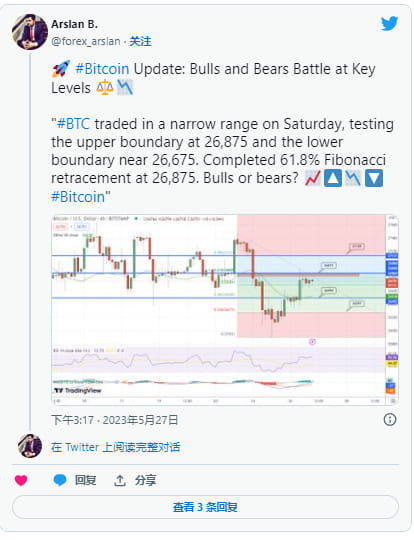
The recent candlestick close below this level has raised concerns about the continuation of the uptrend.
Therefore, if Bitcoin fails to surpass the 26,875 level, there is a risk of a drop to the next support at 26,500, which is also reinforced by the 50-day exponential moving average.
Further down, if Bitcoin falls below the 26,500 mark, the next support is expected to be around 26,250. Additionally, if this level holds, Bitcoin could fall further to 25,900.
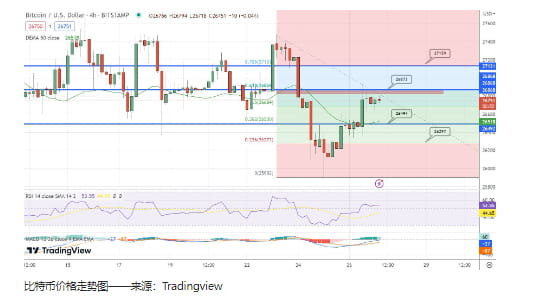
On the other hand, if Bitcoin manages to break above the 26,875 level, it could potentially target resistance at 27,011, followed by a possible move above 27,200, which could expose Bitcoin to levels around 28,000.
Current technical indicators such as the RSI, MACD, and the 50-day exponential moving average are favoring a buying trend.
Therefore, it is advisable to wait for a breakout above the 26,800 mark before confirming the upward momentum.
It is recommended to keep a close eye on this particular level to assess the continuity of the trend.