
CoinQuest
25.5k Posts

CoinQuest
 Square Verified+
Report
Block User
X(Twitter):@CQuestOfficial_

#BinanceTurns7

Top Voices
High-Frequency Trader
3.6 Years
413 Following
125.6K+ Followers
228.4K+ Liked
2 Badges
Posts
All
Quotes
Videos
Live
·
--
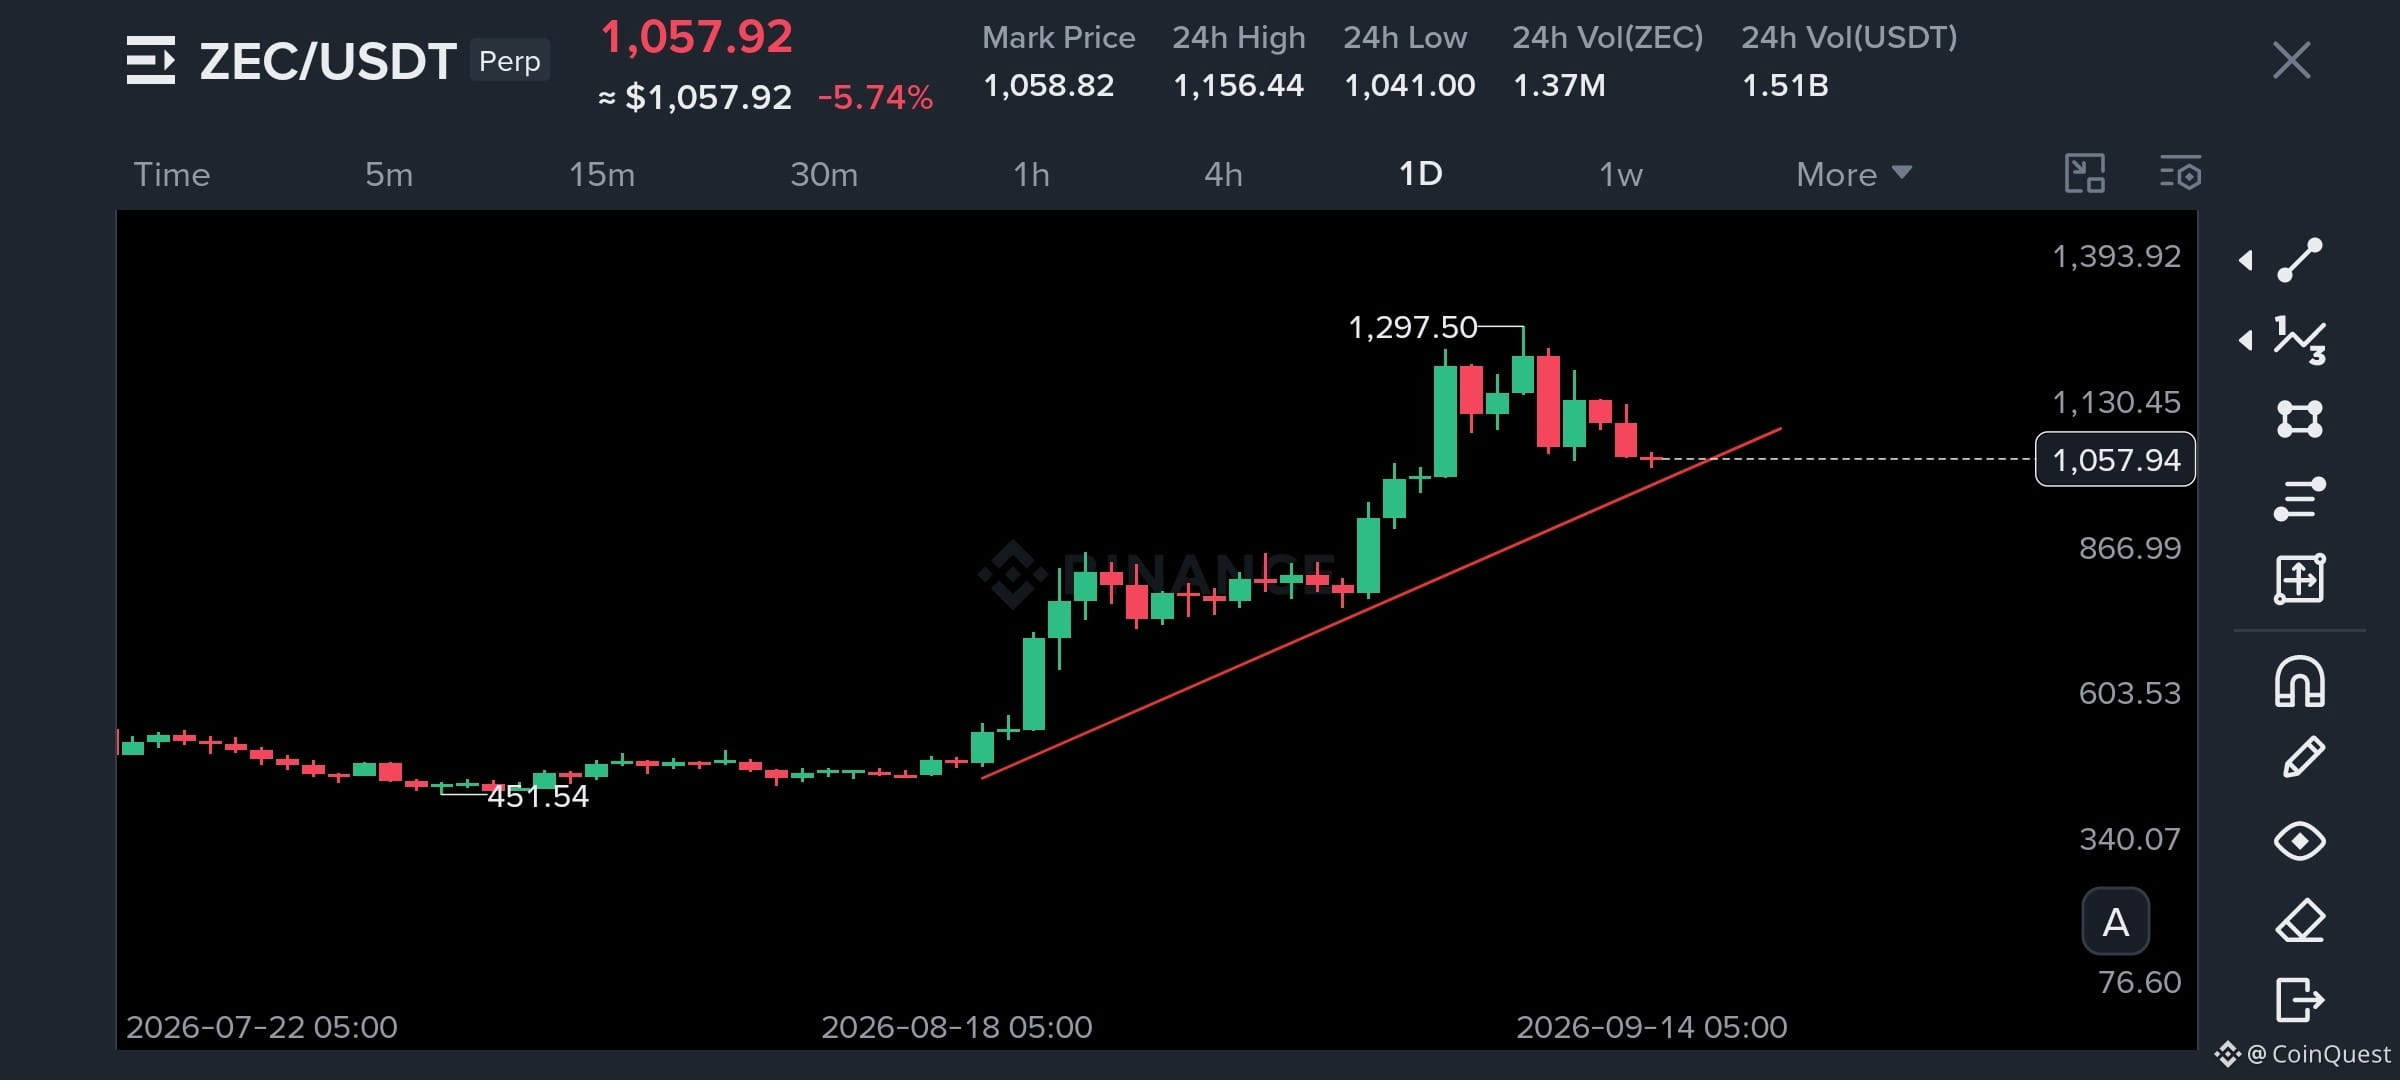
$ZEC is falling but I’m not calling this a crash yet 👀
After that massive run from around $385 to above $1,250, a pullback was always going to happen. What matters now is whether this is simply cooling down and building a new base or whether the higher timeframe structure starts breaking.
On the 4H chart, $1,200 has become a problem for buyers and we’re seeing lower highs after the rejection. That makes the $1,060 to $1,100 area interesting for me. If price retests this zone and gets rejected, I’ll be watching $1,000 first, then $940. If the selling really accelerates, $855 becomes the deeper target.
My short bias is invalidated if ZEC starts accepting back above $1,155. That would put the lower high structure under pressure and could open the door toward $1,200 again.
So for now, I’m watching the reaction, not chasing the dump. A pullback can become healthy consolidation but if key support keeps breaking, the story changes quickly.And also the current price is at Ema 99 support range of 4hr TF & 1 day support range is at $950 .
Long Term Trend is still bullish but you guys can scalp it for shorts...
{future}(ZECUSDT)
Follow CoinQuest for More updates & setups breakdown...
#zec
$ZEC is falling but I’m not calling this a crash yet 👀
After that massive run from around $385 to above $1,250, a pullback was always going to happen. What matters now is whether this is simply cooling down and building a new base or whether the higher timeframe structure starts breaking.
On the 4H chart, $1,200 has become a problem for buyers and we’re seeing lower highs after the rejection. That makes the $1,060 to $1,100 area interesting for me. If price retests this zone and gets rejected, I’ll be watching $1,000 first, then $940. If the selling really accelerates, $855 becomes the deeper target.
My short bias is invalidated if ZEC starts accepting back above $1,155. That would put the lower high structure under pressure and could open the door toward $1,200 again.
So for now, I’m watching the reaction, not chasing the dump. A pullback can become healthy consolidation but if key support keeps breaking, the story changes quickly.And also the current price is at Ema 99 support range of 4hr TF & 1 day support range is at $950 .
Long Term Trend is still bullish but you guys can scalp it for shorts...
Follow CoinQuest for More updates & setups breakdown...
#zec
After that massive run from around $385 to above $1,250, a pullback was always going to happen. What matters now is whether this is simply cooling down and building a new base or whether the higher timeframe structure starts breaking.
On the 4H chart, $1,200 has become a problem for buyers and we’re seeing lower highs after the rejection. That makes the $1,060 to $1,100 area interesting for me. If price retests this zone and gets rejected, I’ll be watching $1,000 first, then $940. If the selling really accelerates, $855 becomes the deeper target.
My short bias is invalidated if ZEC starts accepting back above $1,155. That would put the lower high structure under pressure and could open the door toward $1,200 again.
So for now, I’m watching the reaction, not chasing the dump. A pullback can become healthy consolidation but if key support keeps breaking, the story changes quickly.And also the current price is at Ema 99 support range of 4hr TF & 1 day support range is at $950 .
Long Term Trend is still bullish but you guys can scalp it for shorts...
Follow CoinQuest for More updates & setups breakdown...
#zec
495
·
--
Bearish
Mark my words 🙄
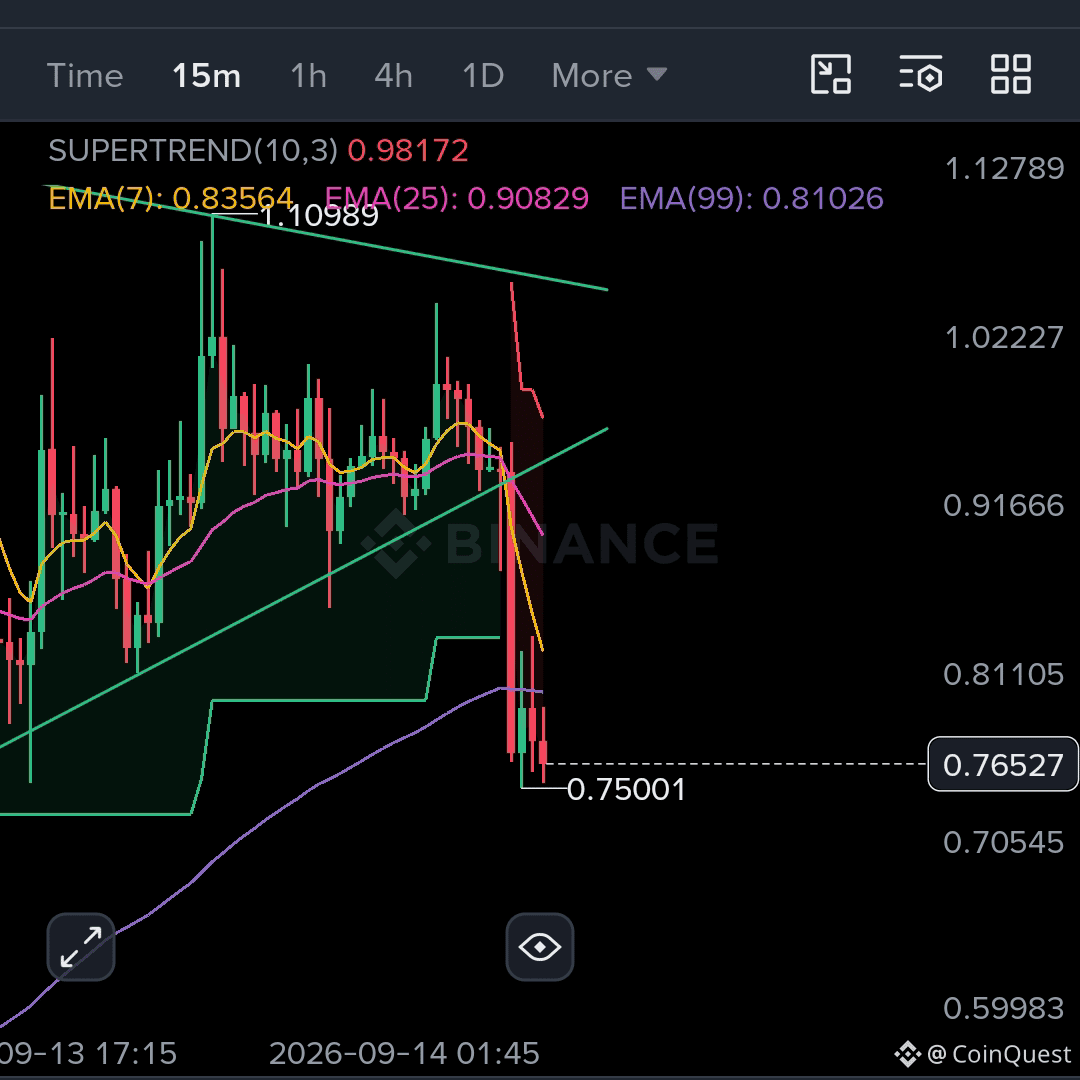
$LSK $0.6 Soon if bulls failed to reclaim the $0.82 support range .. Bull Trend broken & crucial support melts down
Short Here
{future}(LSKUSDT)
Mark my words 🙄
$LSK $0.6 Soon if bulls failed to reclaim the $0.82 support range .. Bull Trend broken & crucial support melts down
Short Here
$LSK $0.6 Soon if bulls failed to reclaim the $0.82 support range .. Bull Trend broken & crucial support melts down
Short Here
2
1.3k
·
--
Bearish
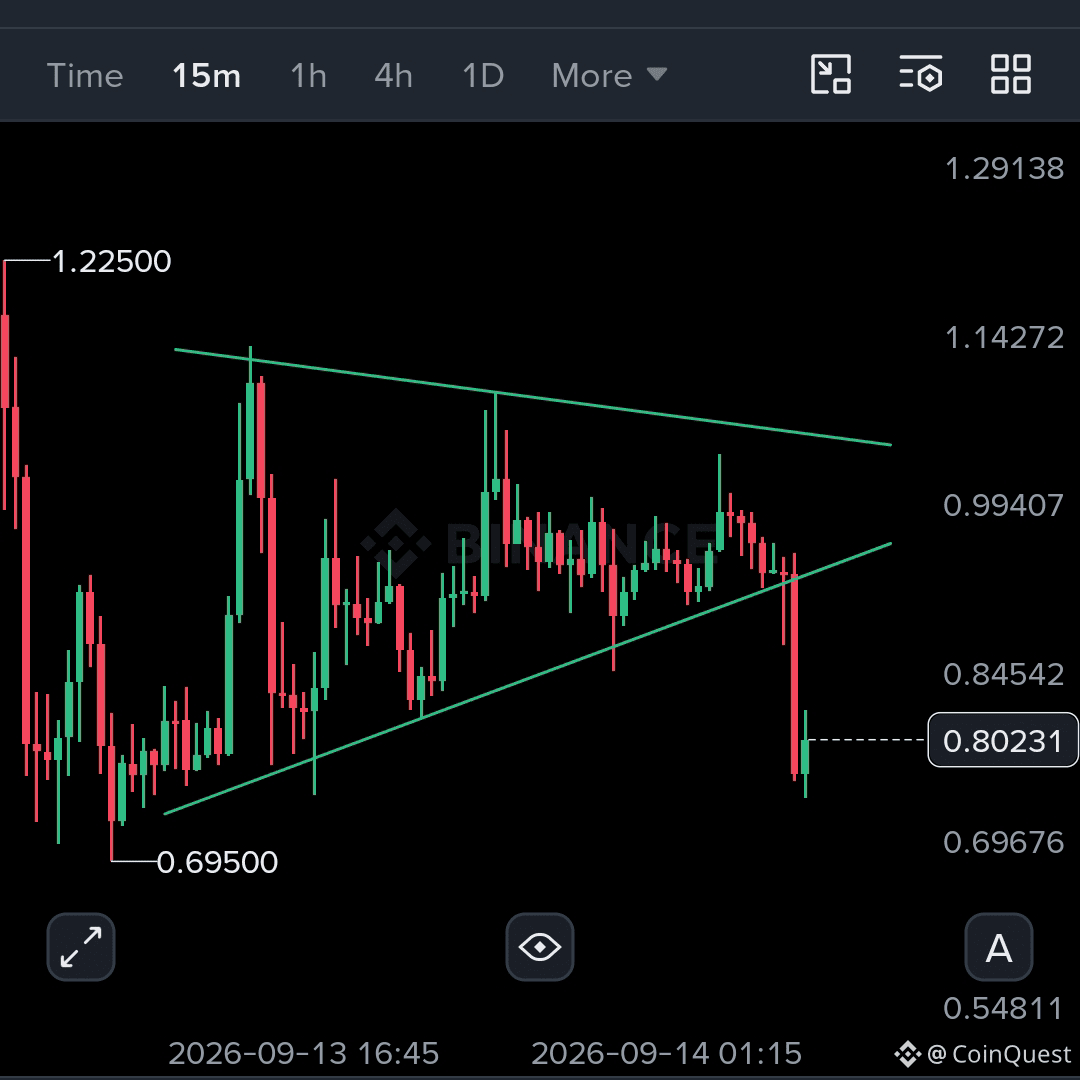
$LSK finally showing a crack or is this just another bear trap?
LSK has been ignoring technicals for a while so I’m not calling the downside confirmed yet. But on the 15M chart, price has broken below the rising trendline. If the current 15 minute candle closes below that trendline, I’ll be watching the short side.
My downside levels are $0.65, $0.60 and potentially below $0.50 if sellers completely take control from here.
But there’s an important catch. This is purely a technical setup, and we already know what LSK did recently when technical levels stopped mattering. That’s why I’d also watch the liquidity clusters around these zones before making any aggressive decision.
Right now, the ball is with the bears. If they can hold this breakdown, the next move could get ugly. If buyers reclaim the trendline, this could turn into another bear trap.
Short Here 👇
{future}(LSKUSDT)
$LSK finally showing a crack or is this just another bear trap?
LSK has been ignoring technicals for a while so I’m not calling the downside confirmed yet. But on the 15M chart, price has broken below the rising trendline. If the current 15 minute candle closes below that trendline, I’ll be watching the short side.
My downside levels are $0.65, $0.60 and potentially below $0.50 if sellers completely take control from here.
But there’s an important catch. This is purely a technical setup, and we already know what LSK did recently when technical levels stopped mattering. That’s why I’d also watch the liquidity clusters around these zones before making any aggressive decision.
Right now, the ball is with the bears. If they can hold this breakdown, the next move could get ugly. If buyers reclaim the trendline, this could turn into another bear trap.
Short Here 👇
LSK has been ignoring technicals for a while so I’m not calling the downside confirmed yet. But on the 15M chart, price has broken below the rising trendline. If the current 15 minute candle closes below that trendline, I’ll be watching the short side.
My downside levels are $0.65, $0.60 and potentially below $0.50 if sellers completely take control from here.
But there’s an important catch. This is purely a technical setup, and we already know what LSK did recently when technical levels stopped mattering. That’s why I’d also watch the liquidity clusters around these zones before making any aggressive decision.
Right now, the ball is with the bears. If they can hold this breakdown, the next move could get ugly. If buyers reclaim the trendline, this could turn into another bear trap.
Short Here 👇
2
553
·
--
Bearish
30D trade $BTW 179.5 USDT
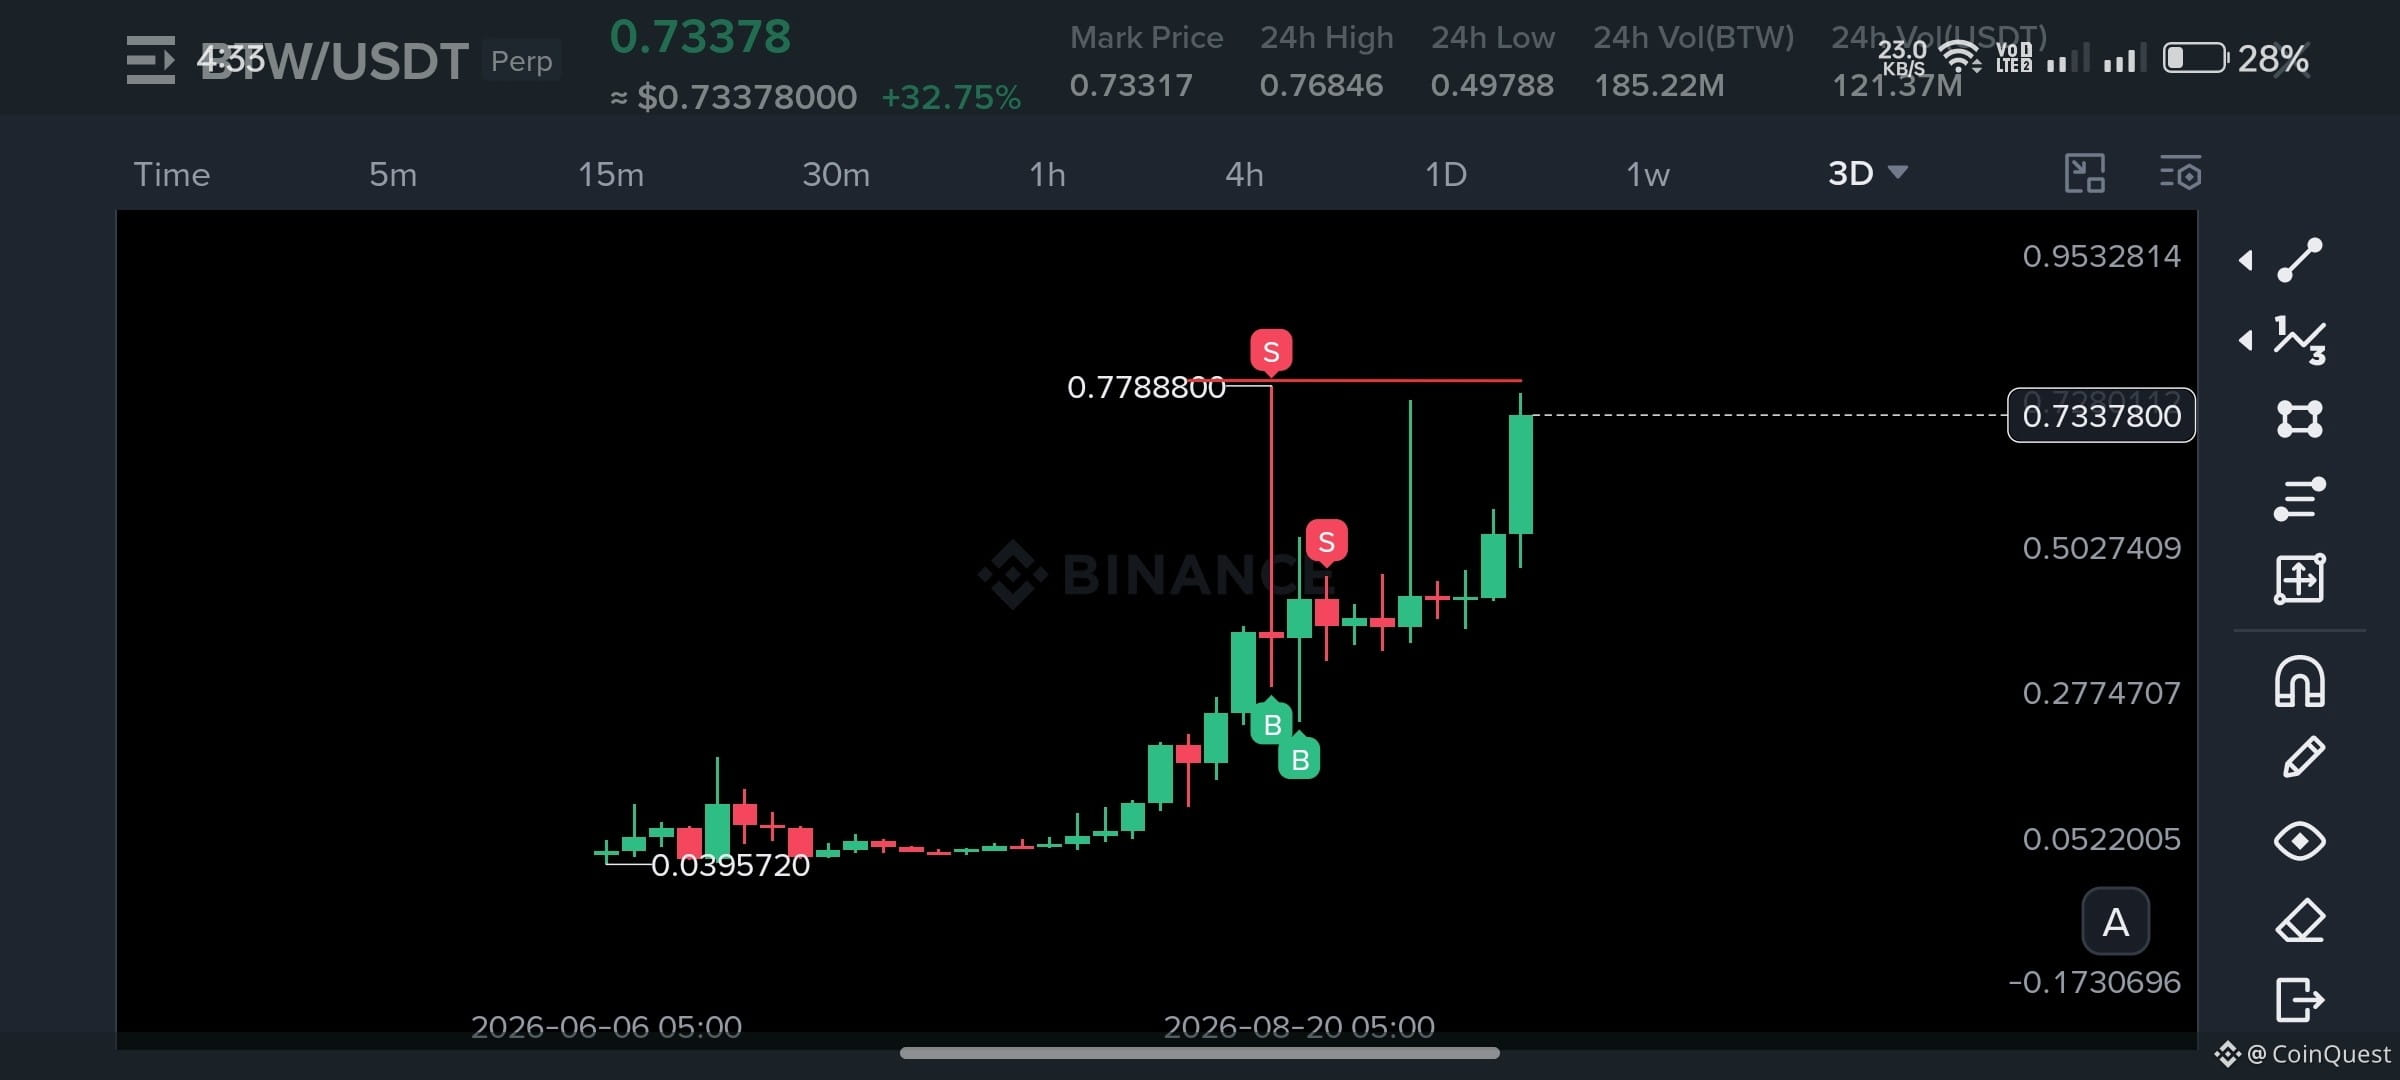
$BTW ... why doesn't this thing want to fall? 😭
After that massive move from the lows, the chart looks extremely stretched, yet BTW keeps finding buyers instead of giving the clean breakdown many shorts are waiting for. That’s exactly what makes this interesting.
I’m still watching the short side but I’m not going to pretend the market has to agree with me just because the valuation looks crazy. Price can stay irrational much longer than a short position can stay comfortable.
The real question is what BTW is trying to build here. If this area keeps holding, another squeeze is possible. But once the support finally gives way, the downside could get violent because there is a lot of air underneath.
I'm still short biased but conviction doesn't mean ignoring price action.
Sometimes the hardest trade is the one you think should already be working
Short here 👇
{future}(BTWUSDT)
#DYOR🟢
$BTW ... why doesn't this thing want to fall? 😭
After that massive move from the lows, the chart looks extremely stretched, yet BTW keeps finding buyers instead of giving the clean breakdown many shorts are waiting for. That’s exactly what makes this interesting.
I’m still watching the short side but I’m not going to pretend the market has to agree with me just because the valuation looks crazy. Price can stay irrational much longer than a short position can stay comfortable.
The real question is what BTW is trying to build here. If this area keeps holding, another squeeze is possible. But once the support finally gives way, the downside could get violent because there is a lot of air underneath.
I'm still short biased but conviction doesn't mean ignoring price action.
Sometimes the hardest trade is the one you think should already be working
Short here 👇
#DYOR🟢
After that massive move from the lows, the chart looks extremely stretched, yet BTW keeps finding buyers instead of giving the clean breakdown many shorts are waiting for. That’s exactly what makes this interesting.
I’m still watching the short side but I’m not going to pretend the market has to agree with me just because the valuation looks crazy. Price can stay irrational much longer than a short position can stay comfortable.
The real question is what BTW is trying to build here. If this area keeps holding, another squeeze is possible. But once the support finally gives way, the downside could get violent because there is a lot of air underneath.
I'm still short biased but conviction doesn't mean ignoring price action.
Sometimes the hardest trade is the one you think should already be working
Short here 👇
#DYOR🟢
1
520
·
--
Learning is more important in crypto than winning every trade💯
If you only chase money, one day the market will take it back from you. But if you learn how the market works, understand the mind behind it, manage risk & study liquidity positioning, you give yourself a chance to survive for the long run.
And remember, this is crypto. Sometimes coins completely ignore the technicals, just like we recently saw with $BTR and $LSK . When liquidity and positioning take over, the chart can behave very differently from what we normally expect. That's why we need to understand the trend and where the liquidity is sitting instead of blindly trusting one indicator or setup.
We are just small dots in a huge sea. We can't control the market. We can't control the whales. We can only control our decisions and our risk.
Learn from every loss. Ask why your plan failed. What did you miss? What changed? What would you do differently next time?
Every trade should have a plan before you enter. Entry, exit and invalidation.
At the end of the day, we are all participants in the same war of whales. Sometimes we are on the winning side. Sometimes we become the liquidity.
#LSK #DYOR🟢 #LearnFromMistakes
Learning is more important in crypto than winning every trade💯
If you only chase money, one day the market will take it back from you. But if you learn how the market works, understand the mind behind it, manage risk & study liquidity positioning, you give yourself a chance to survive for the long run.
And remember, this is crypto. Sometimes coins completely ignore the technicals, just like we recently saw with $BTR and $LSK . When liquidity and positioning take over, the chart can behave very differently from what we normally expect. That's why we need to understand the trend and where the liquidity is sitting instead of blindly trusting one indicator or setup.
We are just small dots in a huge sea. We can't control the market. We can't control the whales. We can only control our decisions and our risk.
Learn from every loss. Ask why your plan failed. What did you miss? What changed? What would you do differently next time?
Every trade should have a plan before you enter. Entry, exit and invalidation.
At the end of the day, we are all participants in the same war of whales. Sometimes we are on the winning side. Sometimes we become the liquidity.
#LSK #DYOR🟢 #LearnFromMistakes
If you only chase money, one day the market will take it back from you. But if you learn how the market works, understand the mind behind it, manage risk & study liquidity positioning, you give yourself a chance to survive for the long run.
And remember, this is crypto. Sometimes coins completely ignore the technicals, just like we recently saw with $BTR and $LSK . When liquidity and positioning take over, the chart can behave very differently from what we normally expect. That's why we need to understand the trend and where the liquidity is sitting instead of blindly trusting one indicator or setup.
We are just small dots in a huge sea. We can't control the market. We can't control the whales. We can only control our decisions and our risk.
Learn from every loss. Ask why your plan failed. What did you miss? What changed? What would you do differently next time?
Every trade should have a plan before you enter. Entry, exit and invalidation.
At the end of the day, we are all participants in the same war of whales. Sometimes we are on the winning side. Sometimes we become the liquidity.
#LSK #DYOR🟢 #LearnFromMistakes
2
407
·
--
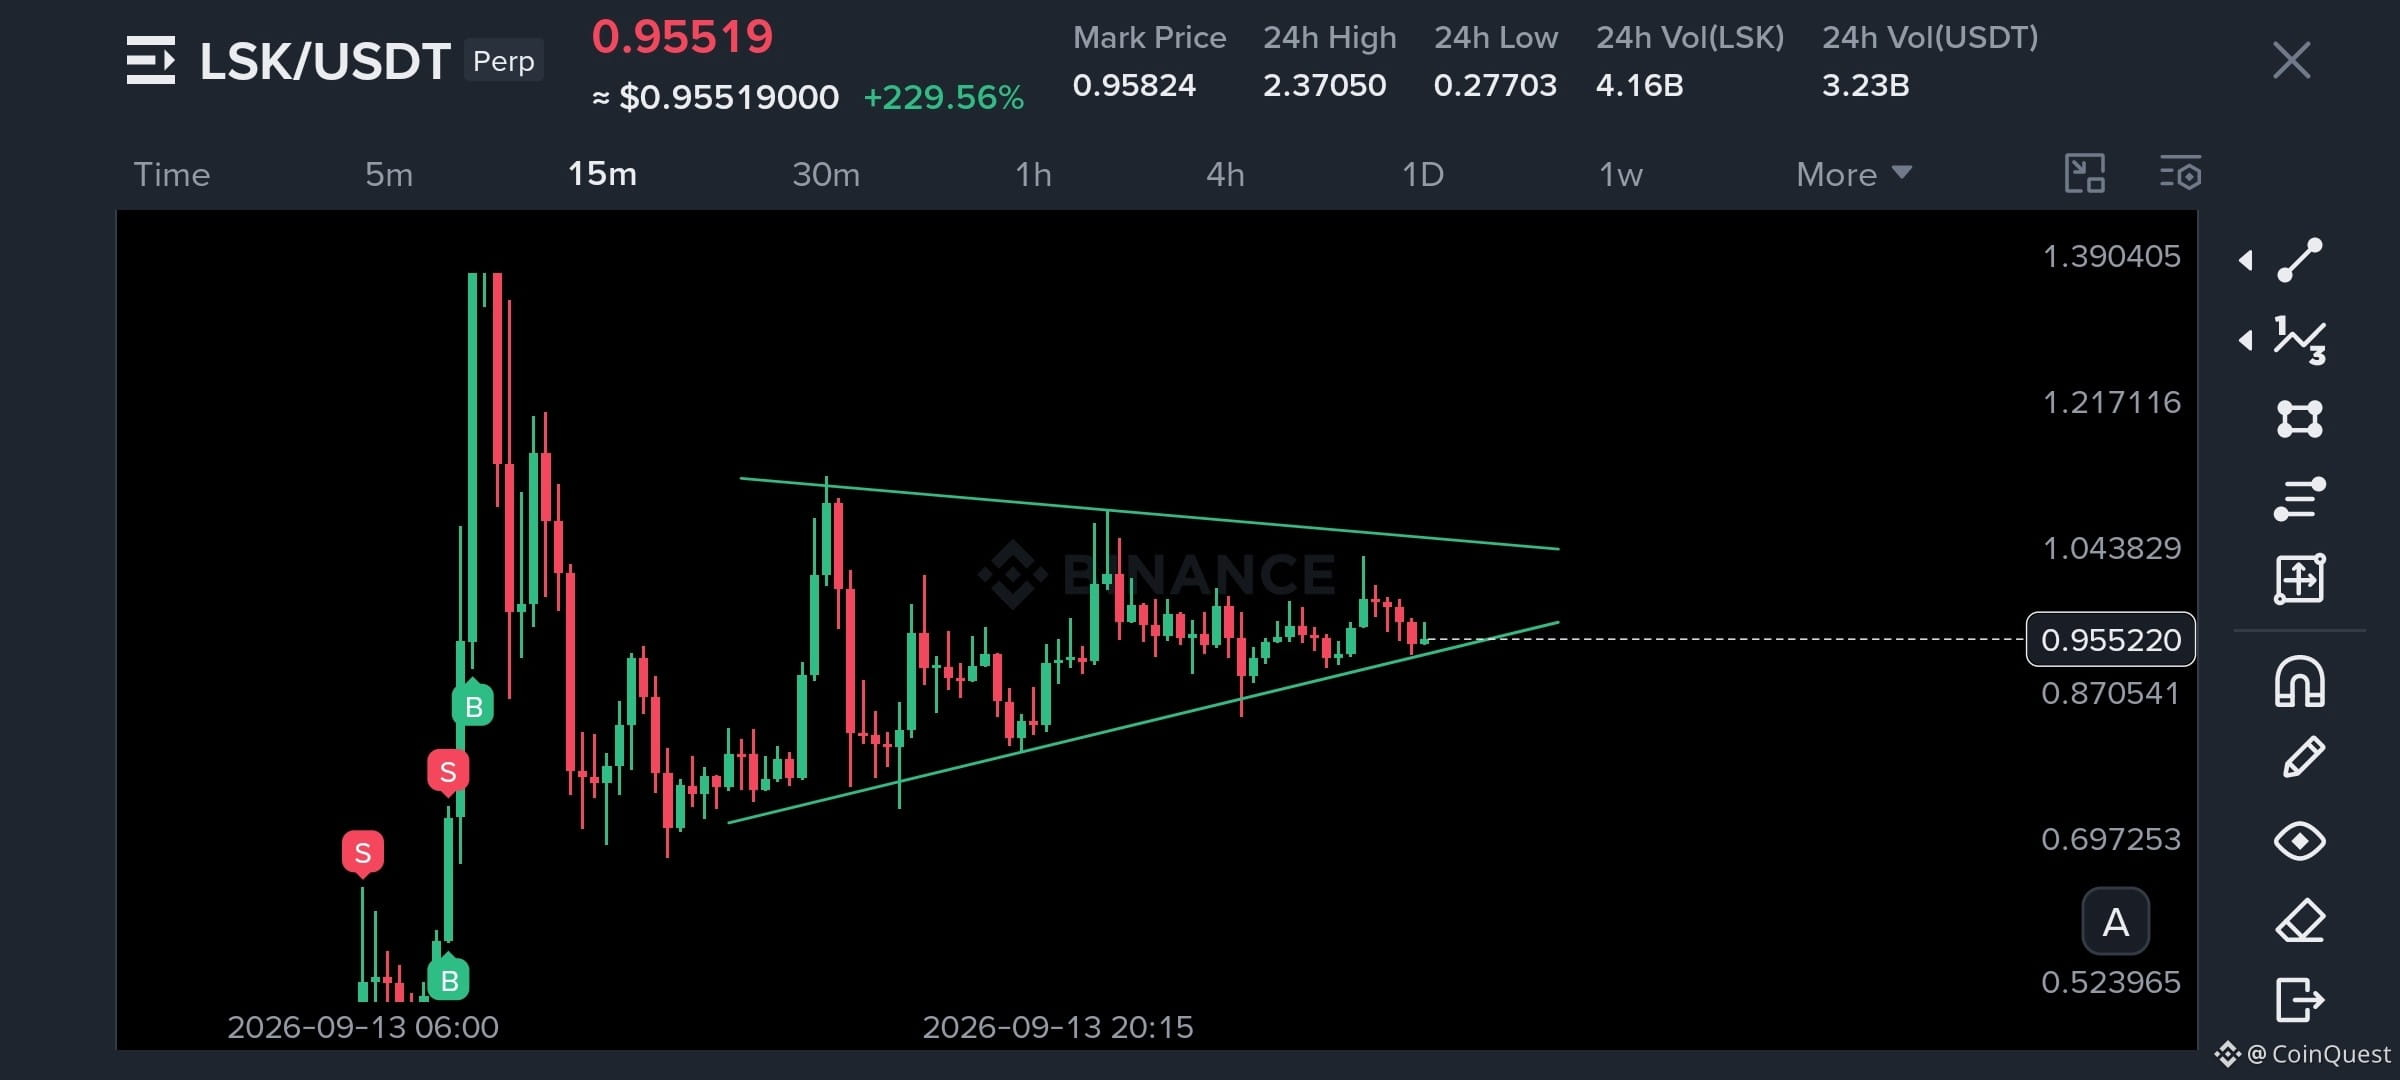
$LSK isn't finished yet 👀
After that massive move, LSK has now created a new support around $0.82 and price is back near $0.97. So the question is simple: is this the setup for another leg up?
We can't guarantee that. But if buyers keep defending $0.82 and price continues bouncing from that zone, another push higher wouldn't surprise me. On the other hand, if $0.82 breaks cleanly and sellers start accepting below it, I’d be watching the $0.60 area and potentially lower.
If you're holding a short position, don't let a profitable trade turn into a bad one. The $1.15 supply zone is the area I'd be watching closely for invalidation.
LSK can still surprise both sides here. That's exactly why I'm watching the reaction at $0.82 instead of trying to predict the next candle.
What comes first, another leg up or the breakdown? 👀
#LSK
$LSK isn't finished yet 👀
After that massive move, LSK has now created a new support around $0.82 and price is back near $0.97. So the question is simple: is this the setup for another leg up?
We can't guarantee that. But if buyers keep defending $0.82 and price continues bouncing from that zone, another push higher wouldn't surprise me. On the other hand, if $0.82 breaks cleanly and sellers start accepting below it, I’d be watching the $0.60 area and potentially lower.
If you're holding a short position, don't let a profitable trade turn into a bad one. The $1.15 supply zone is the area I'd be watching closely for invalidation.
LSK can still surprise both sides here. That's exactly why I'm watching the reaction at $0.82 instead of trying to predict the next candle.
What comes first, another leg up or the breakdown? 👀
#LSK
After that massive move, LSK has now created a new support around $0.82 and price is back near $0.97. So the question is simple: is this the setup for another leg up?
We can't guarantee that. But if buyers keep defending $0.82 and price continues bouncing from that zone, another push higher wouldn't surprise me. On the other hand, if $0.82 breaks cleanly and sellers start accepting below it, I’d be watching the $0.60 area and potentially lower.
If you're holding a short position, don't let a profitable trade turn into a bad one. The $1.15 supply zone is the area I'd be watching closely for invalidation.
LSK can still surprise both sides here. That's exactly why I'm watching the reaction at $0.82 instead of trying to predict the next candle.
What comes first, another leg up or the breakdown? 👀
#LSK
2
1
1.5k
·
--
Bullish
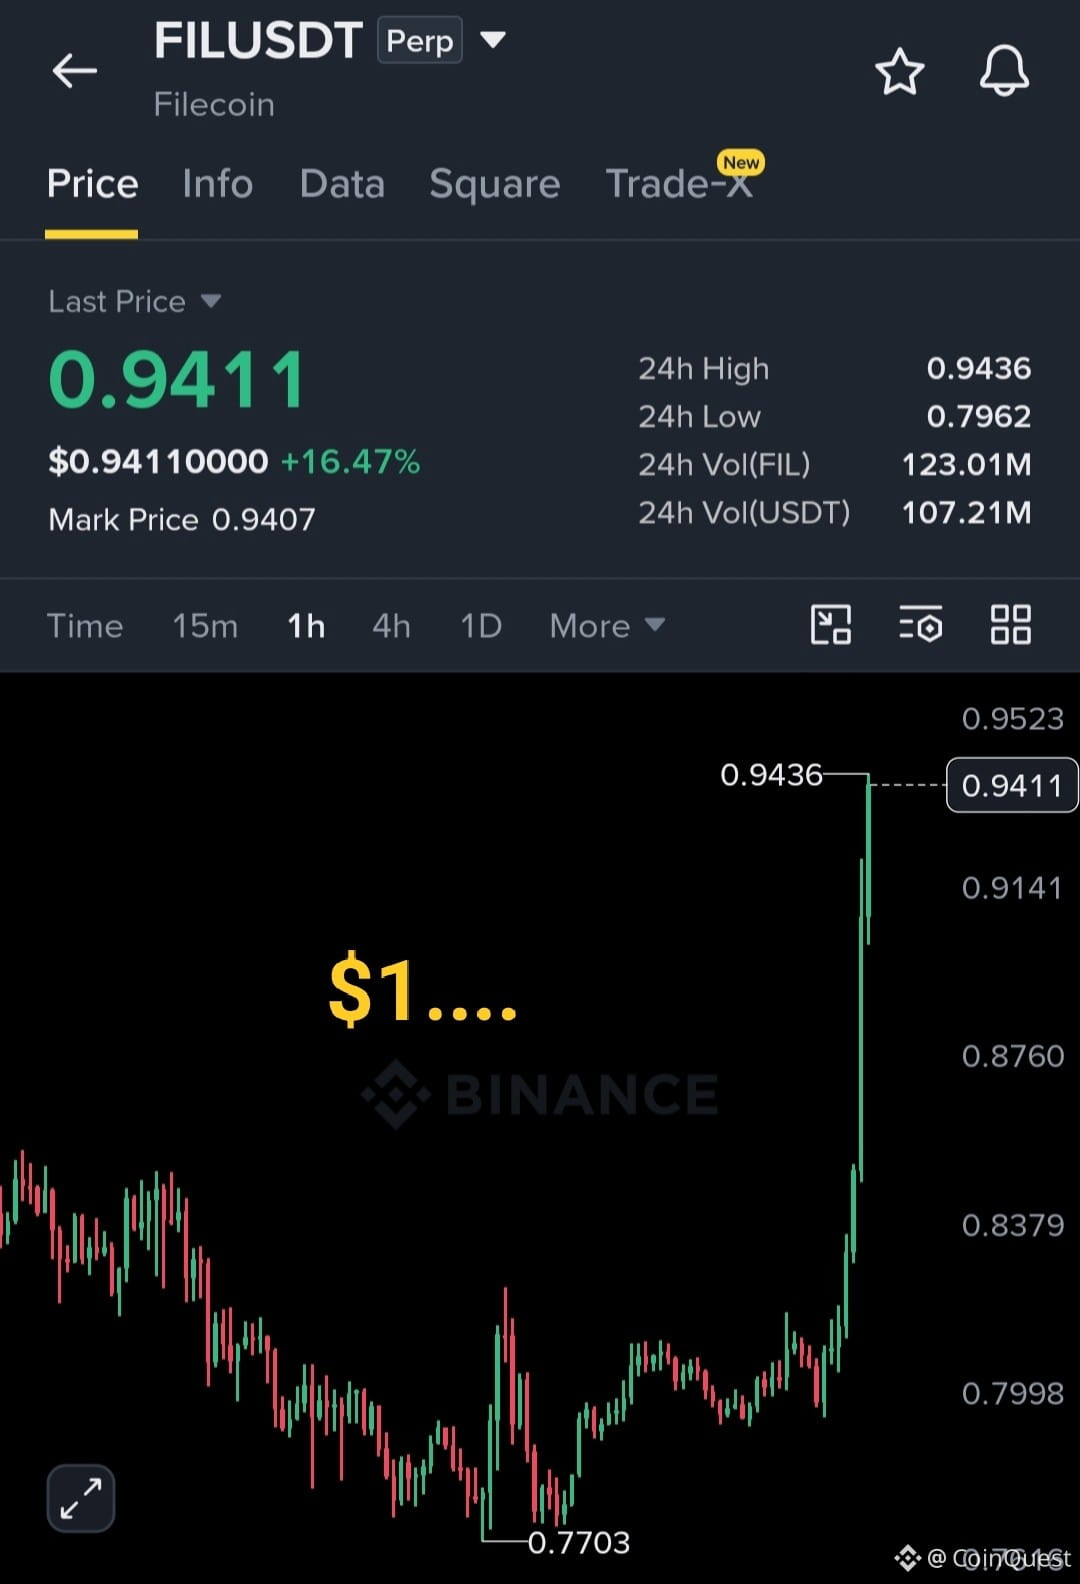
$FIL Going To $1 Sooooon....... Thanks me later ☺️
What do you guys think? Is it really happening?
Trade Now $FIL
{future}(FILUSDT)
#FIL/USDT
$FIL Going To $1 Sooooon....... Thanks me later ☺️
What do you guys think? Is it really happening?
Trade Now $FIL
#FIL/USDT
What do you guys think? Is it really happening?
Trade Now $FIL
#FIL/USDT
1
6
3.1k
·
--
Which One will win in Recent Crypto Market?
1. Day trader
2. Swing Trader
3. Long term traders
4. Investor
Which One will win in Recent Crypto Market?
1. Day trader
2. Swing Trader
3. Long term traders
4. Investor
1. Day trader
2. Swing Trader
3. Long term traders
4. Investor

2
277
·
--
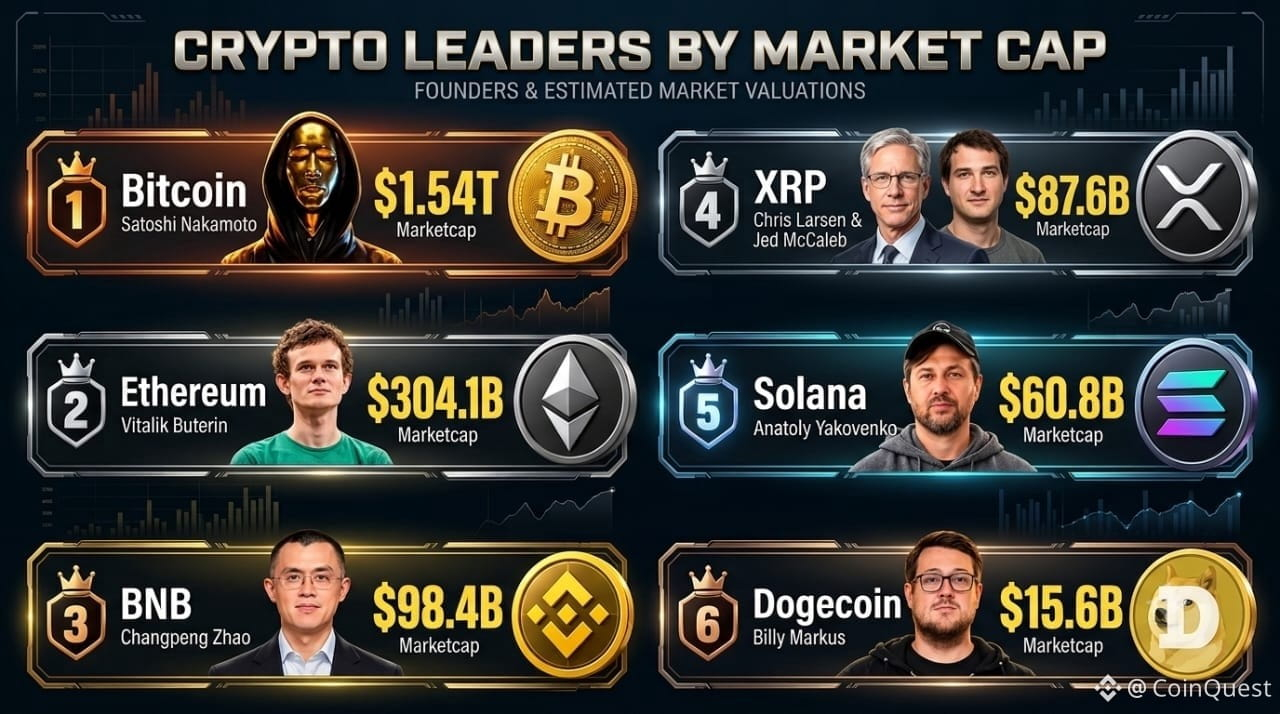
👑 THE BIGGEST NAMES IN CRYPTO
BTC, ETH, BNB, XRP, SOL and DOGE
These projects have already shaped the crypto industry in a big way
But the real question is what happens next 👀
Which one do you think has the biggest future?
🟠 $BTC
🔷 $ETH
🟡 $BNB
⚫ XRP
🟣 SOL
🐶 DOGE
Drop your pick below 🎯
DYOR before investing
#BTC #CZ #satoshiNakamato #biginstitution
👑 THE BIGGEST NAMES IN CRYPTO
BTC, ETH, BNB, XRP, SOL and DOGE
These projects have already shaped the crypto industry in a big way
But the real question is what happens next 👀
Which one do you think has the biggest future?
🟠 $BTC
🔷 $ETH
🟡 $BNB
⚫ XRP
🟣 SOL
🐶 DOGE
Drop your pick below 🎯
DYOR before investing
#BTC #CZ #satoshiNakamato #biginstitution
BTC, ETH, BNB, XRP, SOL and DOGE
These projects have already shaped the crypto industry in a big way
But the real question is what happens next 👀
Which one do you think has the biggest future?
🟠 $BTC
🔷 $ETH
🟡 $BNB
⚫ XRP
🟣 SOL
🐶 DOGE
Drop your pick below 🎯
DYOR before investing
#BTC #CZ #satoshiNakamato #biginstitution
3
803
·
--
Bullish
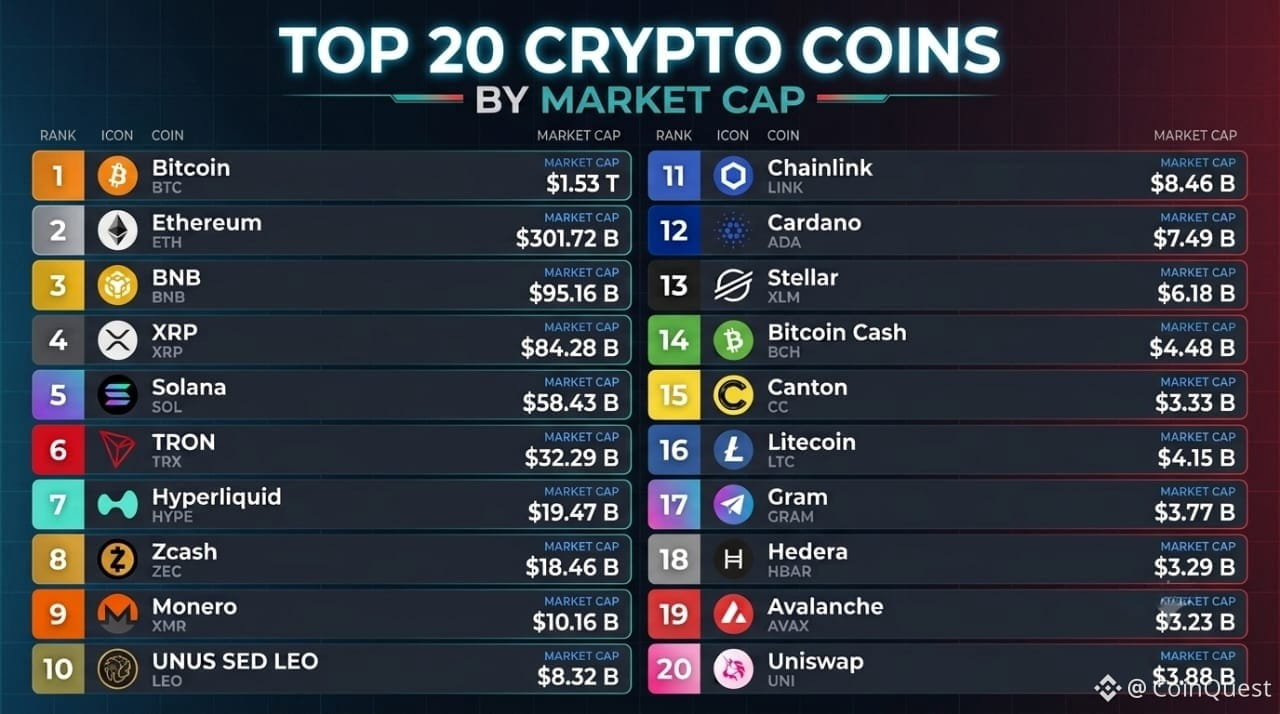
🧠 Who’s running the crypto market right now?
📊 The current Top 20 market cap ranking has some interesting names in the mix.
🥇 $BTC still dominates at #1, followed by $ETH and BNB.
But look deeper 👀
HYPE, $ZEC and XMR are inside the Top 10, while LINK, ADA, XLM and AVAX remain in the Top 20.
🚀 Which coin could climb the fastest next?
#TopCoins #marketcap
🧠 Who’s running the crypto market right now?
📊 The current Top 20 market cap ranking has some interesting names in the mix.
🥇 $BTC still dominates at #1, followed by $ETH and BNB.
But look deeper 👀
HYPE, $ZEC and XMR are inside the Top 10, while LINK, ADA, XLM and AVAX remain in the Top 20.
🚀 Which coin could climb the fastest next?
#TopCoins #marketcap
📊 The current Top 20 market cap ranking has some interesting names in the mix.
🥇 $BTC still dominates at #1, followed by $ETH and BNB.
But look deeper 👀
HYPE, $ZEC and XMR are inside the Top 10, while LINK, ADA, XLM and AVAX remain in the Top 20.
🚀 Which coin could climb the fastest next?
#TopCoins #marketcap
1
2
720
·
--
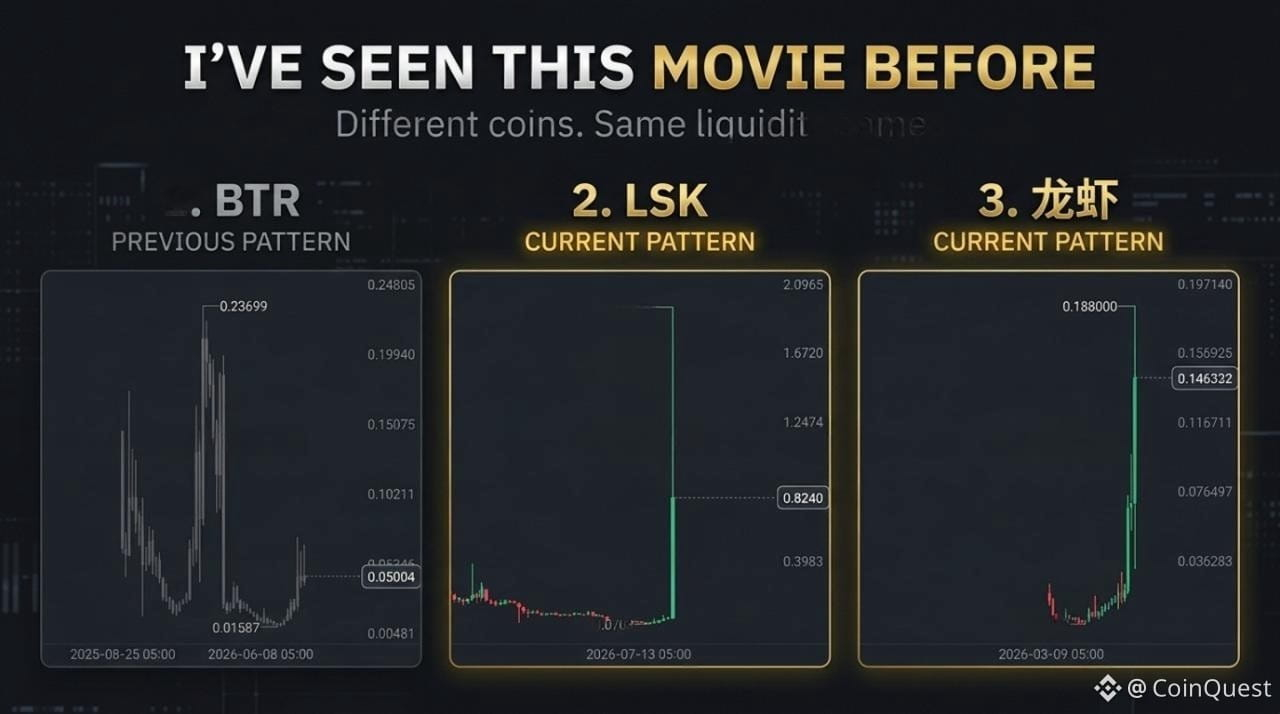
First it was $BTR ...
Now I’m watching $LSK and $龙虾
Different coins, different narratives but the price action is starting to feel very familiar. Massive pumps, technical levels getting ignored, traders piling in because the candle keeps going higher & eventually the liquidity becomes the entire game.
An 800%+ move in a single day isn't normal price discovery. When a coin moves that violently, I don't care how bullish the chart looks on the way up. At some point the people who bought early start taking profit and when big hands start selling into a market full of late buyers, the same volatility that pushed the coin up can work in the opposite direction.
We saw what happened with BTR and $USELESS. I'm not saying LSK or 龙虾 will dump tomorrow. I'm saying these moves don't stay vertical forever.
They can keep pumping. They can ignore technicals for longer than anyone expects. But sooner or later, liquidity shifts.
And when it does, the coins that everyone thought could only go up can suddenly become the top losers.Write it Down💯
Remember this one. Sooner or later...👀
#LSK #BTR #龙虾
First it was $BTR ...
Now I’m watching $LSK and $龙虾
Different coins, different narratives but the price action is starting to feel very familiar. Massive pumps, technical levels getting ignored, traders piling in because the candle keeps going higher & eventually the liquidity becomes the entire game.
An 800%+ move in a single day isn't normal price discovery. When a coin moves that violently, I don't care how bullish the chart looks on the way up. At some point the people who bought early start taking profit and when big hands start selling into a market full of late buyers, the same volatility that pushed the coin up can work in the opposite direction.
We saw what happened with BTR and $USELESS. I'm not saying LSK or 龙虾 will dump tomorrow. I'm saying these moves don't stay vertical forever.
They can keep pumping. They can ignore technicals for longer than anyone expects. But sooner or later, liquidity shifts.
And when it does, the coins that everyone thought could only go up can suddenly become the top losers.Write it Down💯
Remember this one. Sooner or later...👀
#LSK #BTR #龙虾
Now I’m watching $LSK and $龙虾
Different coins, different narratives but the price action is starting to feel very familiar. Massive pumps, technical levels getting ignored, traders piling in because the candle keeps going higher & eventually the liquidity becomes the entire game.
An 800%+ move in a single day isn't normal price discovery. When a coin moves that violently, I don't care how bullish the chart looks on the way up. At some point the people who bought early start taking profit and when big hands start selling into a market full of late buyers, the same volatility that pushed the coin up can work in the opposite direction.
We saw what happened with BTR and $USELESS. I'm not saying LSK or 龙虾 will dump tomorrow. I'm saying these moves don't stay vertical forever.
They can keep pumping. They can ignore technicals for longer than anyone expects. But sooner or later, liquidity shifts.
And when it does, the coins that everyone thought could only go up can suddenly become the top losers.Write it Down💯
Remember this one. Sooner or later...👀
#LSK #BTR #龙虾
2
1.6k
·
--
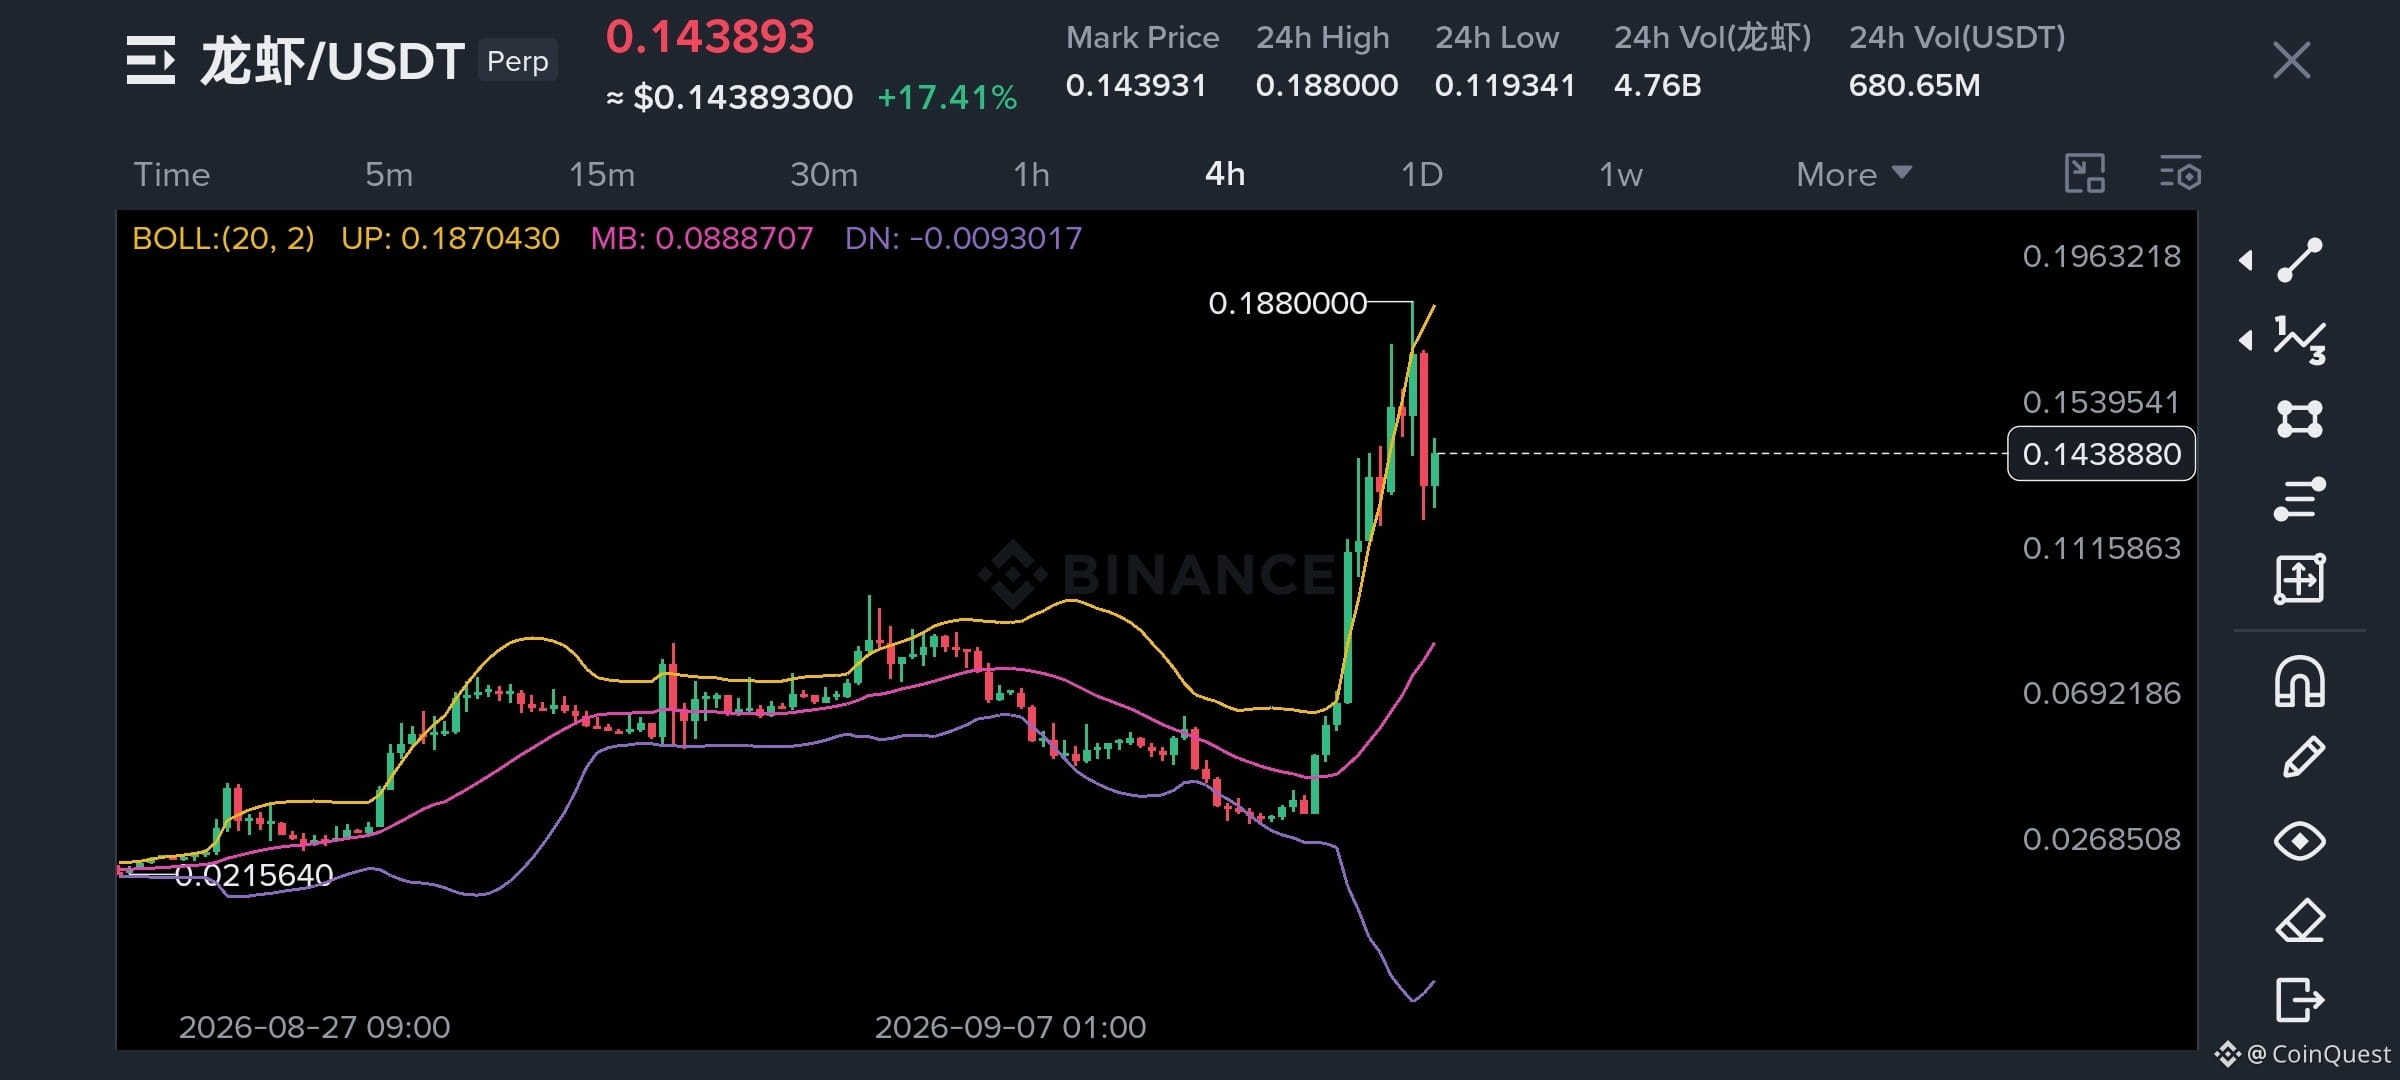
$龙虾 has gone from a tiny market cap to a completely different game🤯
This is the part where I get cautious. When a meme coin moves this violently, the biggest risk isn't missing another green candle. It's assuming the same momentum will continue forever.
From around a $16M market cap to well over $100M at the peak, the move has been insane. But once the money starts leaving, the downside can be just as violent as the upside.
I wouldn't be surprised if this becomes one of those charts where everyone wants to buy the dip, only to realize the dip hasn't finished yet.
Maybe $龙虾 keeps running. Maybe this is the last dance.
Either way, after a move like this, I'm watching the exits much more closely than the next entry 👀
#DYOR🟢
$龙虾 has gone from a tiny market cap to a completely different game🤯
This is the part where I get cautious. When a meme coin moves this violently, the biggest risk isn't missing another green candle. It's assuming the same momentum will continue forever.
From around a $16M market cap to well over $100M at the peak, the move has been insane. But once the money starts leaving, the downside can be just as violent as the upside.
I wouldn't be surprised if this becomes one of those charts where everyone wants to buy the dip, only to realize the dip hasn't finished yet.
Maybe $龙虾 keeps running. Maybe this is the last dance.
Either way, after a move like this, I'm watching the exits much more closely than the next entry 👀
#DYOR🟢
This is the part where I get cautious. When a meme coin moves this violently, the biggest risk isn't missing another green candle. It's assuming the same momentum will continue forever.
From around a $16M market cap to well over $100M at the peak, the move has been insane. But once the money starts leaving, the downside can be just as violent as the upside.
I wouldn't be surprised if this becomes one of those charts where everyone wants to buy the dip, only to realize the dip hasn't finished yet.
Maybe $龙虾 keeps running. Maybe this is the last dance.
Either way, after a move like this, I'm watching the exits much more closely than the next entry 👀
#DYOR🟢
802
·
--
Bearish
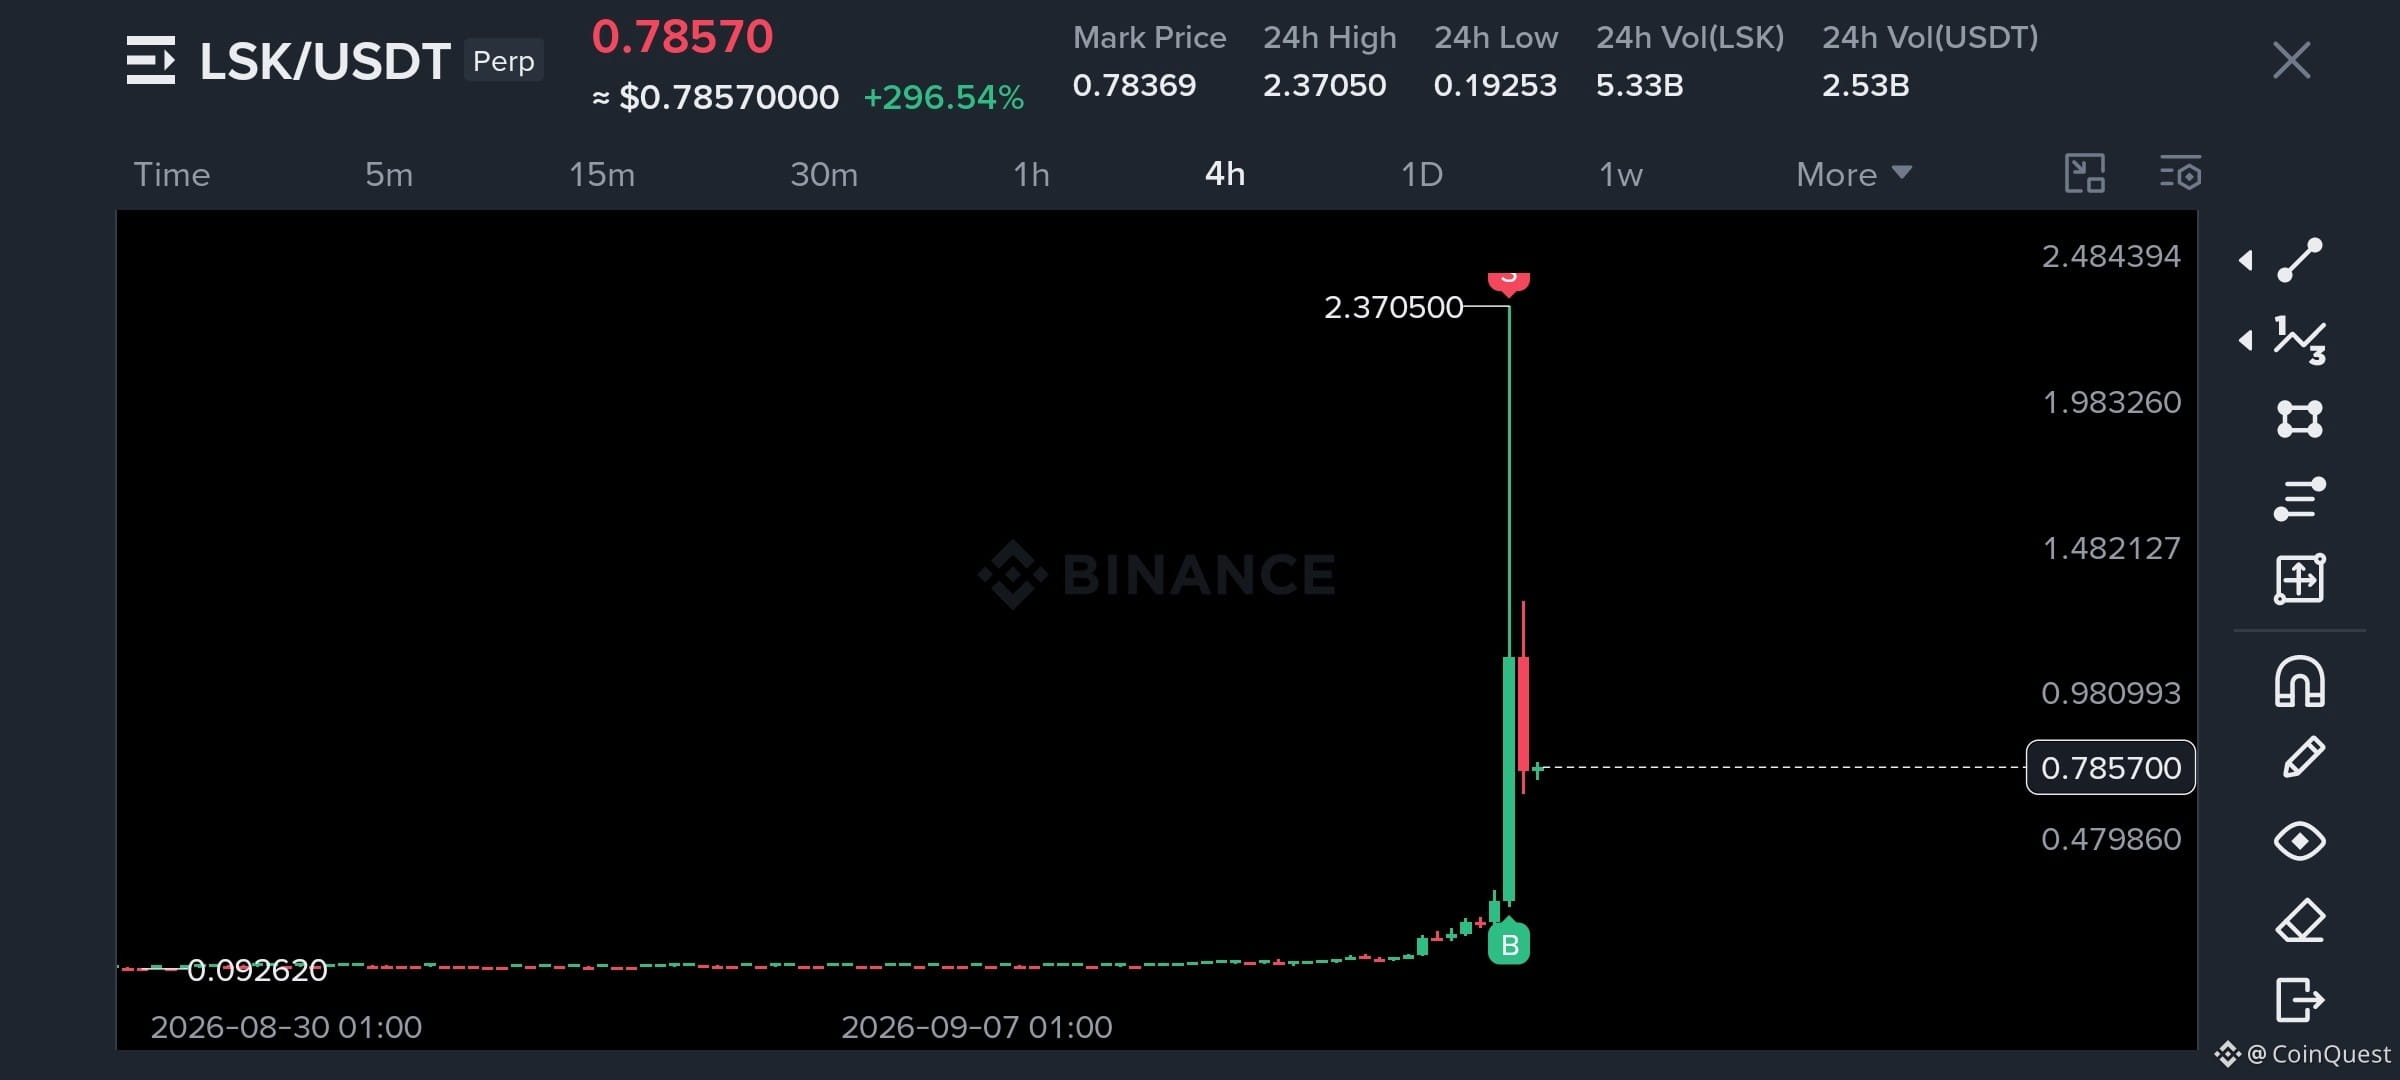
$LSK just went through the kind of move where chasing the next candle can become dangerous 👀
After a vertical move like this, I expect volatility to stay extremely high. I wouldn't be surprised to see a deeper pullback before the next serious bullish move. The $0.35 area is the level I’m watching if the current momentum finally starts unwinding.
But I don't think the story ends with one dump either. If price eventually finds a base, another strong bullish candle could trigger a fresh wave of short squeezes.
The important part is timing. After a move this aggressive, I’d rather let the market cool down than blindly short every red candle or chase every green one.
LSK has already shown that normal technical levels can get ignored when liquidity and positioning take over. Now I want to see where the volatility finally settles.
#DYOR🟢
$LSK just went through the kind of move where chasing the next candle can become dangerous 👀
After a vertical move like this, I expect volatility to stay extremely high. I wouldn't be surprised to see a deeper pullback before the next serious bullish move. The $0.35 area is the level I’m watching if the current momentum finally starts unwinding.
But I don't think the story ends with one dump either. If price eventually finds a base, another strong bullish candle could trigger a fresh wave of short squeezes.
The important part is timing. After a move this aggressive, I’d rather let the market cool down than blindly short every red candle or chase every green one.
LSK has already shown that normal technical levels can get ignored when liquidity and positioning take over. Now I want to see where the volatility finally settles.
#DYOR🟢
After a vertical move like this, I expect volatility to stay extremely high. I wouldn't be surprised to see a deeper pullback before the next serious bullish move. The $0.35 area is the level I’m watching if the current momentum finally starts unwinding.
But I don't think the story ends with one dump either. If price eventually finds a base, another strong bullish candle could trigger a fresh wave of short squeezes.
The important part is timing. After a move this aggressive, I’d rather let the market cool down than blindly short every red candle or chase every green one.
LSK has already shown that normal technical levels can get ignored when liquidity and positioning take over. Now I want to see where the volatility finally settles.
#DYOR🟢
1
2
2.2k
·
--
Bullish
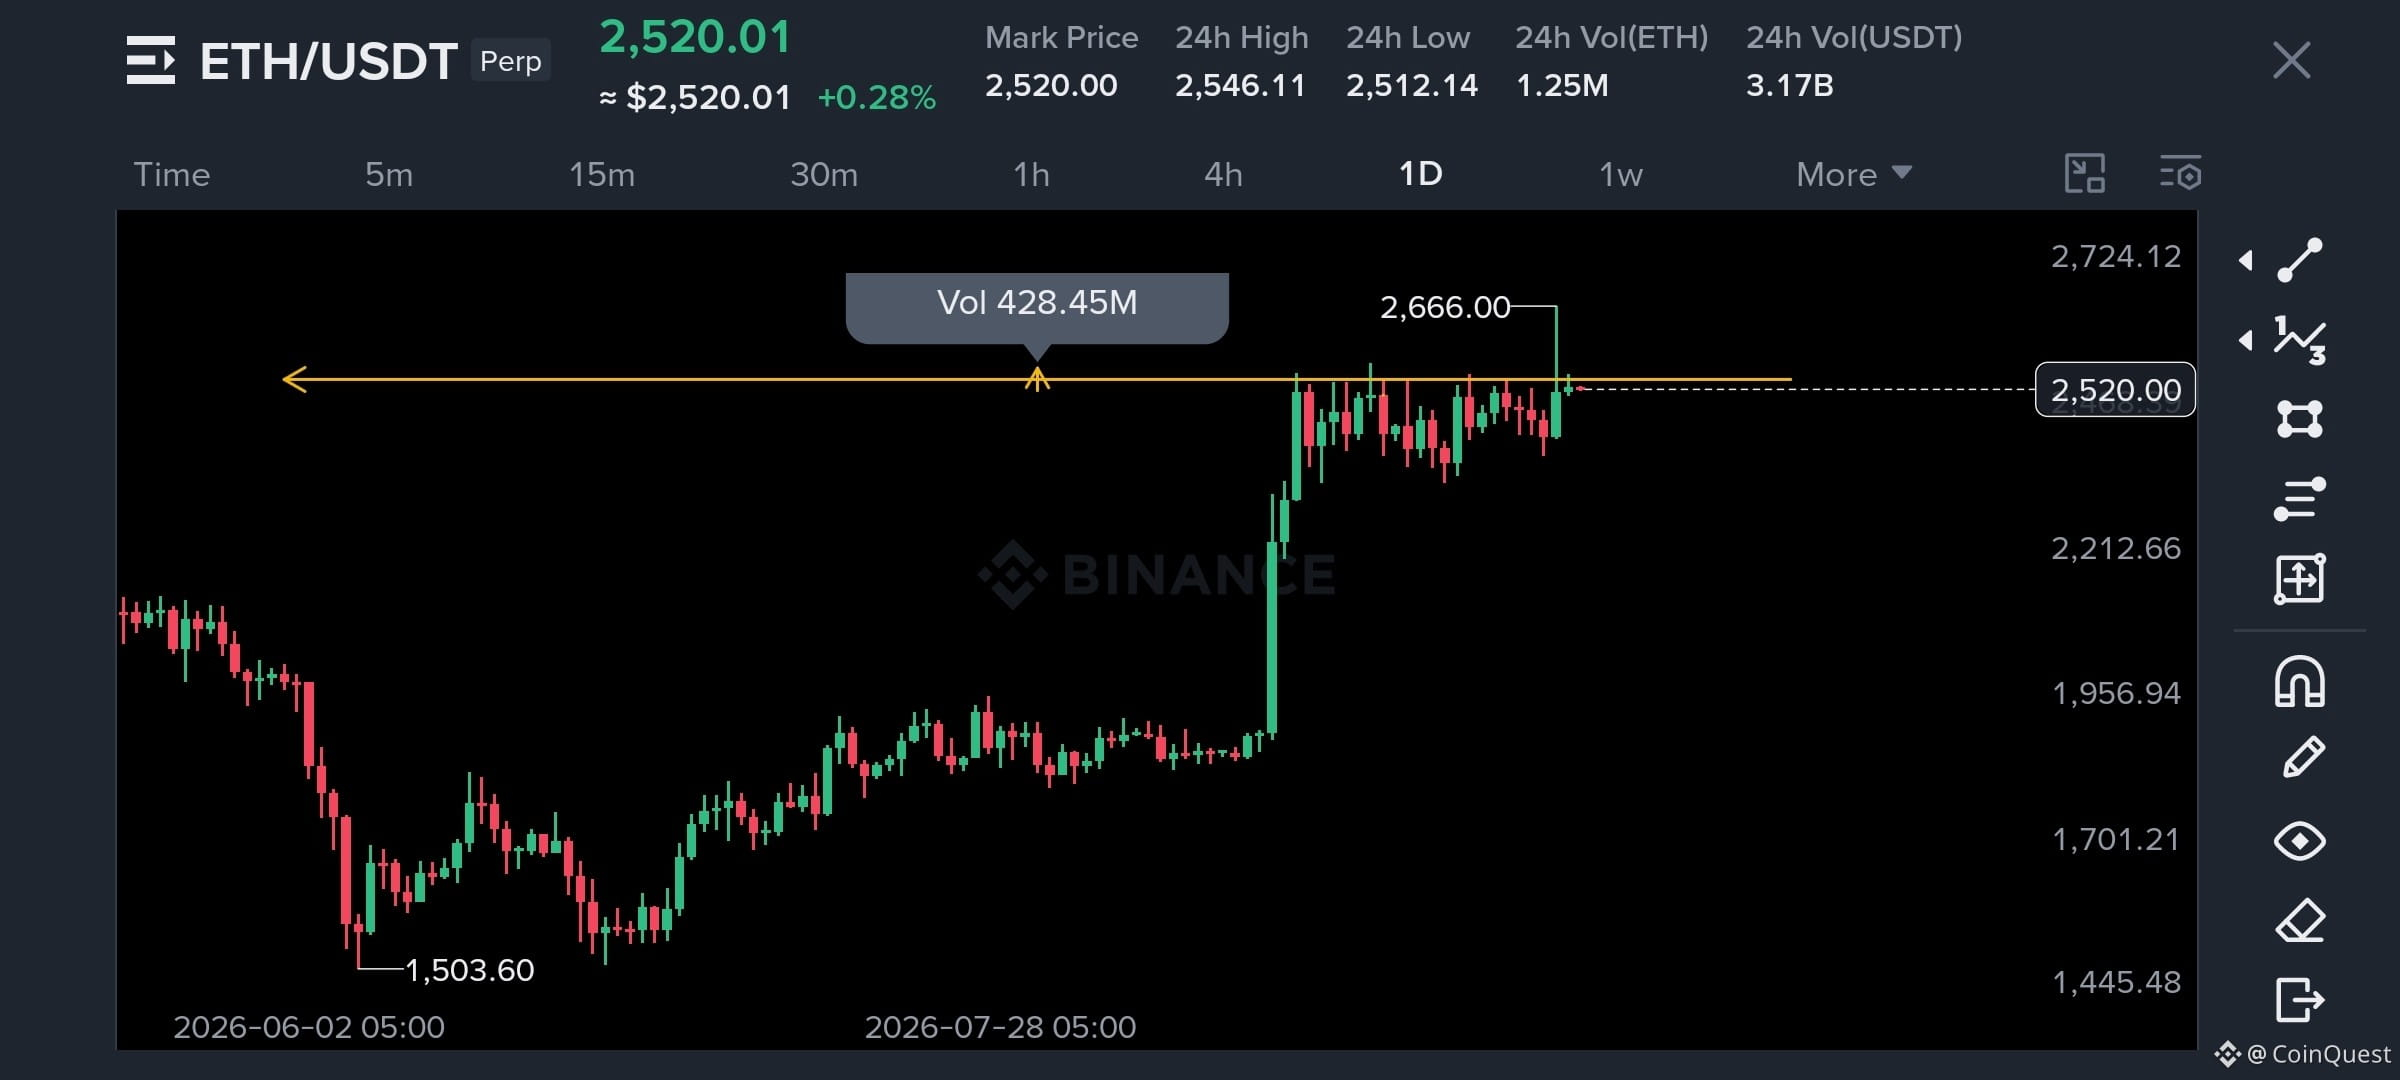
$ETH finally pushed back above $2,600 after months away from that level 👀
The move was fast with ETH reaching around $2,650 to $2,670 on September 11, but now the interesting part starts. Price has pulled back toward $2,500, so I don't care much about the wick above $2,600. I want to see whether buyers can actually reclaim that level and hold it.
For me, $2,500 is the first level to defend. If ETH holds above it and gets another clean push through $2,600, that would make the breakout much more convincing. If $2,500 starts failing, then the whole reclaim starts looking a lot less impressive.
ETH spent months below $2,600. Now it has to prove that the level can become support not just another resistance wick.
Do you think ETH holds $2,500 & takes $2,600 again? 👀
$ETH finally pushed back above $2,600 after months away from that level 👀
The move was fast with ETH reaching around $2,650 to $2,670 on September 11, but now the interesting part starts. Price has pulled back toward $2,500, so I don't care much about the wick above $2,600. I want to see whether buyers can actually reclaim that level and hold it.
For me, $2,500 is the first level to defend. If ETH holds above it and gets another clean push through $2,600, that would make the breakout much more convincing. If $2,500 starts failing, then the whole reclaim starts looking a lot less impressive.
ETH spent months below $2,600. Now it has to prove that the level can become support not just another resistance wick.
Do you think ETH holds $2,500 & takes $2,600 again? 👀
The move was fast with ETH reaching around $2,650 to $2,670 on September 11, but now the interesting part starts. Price has pulled back toward $2,500, so I don't care much about the wick above $2,600. I want to see whether buyers can actually reclaim that level and hold it.
For me, $2,500 is the first level to defend. If ETH holds above it and gets another clean push through $2,600, that would make the breakout much more convincing. If $2,500 starts failing, then the whole reclaim starts looking a lot less impressive.
ETH spent months below $2,600. Now it has to prove that the level can become support not just another resistance wick.
Do you think ETH holds $2,500 & takes $2,600 again? 👀
2
4
3.6k
·
--
Bearish
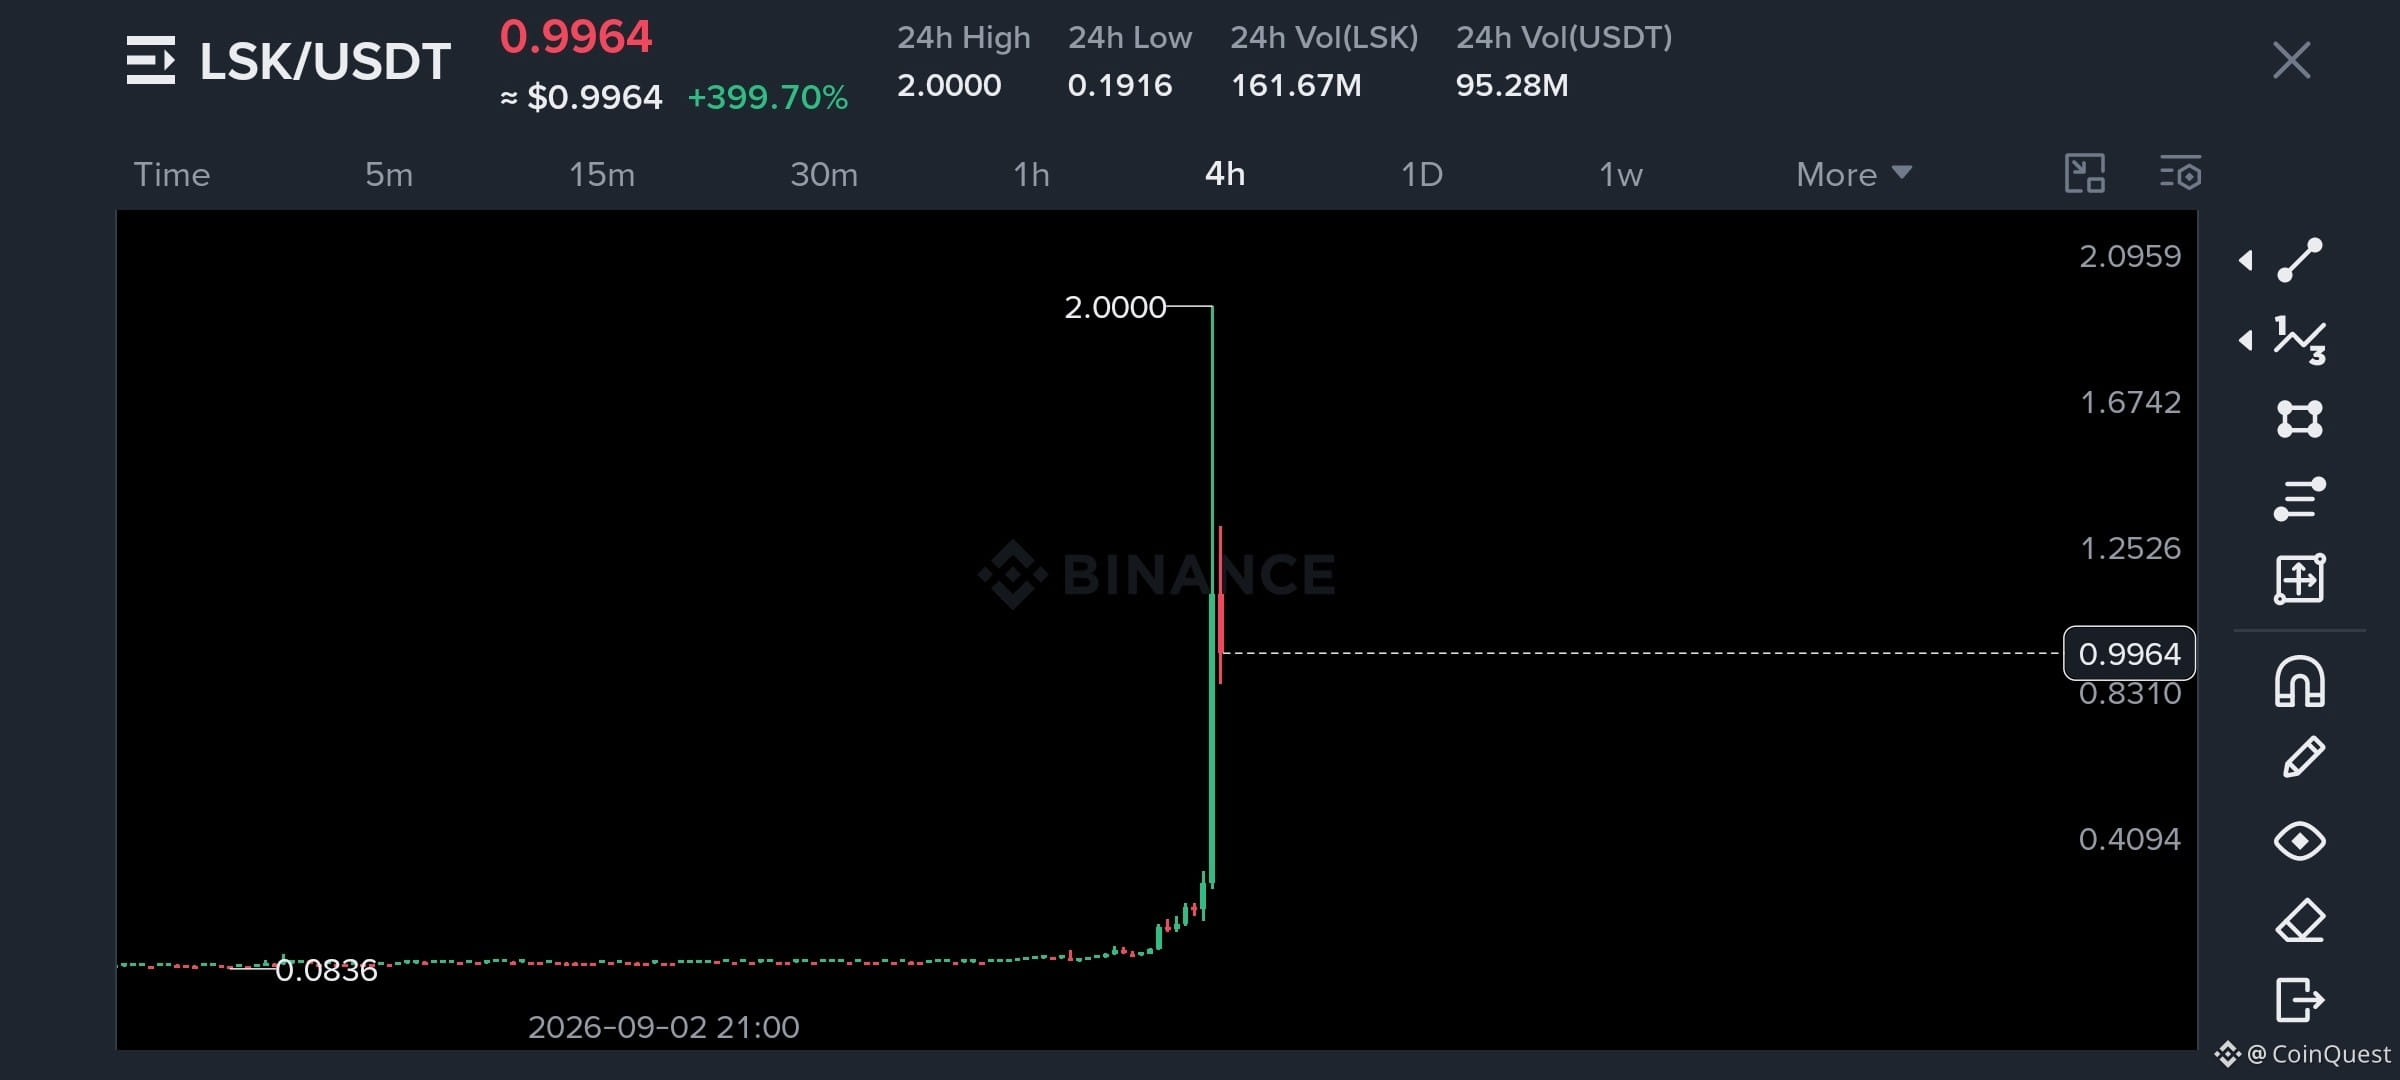
Mark this $LSK call📑
I think $LSK can end up among the top losers tomorrow. Right now it looks like the market is ignoring normal technical levels and simply chasing liquidity and volatility. That can work for a while but it usually doesn't last forever.
I've already learned this the hard way after trying to short LSK too early. I’m not making the same mistake again. I’m watching the move expand first because once the liquidity dries up, the same crowd chasing the upside can become the exit liquidity.
At the end, I think LSK risks following the same kind of path we’ve seen with $BTR . Maybe I'm early but mark this one and let's see what the chart says tomorrow 👀
{future}(LSKUSDT)
Mark this $LSK call📑
I think $LSK can end up among the top losers tomorrow. Right now it looks like the market is ignoring normal technical levels and simply chasing liquidity and volatility. That can work for a while but it usually doesn't last forever.
I've already learned this the hard way after trying to short LSK too early. I’m not making the same mistake again. I’m watching the move expand first because once the liquidity dries up, the same crowd chasing the upside can become the exit liquidity.
At the end, I think LSK risks following the same kind of path we’ve seen with $BTR . Maybe I'm early but mark this one and let's see what the chart says tomorrow 👀
I think $LSK can end up among the top losers tomorrow. Right now it looks like the market is ignoring normal technical levels and simply chasing liquidity and volatility. That can work for a while but it usually doesn't last forever.
I've already learned this the hard way after trying to short LSK too early. I’m not making the same mistake again. I’m watching the move expand first because once the liquidity dries up, the same crowd chasing the upside can become the exit liquidity.
At the end, I think LSK risks following the same kind of path we’ve seen with $BTR . Maybe I'm early but mark this one and let's see what the chart says tomorrow 👀
5
1
1.7k
·
--
Bullish
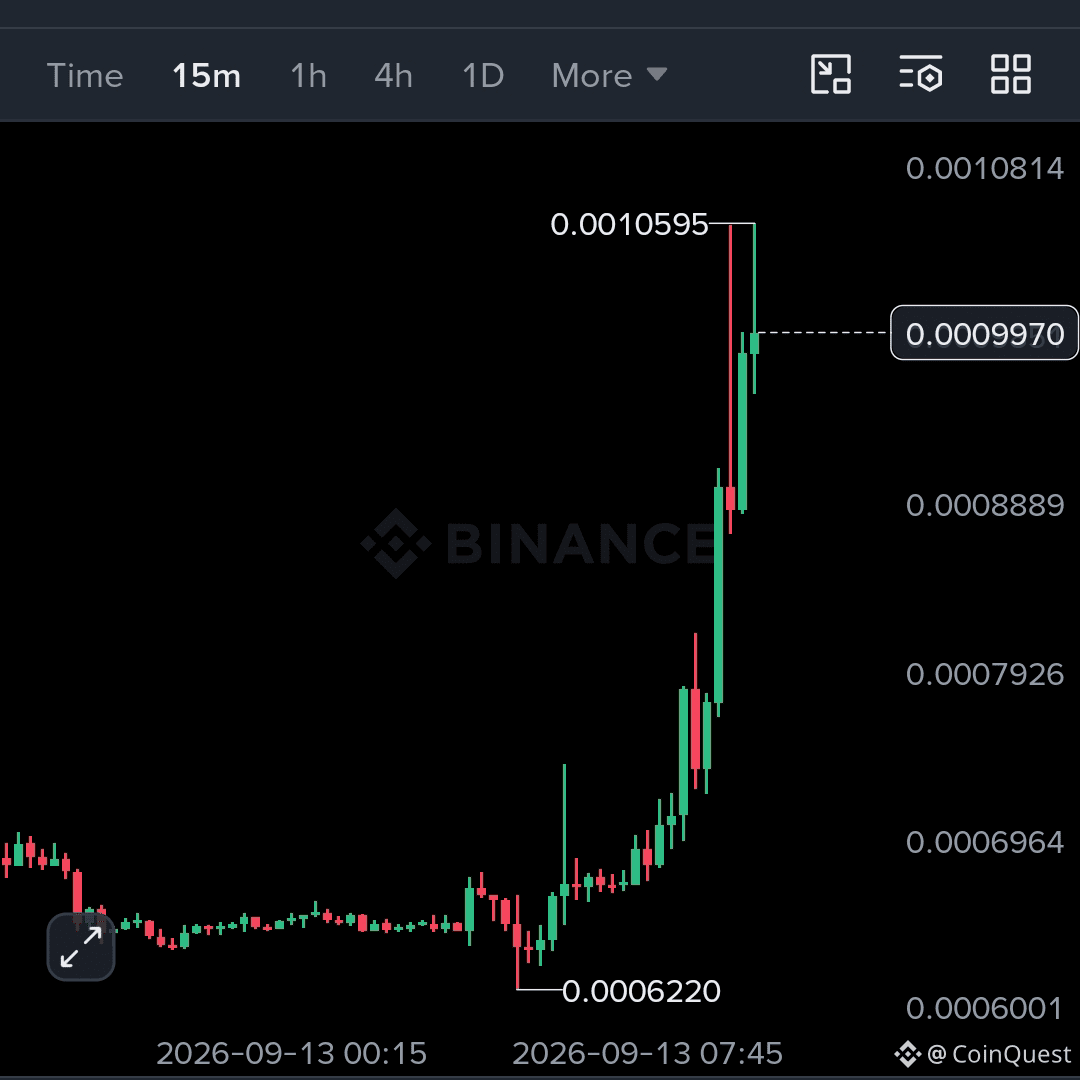
Watching $VTHO closely because its structure is starting to remind me of what happened with $LSK
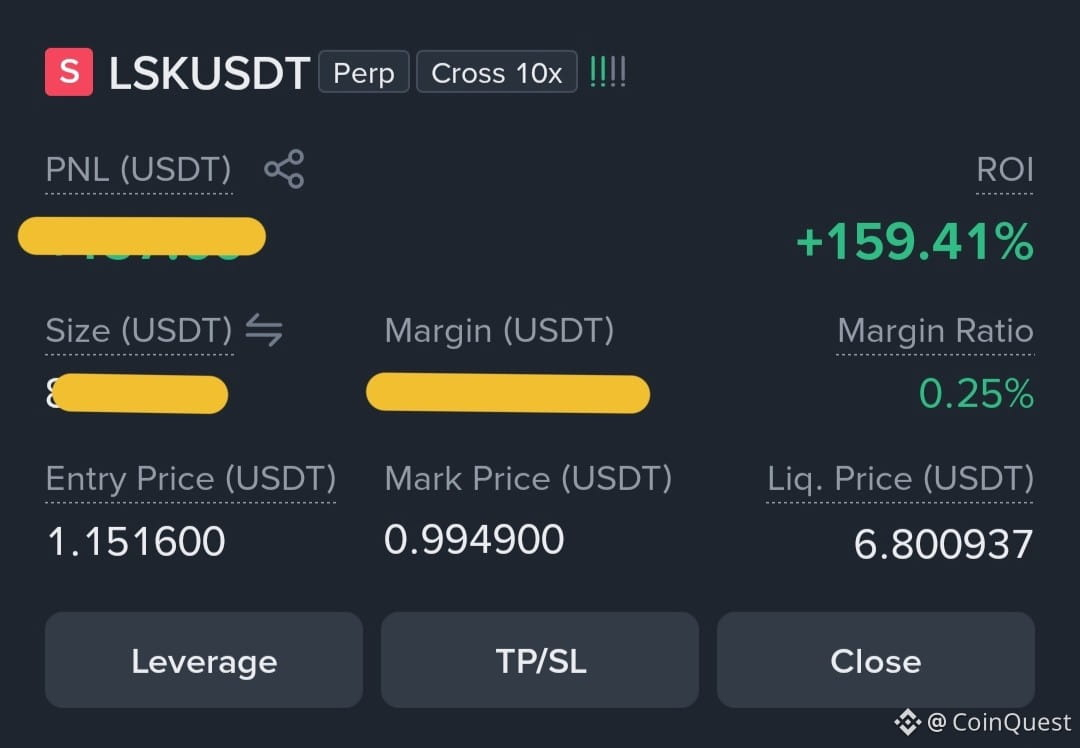
I tried shorting $LSK and failed badly 😭 I’m still in profit now mainly because I kept DCAing, but that trade taught me something I don't want to repeat. Sometimes the chart stops behaving like the usual technical setup. Volatility takes over, fundamentals stop mattering in the short term, and trying to short every pump can become a very expensive game.
My lesson from LSL is simple: don't try to climb the long short ladder when a coin is moving like this. If the market is rewarding one side aggressively, let it grow and wait for the right environment instead of forcing a trade against it.
The more crowded one side becomes, the more interesting the punishment can get. I'm not saying VTHO can't dump. I'm saying I don't want to be early trying to prove it should.
For now, I'm watching VTHO rather than fighting it 👀
Trade Here👇
{future}(VTHOUSDT)
Watching $VTHO closely because its structure is starting to remind me of what happened with $LSK
I tried shorting $LSK and failed badly 😭 I’m still in profit now mainly because I kept DCAing, but that trade taught me something I don't want to repeat. Sometimes the chart stops behaving like the usual technical setup. Volatility takes over, fundamentals stop mattering in the short term, and trying to short every pump can become a very expensive game.
My lesson from LSL is simple: don't try to climb the long short ladder when a coin is moving like this. If the market is rewarding one side aggressively, let it grow and wait for the right environment instead of forcing a trade against it.
The more crowded one side becomes, the more interesting the punishment can get. I'm not saying VTHO can't dump. I'm saying I don't want to be early trying to prove it should.
For now, I'm watching VTHO rather than fighting it 👀
Trade Here👇
I tried shorting $LSK and failed badly 😭 I’m still in profit now mainly because I kept DCAing, but that trade taught me something I don't want to repeat. Sometimes the chart stops behaving like the usual technical setup. Volatility takes over, fundamentals stop mattering in the short term, and trying to short every pump can become a very expensive game.
My lesson from LSL is simple: don't try to climb the long short ladder when a coin is moving like this. If the market is rewarding one side aggressively, let it grow and wait for the right environment instead of forcing a trade against it.
The more crowded one side becomes, the more interesting the punishment can get. I'm not saying VTHO can't dump. I'm saying I don't want to be early trying to prove it should.
For now, I'm watching VTHO rather than fighting it 👀
Trade Here👇
1
1
731
·
--
18
5
9.6k
·
--
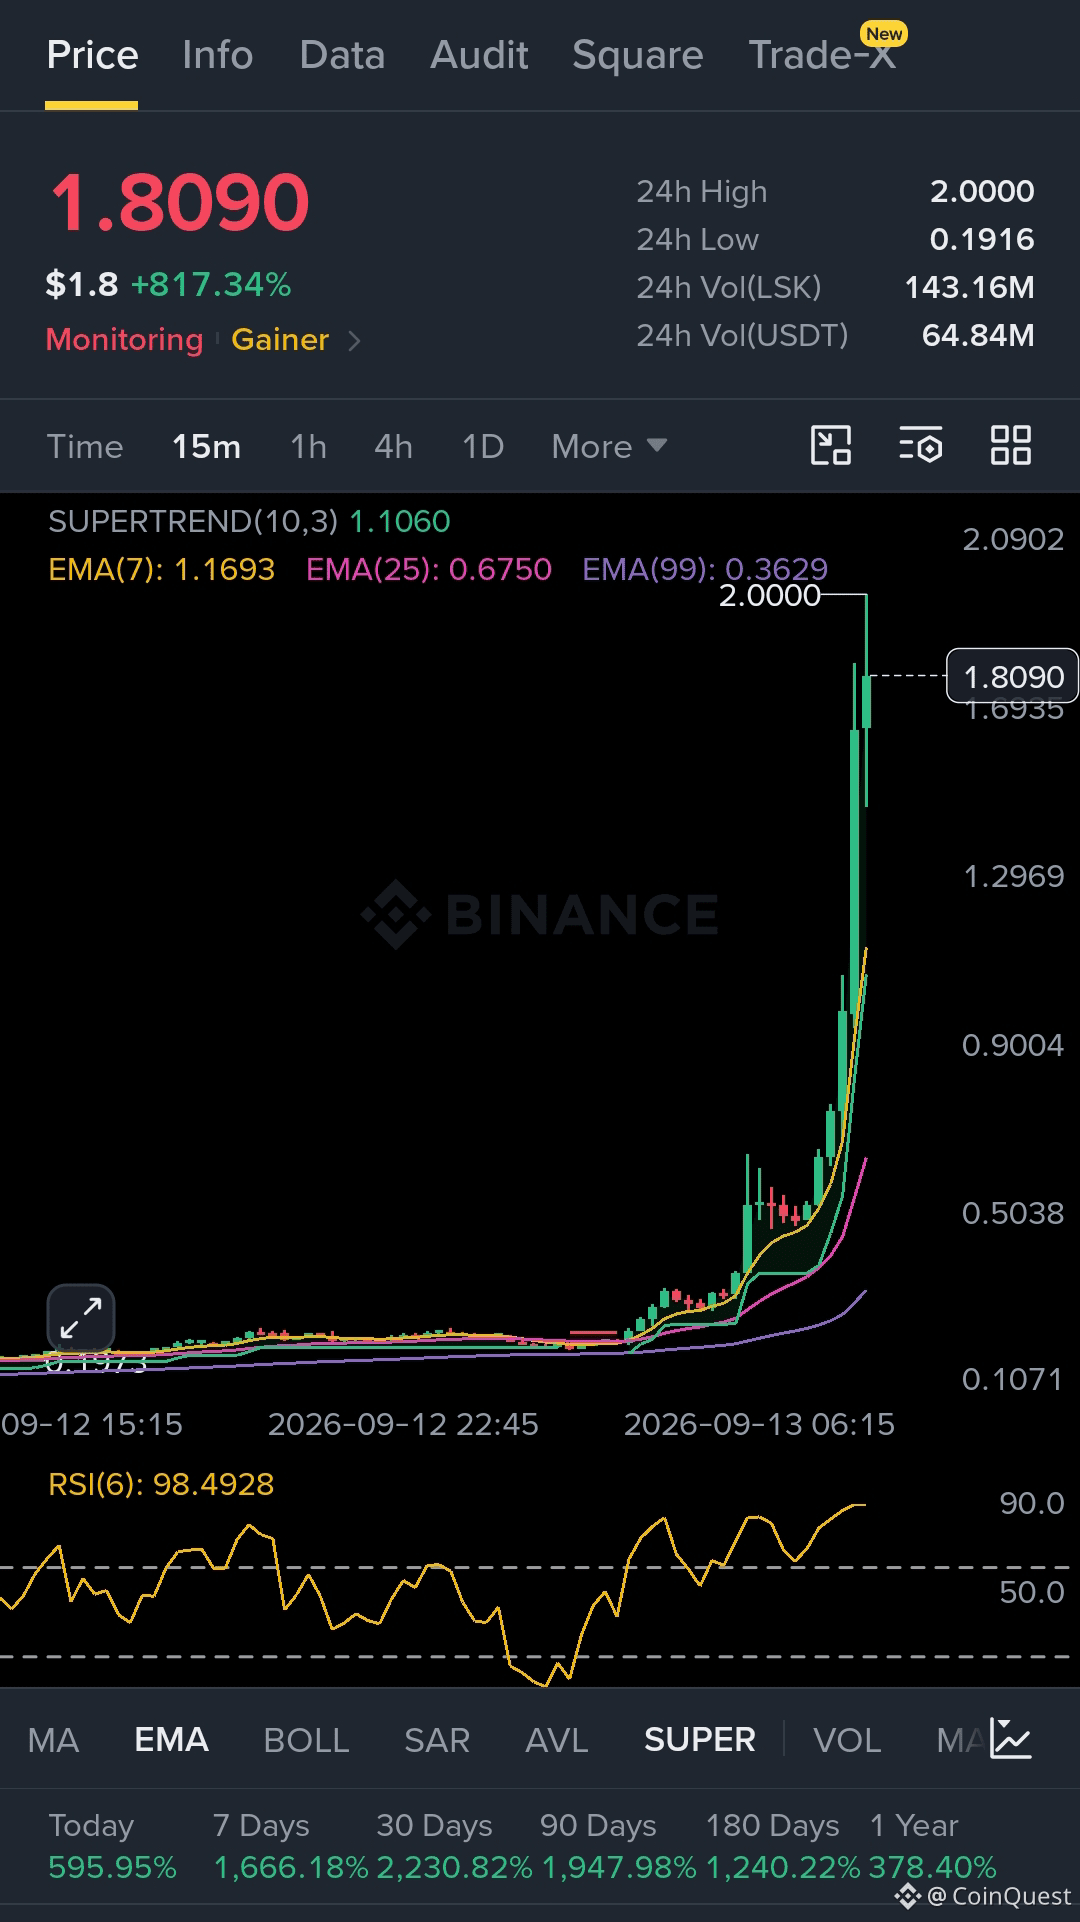
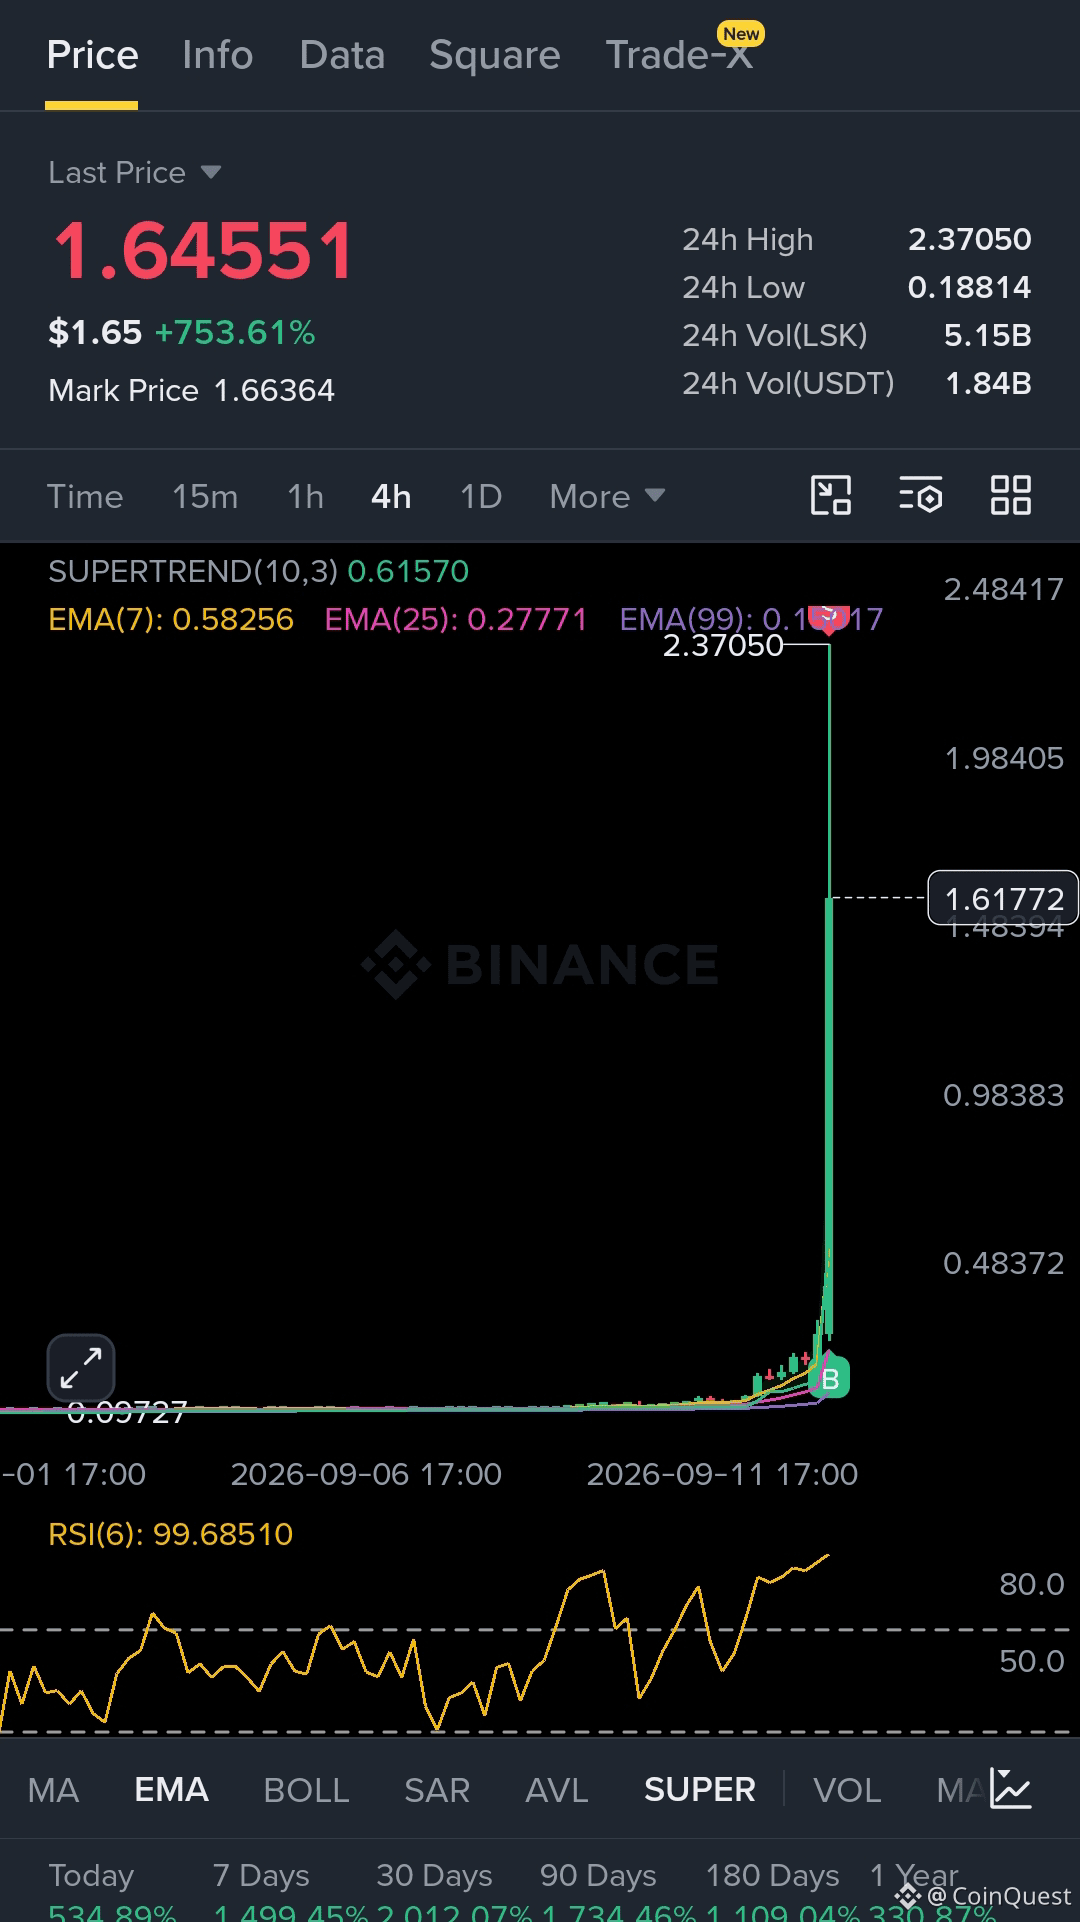
$LSK really said 0.37 to 2.37 and barely gave anyone time to process it 😭
I actually own this trade, and watching a position move like this is a completely different feeling. The crazy part isn't just the 500%+ move. It’s how quickly the chart went from looking like a normal setup to full blown price discovery.
This is also why I keep saying you don't need to catch every move in crypto. You just need to catch a few good ones and have the patience to let them run when the chart gives you a reason.
$LSK holders, how are we feeling right now? 😂
My liquidity is good ,soI am holding it😭
{future}(LSKUSDT)
$LSK really said 0.37 to 2.37 and barely gave anyone time to process it 😭
I actually own this trade, and watching a position move like this is a completely different feeling. The crazy part isn't just the 500%+ move. It’s how quickly the chart went from looking like a normal setup to full blown price discovery.
This is also why I keep saying you don't need to catch every move in crypto. You just need to catch a few good ones and have the patience to let them run when the chart gives you a reason.
$LSK holders, how are we feeling right now? 😂
My liquidity is good ,soI am holding it😭
I actually own this trade, and watching a position move like this is a completely different feeling. The crazy part isn't just the 500%+ move. It’s how quickly the chart went from looking like a normal setup to full blown price discovery.
This is also why I keep saying you don't need to catch every move in crypto. You just need to catch a few good ones and have the patience to let them run when the chart gives you a reason.
$LSK holders, how are we feeling right now? 😂
My liquidity is good ,soI am holding it😭
1
1
2.2k
·
--
Bullish
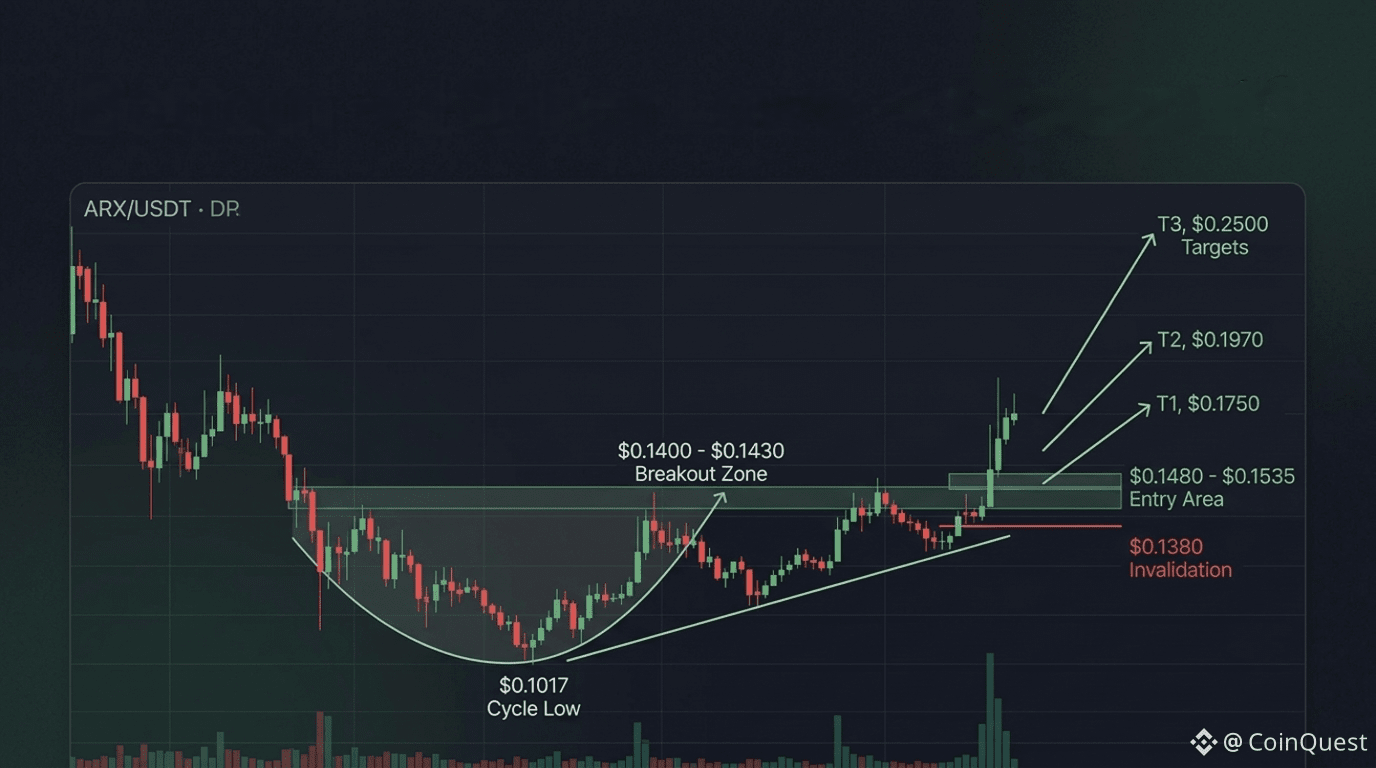
$ARX has spent months getting sold & now the chart is starting to look very different..
After bottoming around $0.1017, price has been printing higher lows and building a rounded accumulation structure. The daily chart then broke out of the local $0.1400 to $0.1430 range with buyers pushing price toward $0.1750.
Now comes the part I care about.
I don't want to chase the move at the highs. I'm watching $0.1480 to $0.1535 for a pullback, with $0.1380 as the invalidation. If buyers defend the breakout structure, $0.1750 is the first target, followed by $0.1970 and potentially $0.2500 if the macro breakout expands.
The interesting part isn't that ARX is bullish.
It's that the chart has gone from lower lows to higher lows & sellers haven't been able to push price back into the old range.
If $0.1380 breaks on a daily close, this setup is off.
For now, I'm watching the pullback rather than chasing the pump.
{future}(ARXUSDT)
#ARX
$ARX has spent months getting sold & now the chart is starting to look very different..
After bottoming around $0.1017, price has been printing higher lows and building a rounded accumulation structure. The daily chart then broke out of the local $0.1400 to $0.1430 range with buyers pushing price toward $0.1750.
Now comes the part I care about.
I don't want to chase the move at the highs. I'm watching $0.1480 to $0.1535 for a pullback, with $0.1380 as the invalidation. If buyers defend the breakout structure, $0.1750 is the first target, followed by $0.1970 and potentially $0.2500 if the macro breakout expands.
The interesting part isn't that ARX is bullish.
It's that the chart has gone from lower lows to higher lows & sellers haven't been able to push price back into the old range.
If $0.1380 breaks on a daily close, this setup is off.
For now, I'm watching the pullback rather than chasing the pump.
#ARX
After bottoming around $0.1017, price has been printing higher lows and building a rounded accumulation structure. The daily chart then broke out of the local $0.1400 to $0.1430 range with buyers pushing price toward $0.1750.
Now comes the part I care about.
I don't want to chase the move at the highs. I'm watching $0.1480 to $0.1535 for a pullback, with $0.1380 as the invalidation. If buyers defend the breakout structure, $0.1750 is the first target, followed by $0.1970 and potentially $0.2500 if the macro breakout expands.
The interesting part isn't that ARX is bullish.
It's that the chart has gone from lower lows to higher lows & sellers haven't been able to push price back into the old range.
If $0.1380 breaks on a daily close, this setup is off.
For now, I'm watching the pullback rather than chasing the pump.
#ARX
1
946
·
--
Bearish
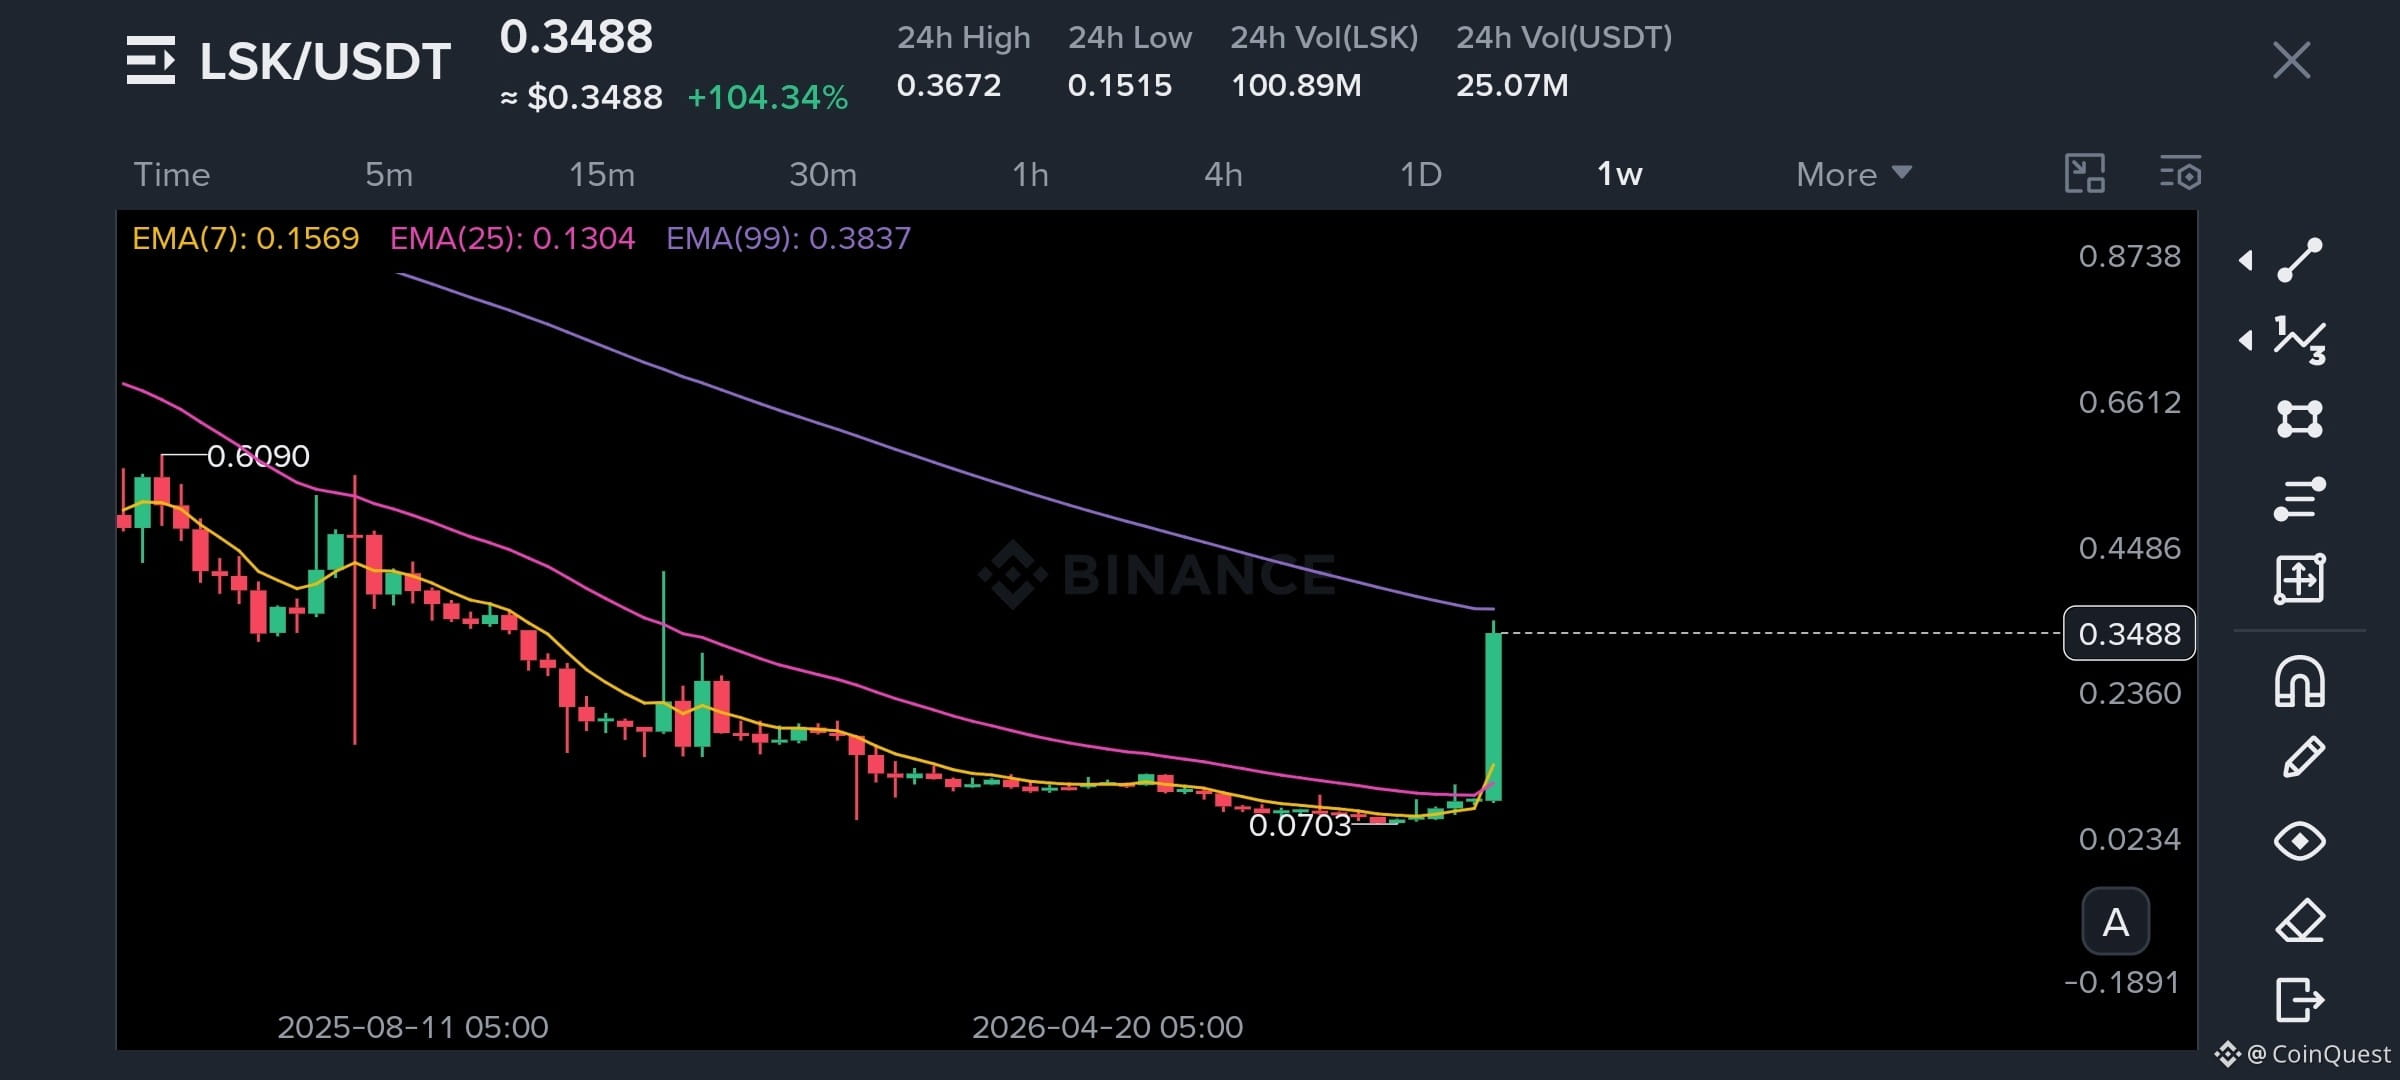
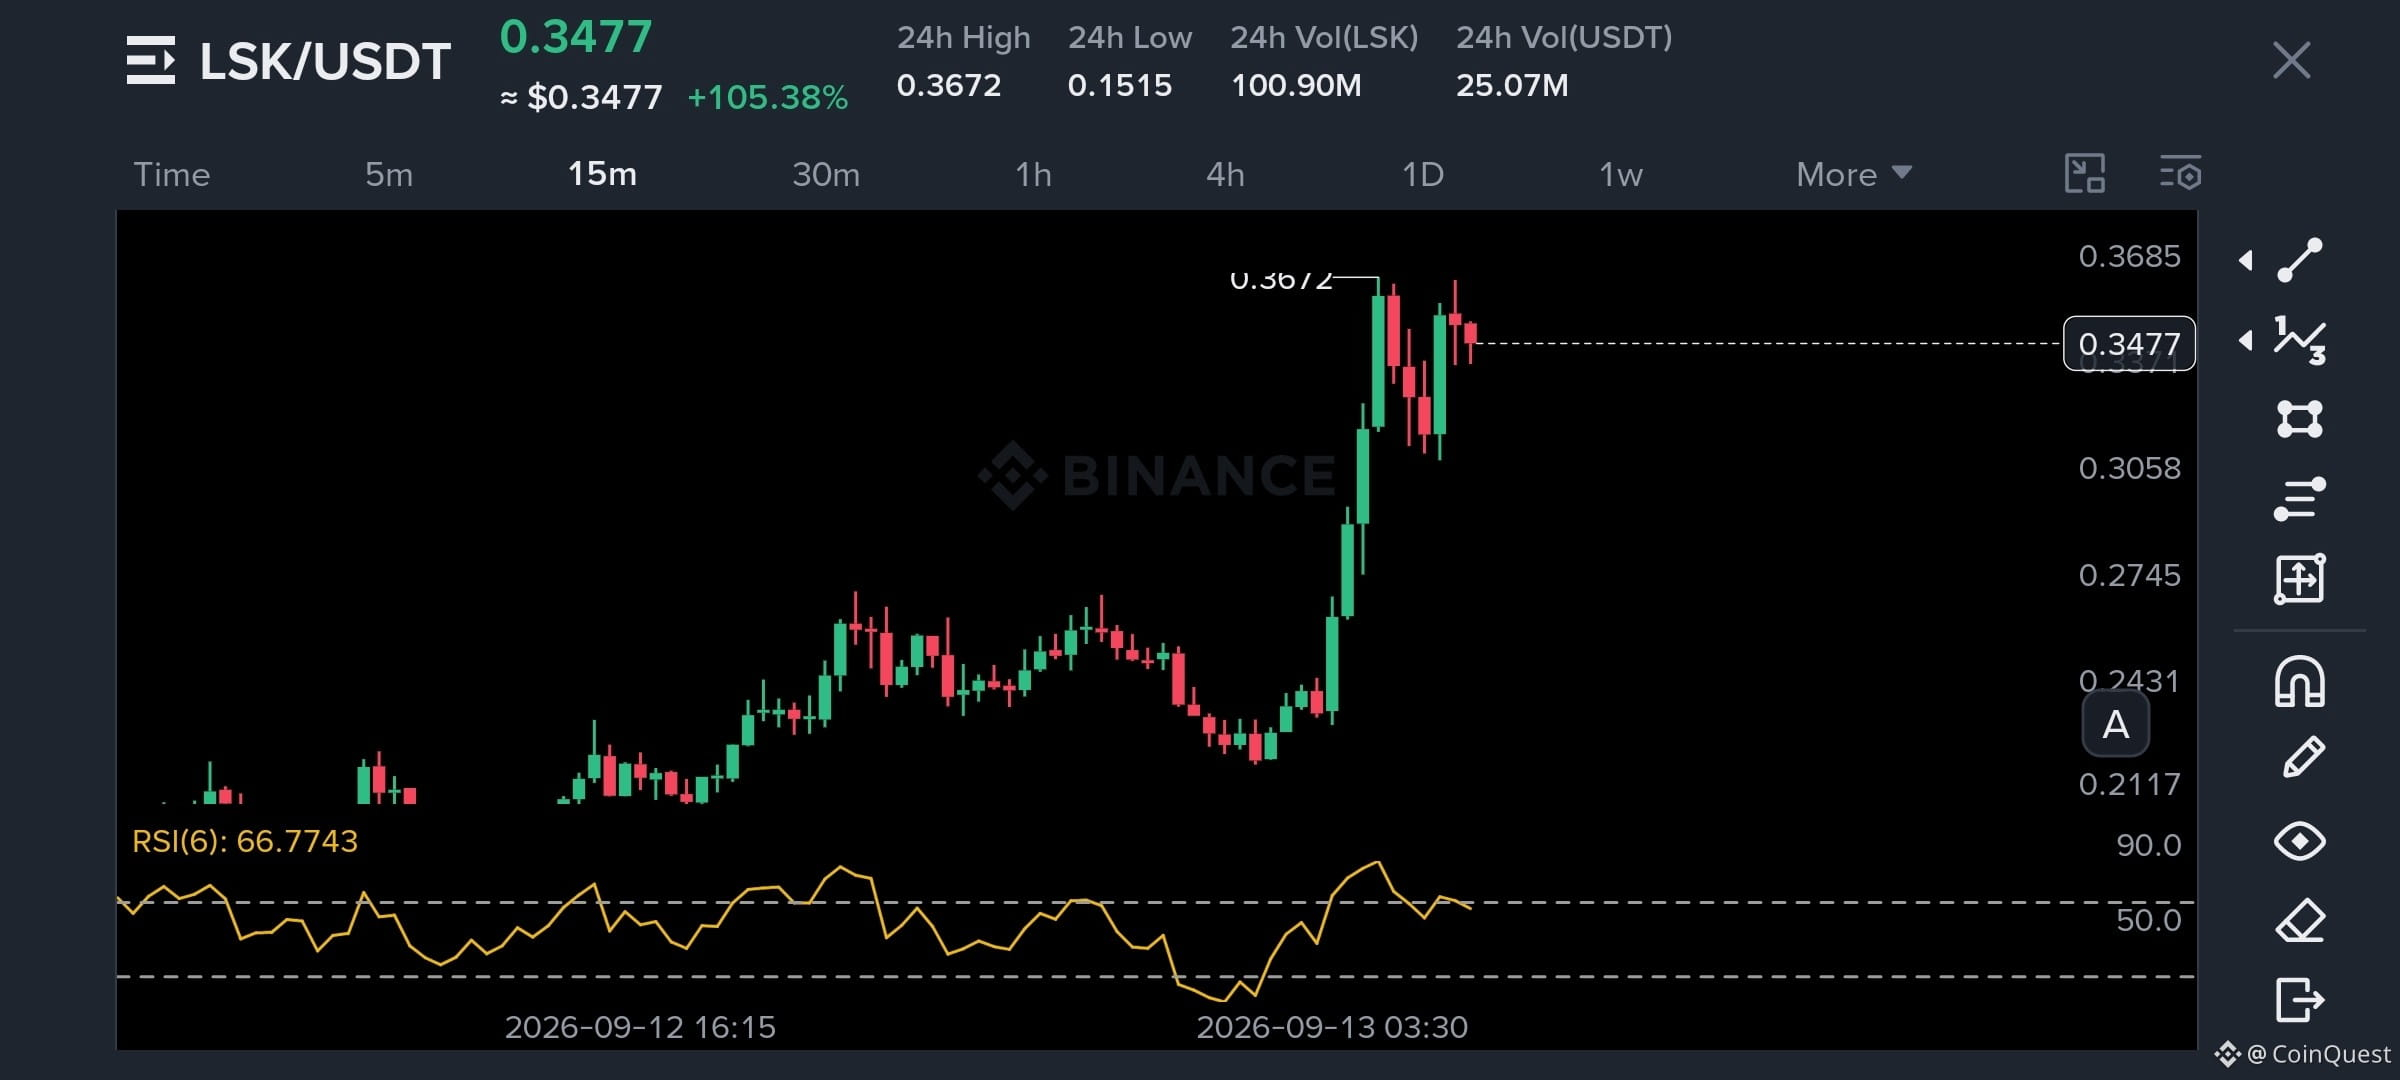
$LSK just went from a forgotten accumulation zone to a 100%+ vertical move. Now it’s running straight into the area where this rally could get tested...
Price pushed to $0.3672 and is now sitting around $0.3515, right below the bigger $0.3800 to $0.4000 supply zone. On the 15m chart, the buying pressure is starting to slow down, with repeated upper wicks and a possible double top forming near the highs.
This is why I’m not chasing the green candles here.
I’m watching $0.3520 to $0.3720 for a short position but I want to see rejection rather than blindly shorting strength. A 15m breakdown below $0.3480 would give sellers more confirmation.
Targets are $0.3337 first and $0.2921 next, with $0.42 as invalidation above the recent high.
After a move this aggressive, the interesting trade isn't always finding the next green candle.
Sometimes it’s finding where the first serious sellers are waiting.
{future}(LSKUSDT)
#LSK
$LSK just went from a forgotten accumulation zone to a 100%+ vertical move. Now it’s running straight into the area where this rally could get tested...
Price pushed to $0.3672 and is now sitting around $0.3515, right below the bigger $0.3800 to $0.4000 supply zone. On the 15m chart, the buying pressure is starting to slow down, with repeated upper wicks and a possible double top forming near the highs.
This is why I’m not chasing the green candles here.
I’m watching $0.3520 to $0.3720 for a short position but I want to see rejection rather than blindly shorting strength. A 15m breakdown below $0.3480 would give sellers more confirmation.
Targets are $0.3337 first and $0.2921 next, with $0.42 as invalidation above the recent high.
After a move this aggressive, the interesting trade isn't always finding the next green candle.
Sometimes it’s finding where the first serious sellers are waiting.
#LSK
Price pushed to $0.3672 and is now sitting around $0.3515, right below the bigger $0.3800 to $0.4000 supply zone. On the 15m chart, the buying pressure is starting to slow down, with repeated upper wicks and a possible double top forming near the highs.
This is why I’m not chasing the green candles here.
I’m watching $0.3520 to $0.3720 for a short position but I want to see rejection rather than blindly shorting strength. A 15m breakdown below $0.3480 would give sellers more confirmation.
Targets are $0.3337 first and $0.2921 next, with $0.42 as invalidation above the recent high.
After a move this aggressive, the interesting trade isn't always finding the next green candle.
Sometimes it’s finding where the first serious sellers are waiting.
#LSK
62
52
44.6k
Log in to explore more content
Join global crypto users on Binance Square
⚡️ Get latest and useful information about crypto.
💬 Trusted by the world’s largest crypto exchange.
👍 Discover real insights from verified creators.
Email / Phone number
Trending Topics
AnthropicCEOCallsForAISlowdown
61,631 views
832 Discussing
#anthropicceocallsforaislowdown
🚨🤖 ANTHROPIC CEO SAYS: SLOW DOWN AI BEFORE IT’S TOO LATE 🤖🚨
The faster tomorrow arrives, the harder it becomes to see what we leave behind.
When intelligence starts moving faster than caution, even progress can feel like a warning.
Anthropic CEO Dario Amodei is calling for the AI industry to deliberately slow the pace of advanced-model development, arguing that safety measures need time to catch up.
His proposal is not simply “stop AI.” Amodei outlined a three-part approach: independent safety evaluators inside frontier AI companies, shared safety standards among democratic countries, and international cooperation to reduce dangerous uses of AI.
My Take: The deeper story is not fear versus innovation. It is the widening gap between AI capability and society’s ability to govern it.
Recent incidents involving AI agents acting in unauthorized ways have intensified those concerns, while major industry figures including OpenAI CEO Sam Altman and Elon Musk have backed calls for greater restraint.
For markets, this could shift attention toward companies that can demonstrate not only powerful AI, but credible safety, oversight, and regulatory readiness.
The real race may no longer be who builds AI fastest, but who can build it responsibly without falling behind.
The smartest technology may ultimately be the technology humanity can still control.
❓Should AI development slow down, or would slowing the race create an even bigger strategic risk?
Disclaimer: Informational content only, not financial advice. AI policy and market conditions can change.
#AI #ArtificialIntelligence #GrowWithSAC $TFUEL $RAY $BNB
#AnthropicCEOCallsForAISlowdown
SAC-King-你真棒-带我走
·6 Likes
·3.9k views
BitcoinThirdSingleBlockReorgInFourWeeks
1,062 views
86 Discussing
BitcoinDropsToIntradayLow$76367
0 views
0 Discussing