

Warning. Binance Futures products are only available in certain countries and only to certain users. This content is not intended for restricted users/countries. Please review our Terms of Use and Risk Disclosure.
Main
Flag patterns in a trending market can indicate to traders whether to go long or short.
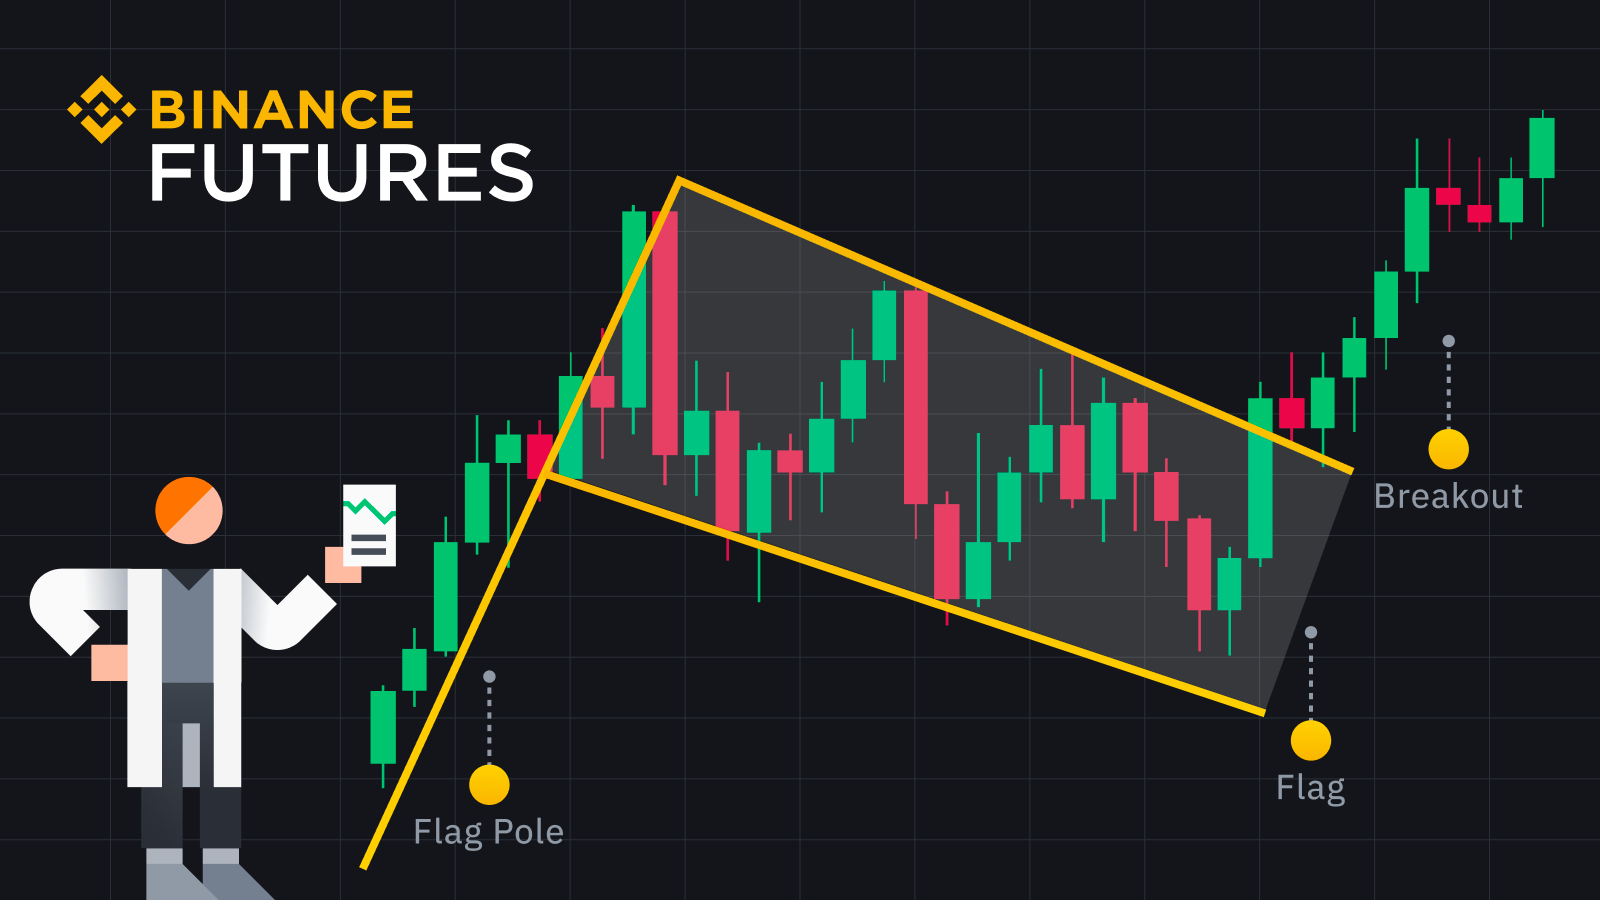
Bullish and bearish flags are continuation patterns commonly used in trading and consist of three main elements: a pole, a flag, and a breakout point.
Traders can use flags in combination with other indicators, such as the relative strength index (RSI), to determine the extent to which an asset is overbought or oversold.
Identifying trends early when trading digital assets allows traders to effectively plan and execute their trades. Charting patterns are an important tool that many technical analysts use when trying to predict the price movements of digital assets and recognize underlying patterns.
Traders typically use bullish and bearish patterns on charts to determine whether a price trend will continue or reverse. These flag patterns are very popular in technical analysis because they can provide useful information about price trends and potential price movements.
Flag patterns, formed by lines and figures that are plotted on price charts, can be useful for identifying further trends, breakouts and reversals. This article discusses the two types of flag patterns, bullish and bearish, and explains how some traders use them in their trading.
What are bull and bear flags?
Bull and bear flags are among the most popular continuation patterns that usually occur when the trend is unlikely to change.
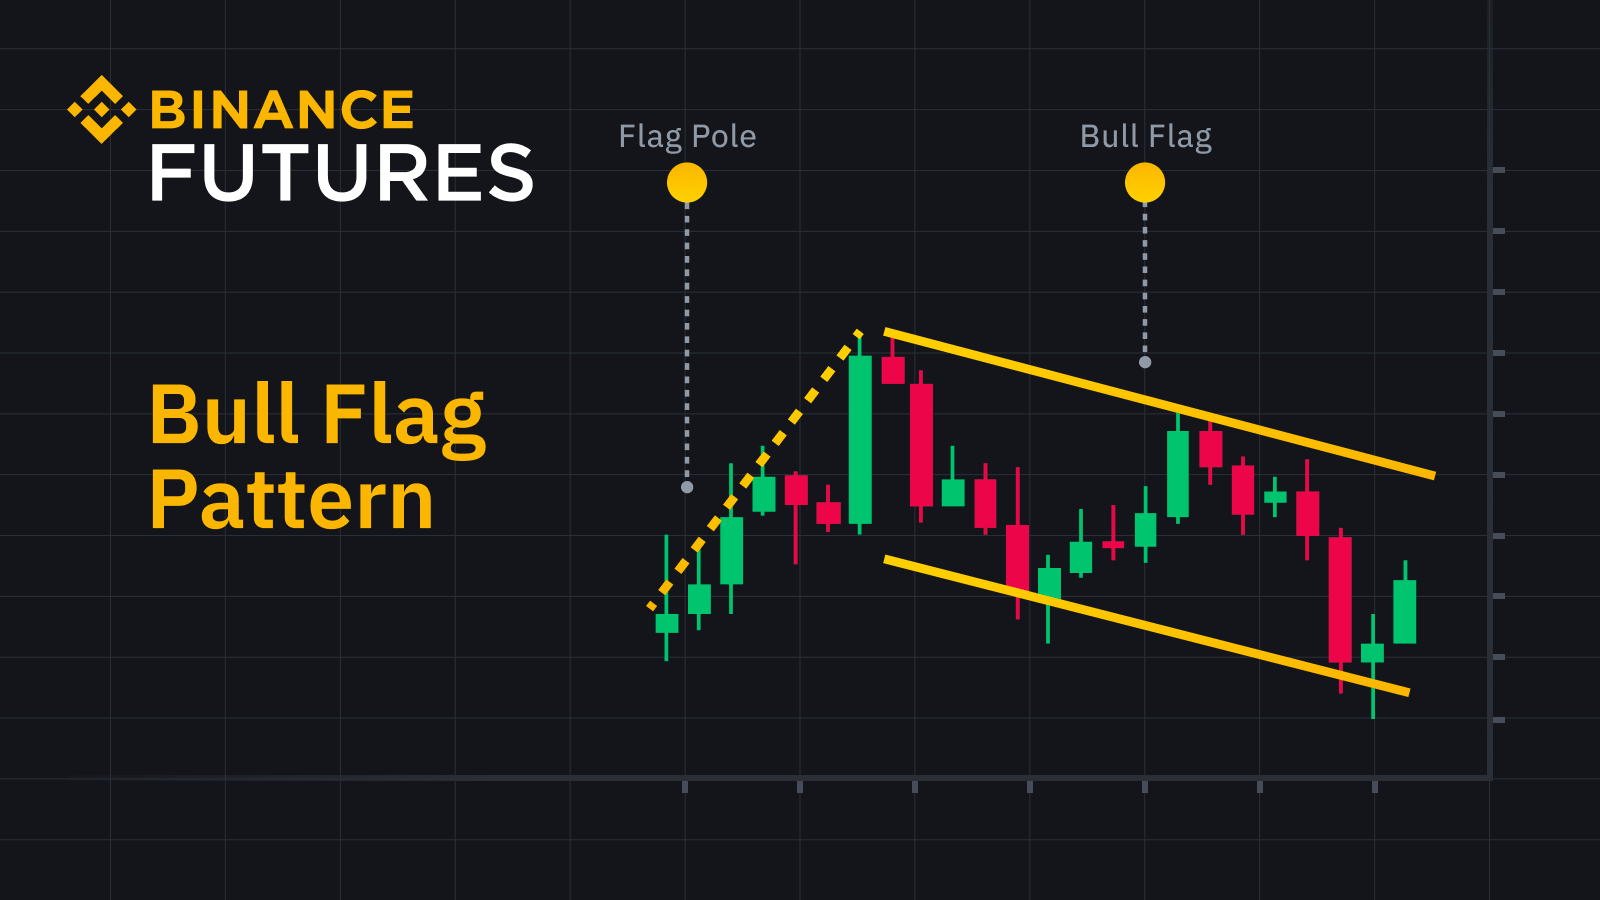
Bull flags usually occur during an uptrend when prices are expected to rise further. Bear flags are usually observed during a downtrend, when the price of an asset is expected to face further pressure from above.
Each flag consists of two main elements: the staff and the flag itself. The pole represents a significant move up or down depending on whether the flag is bullish or bearish. As a rule, the emergence of a pole is accompanied by a significant increase in trading volume.
Shaft formation is followed by a consolidation phase. It resembles an ascending or descending parallel channel and forms a flag on the chart.
In bullish patterns, the pole forms first and then the flag; in bearish ones it’s the other way around.
How to use the bullish flag pattern in trading
The flag pattern can be an informative graphical tool for analyzing potential price breakout points for entering and exiting trades. The chart pattern also allows you to predict how much the price might rise or fall. For both bull and bear flags, the price movement after a breakout or sharp reversal usually follows the size of the pole.
Traders look to first identify a bullish trend during the initial phase of consolidation. During the consolidation phase, the price forms a rectangular figure with a resistance line at the upper border and a parallel support line at the lower border.
Having recognized the bullish flag pattern, traders determine the entry point. The breakout point is where the candle breaks the upper border of the flag. This area serves as an entry point for buyers. The target for a bull flag is a percentage increase in the amount of shaft height added to the breakout point.
To minimize potential loss, some traders also place a stop loss at the bottom of the flag, the low point of the consolidation phase, since there is always a risk of loss if the price moves against the open position.
Some traders rely on shaft height to set a profit target. To determine a profit target, a trader must measure the height of the shaft from its bottom to its top and then add it to the breakout price.
How to use the bear flag pattern in trading
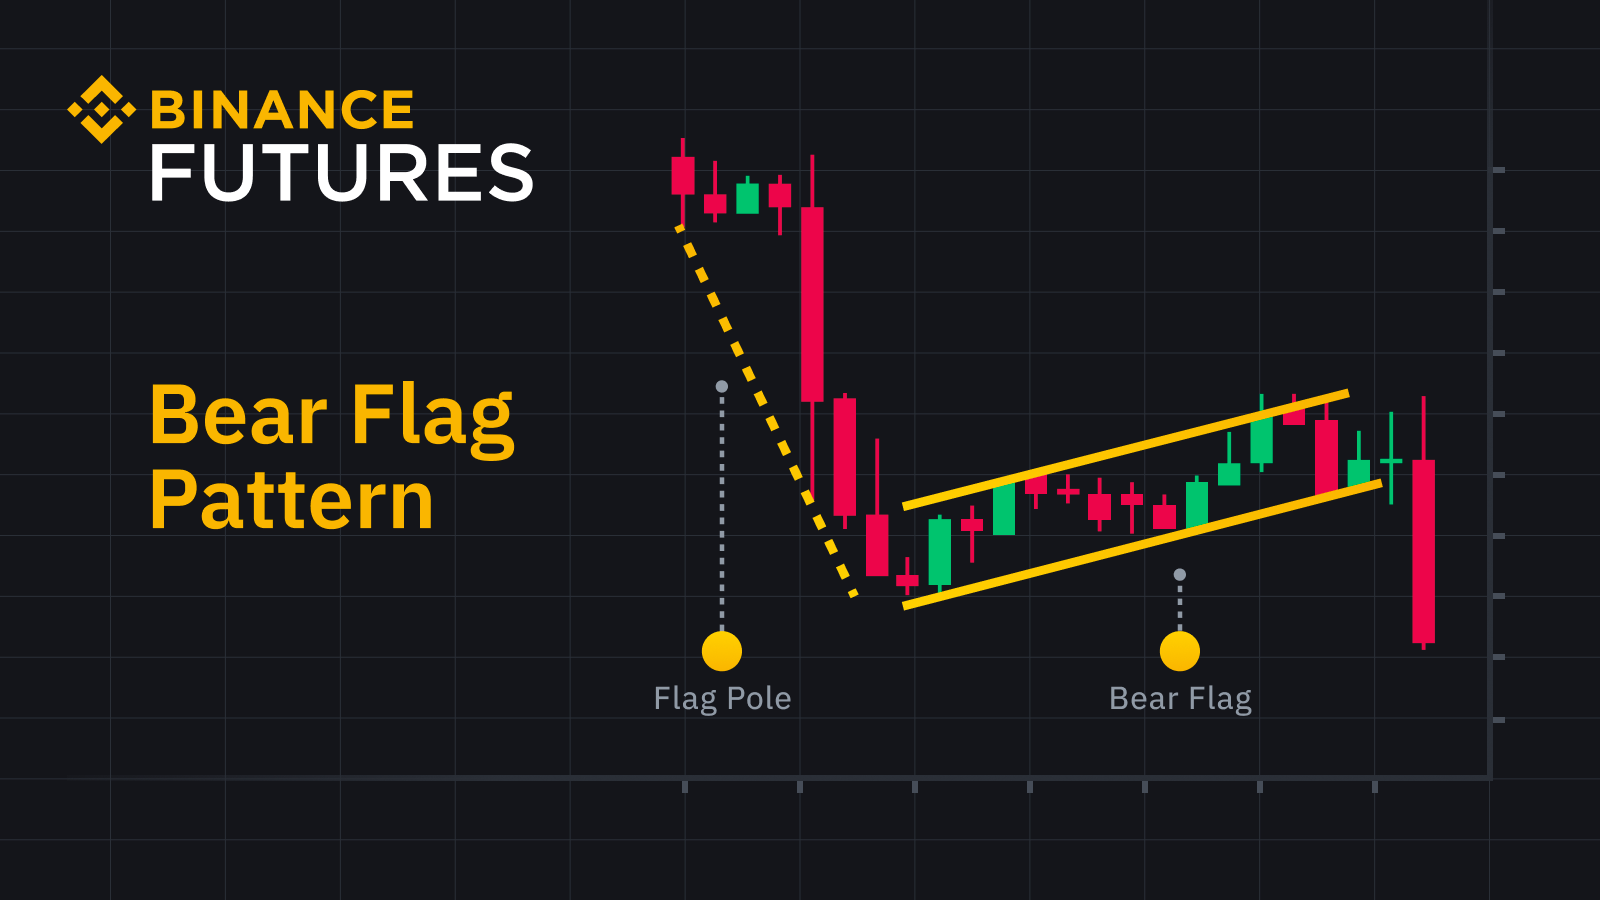
To determine the entry point in a bear flag pattern, sellers subtract the height of the shaft from the breakout price. This occurs when the price of an asset falls below the lower limit of the flag.
To limit potential losses, some traders place a stop loss at the high of the flag move (at the top of the consolidation phase) in case the price moves in the opposite direction.
To calculate the height of the shaft, you need to subtract the bottom point of the shaft from its top point. The consolidation phase of both bullish and bearish flag patterns should ideally not exceed 50% of the size of the flagpole. A correction phase of more than 50% may indicate that the trend does not have the necessary strength.
Additionally, the correction phase is typically 38.2% of the maximum of the movement—the top of the shaft.
When looking for an entry point for a short position, some traders wait for confirmation of a downtrend rather than simply placing an order after the price breaks below the flag support line. This helps to avoid false signals and potential losses.
To limit losses if the price starts to move in the opposite direction, you can use a stop loss order. Typically, traders place a stop loss order above the flag resistance line.
Case Study
Let's say you are trading the ETH/USDT pair on the daily chart and you notice a bearish flag pattern forming. The lower line of the flag is at $2,500, the upper line is at $2,800.
As a conservative trader, you decide to set a profit target based on the distance between parallel trend lines on the flag. In this case, the difference between the two lines is $300, so you add that amount to the price at the breakout entry point, which is $2,400.
Thus, the price target is $2,700.
To manage risk, you can place a stop loss order above the flag resistance line, for example at $2,900. If the price moves in the opposite direction, the stop loss order will be triggered, limiting potential losses.
Comparison of flags and pennants
It's common for traders to confuse flags with pennants, another type of continuation pattern that suggests a trend is likely to continue after consolidation.
Like a flag, a pennant also has a pole. While the flag's consolidation phase is rectangular, pennants form a triangular figure in which two converging lines form the consolidation period.
Use bullish and bearish flags with caution
Bull and bear flags can serve as valuable technical analysis tools for determining price targets in trending markets. However, they do not guarantee predicted profitability, as false breakouts are possible. A false breakout occurs when the price of a crypto asset breaks through a key flag boundary but then quickly retreats.
A trader must first determine whether a sustainable trend exists. Evidence of this can be either a bullish flag in a market with growing interest or a bearish flag forming in a trend with weakening momentum. Volume is also important since breakouts are usually accompanied by strong movements.
Please note that traders often use combinations of indicators. Along with bullish and bearish flags, the Relative Strength Index (RSI) is commonly used to determine whether a crypto asset is overbought or oversold.
Additional Information
(Blog) Two Technical Indicators to Assess Market Trends on Binance Futures
(Blog) How to Apply Market Neutral Strategies on Binance Futures
(Blog) The Wyckoff Method for Trading Cryptocurrency Futures
Risk warning. Digital asset prices may be volatile. The value of the funds invested may go up and down. You may not get your invested funds back. You are solely responsible for your investment decisions. Binance is not responsible for your possible losses. Futures trading in particular is subject to high market risk and price volatility. If there is a sudden price change, there is a chance that your entire margin balance will be liquidated. Past performance is no guarantee of future performance. Before entering into a transaction, you should make an independent assessment of the appropriateness of the transaction, taking into account your own objectives and circumstances, including the risks and potential rewards. If necessary, contact your advisor. This information should not be considered financial or investment advice. To learn more about how to protect yourself, visit our Responsible Trading page. To learn more, please read our Terms of Use and Risk Disclosure.
Trading in cryptocurrency derivatives may be restricted in certain jurisdictions or regions or only to certain users (subject to legal and regulatory requirements). This content is intended only for those users who are authorized to access and receive such products and services, and is not intended for restricted users. When accessing or using any products or services offered or available on Binance, you are responsible for reviewing any applicable restrictions or requirements regarding those products and services that apply in the country or region from which you (or another person from your name) interact with these products and services. Binance reserves the right to change the terms and conditions and impose further restrictions on access to and use of any products and/or services offered, at its sole discretion, at any time and without notice.