
Introduction
We often intuitively feel the costs and benefits of using different blockchains, namely gas fees and incentives.
However, do you really understand their complete economic models? Where do gas and incentives come from and where do they go? How does the market perform under different economic model designs?
Token Terminal discussed the blockchain economic models of the main L1 and L2 based on PoW and PoS, as well as emerging models of protocols such as liquidity staking. It also disassembled and illustrated the principles of the economic model of each blockchain in a very easy-to-understand way.
At the same time, by visualizing the daily fee changes of blockchain, we also provide insights into the market performance of mainstream blockchains, so that investors can use the framework in this article to compare the economic performance, potential, and sustainability of blockchains.
introduce
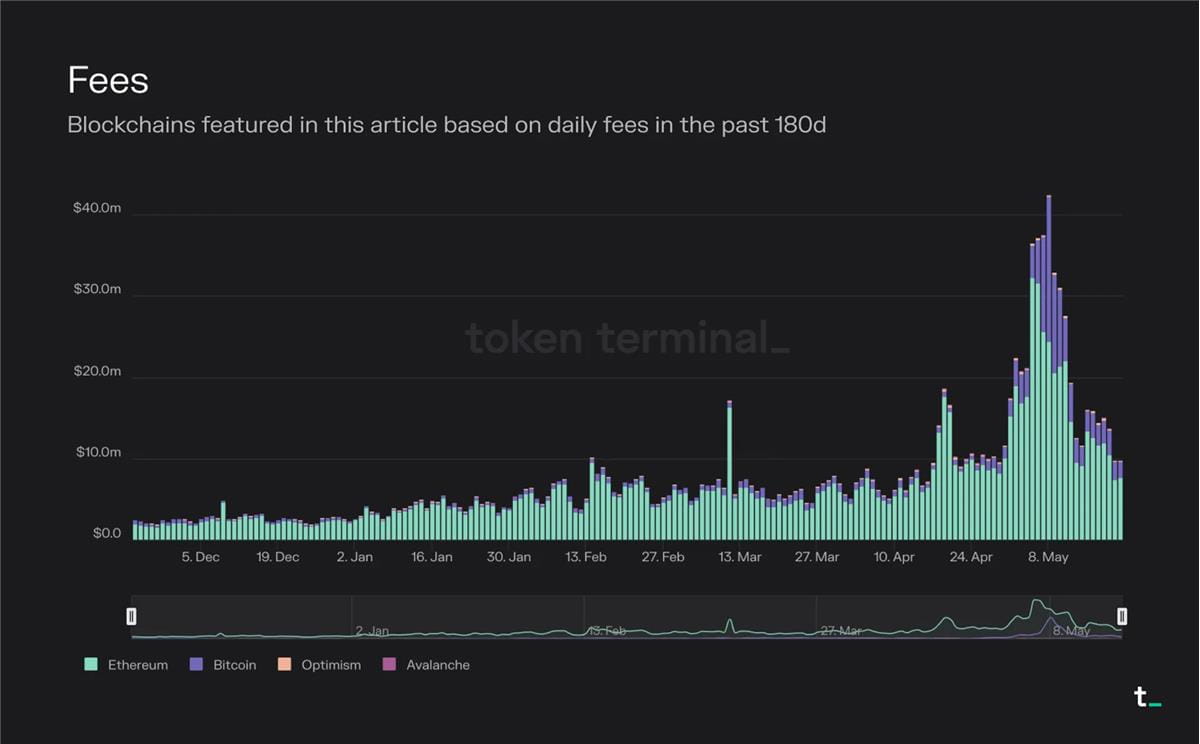
The chart below visualizes the daily fees for the blockchains mentioned in this article over the past 180 days.
Note from Shenchao: It can be seen that Ethereum and Bitcoin are still far ahead in terms of total transaction fees.
The key components that typically make up the economic structure of a blockchain are transaction fees, inflationary block rewards (incentives), and fee burning.
Transaction fees represent the market price of block space.
Incentives are financial rewards that encourage people to take actions, such as validating transactions.
Fee burning is a mechanism that removes a portion of each transaction fee from circulation.
Given the limited capacity of a single blockchain, we will see a world with multiple different blockchains - each optimized for different use cases - interoperating with each other. The blockchain market was initially dominated by Bitcoin, an extremely simple and limited contract execution environment. With the introduction of Ethereum, it became possible (in theory) to deploy arbitrarily complex contracts or programs on a blockchain. Now, with the rise of scaling solutions, application-specific blockchains, and cross-chain bridges, it is also possible to deploy arbitrarily complex contracts in practice (scalability is no longer a limitation). In this article, we will break down the economic models of the most common types of blockchains.
PoW-based L1
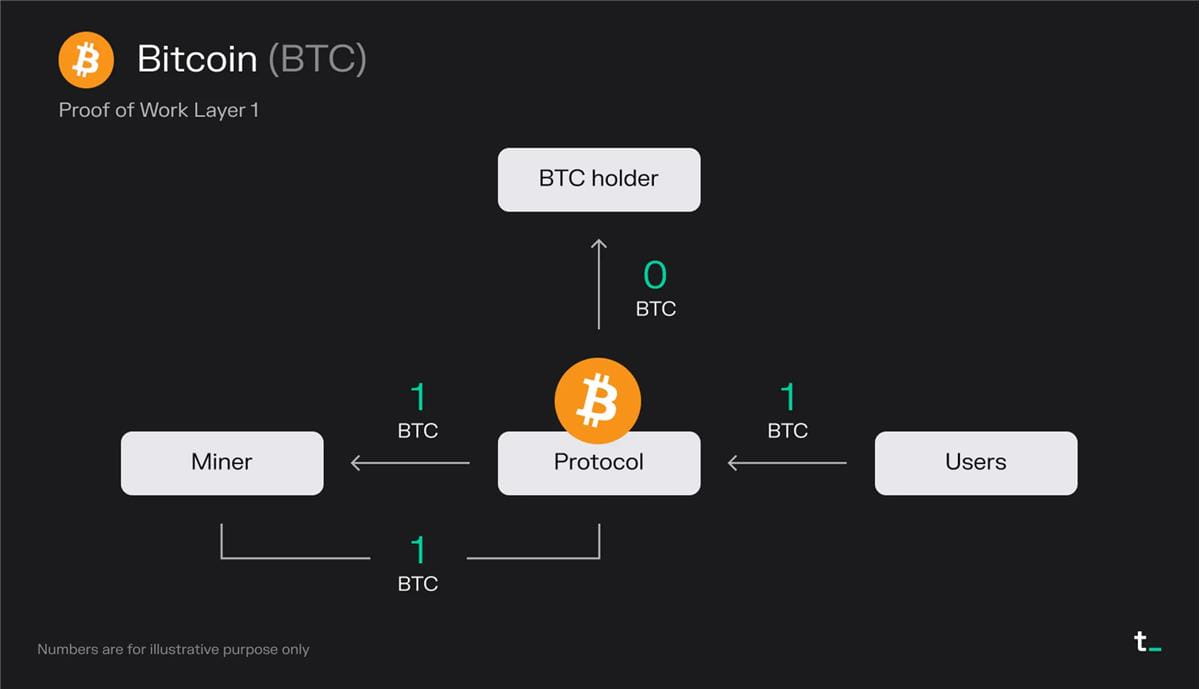
Principle explanation:
Users pay 1 BTC in transaction fees for one block
Miner receives all fees (1 BTC)
Miners receive 1 BTC from block rewards (newly issued BTC)
Final Results:
Miner receives 2 BTC
Key points:
The demand to submit transactions on Bitcoin creates a market for block space. Users pay miners for block space. Miners are further incentivized by block subsidies, which are newly minted Bitcoins that increase the total supply of the currency. Currently, all fees and block subsidies in Bitcoin go to miners.
Bitcoin provides security through CPU power. Bitcoin's value proposition is to create a secure, transparent and immutable global ledger that allows trustless and irreversible transfer of value. These values are maintained by the security derived from CPU usage. Each block consumes a large amount of CPU power to be verified on the network. Essentially, 1 CPU corresponds to 1 vote on the network. Therefore, as long as the majority of CPU is in the hands of honest miners, the network is secure.
The economics of Bitcoin are determined by two variables: transaction fees and the block subsidy. Transaction fees are determined based on the supply and demand of block space on the network. The block subsidy is an inflationary reward that increases the circulating supply of BTC. Currently, miners are rewarded 6.25 bitcoins for a block, a number that halves every four years. Eventually, Bitcoin will reach a maximum supply of 21 million (expected to occur around 2140), and the block reward will consist solely of transaction fees. This means that user adoption is critical for the network to remain economically sustainable.
PoS-based L1
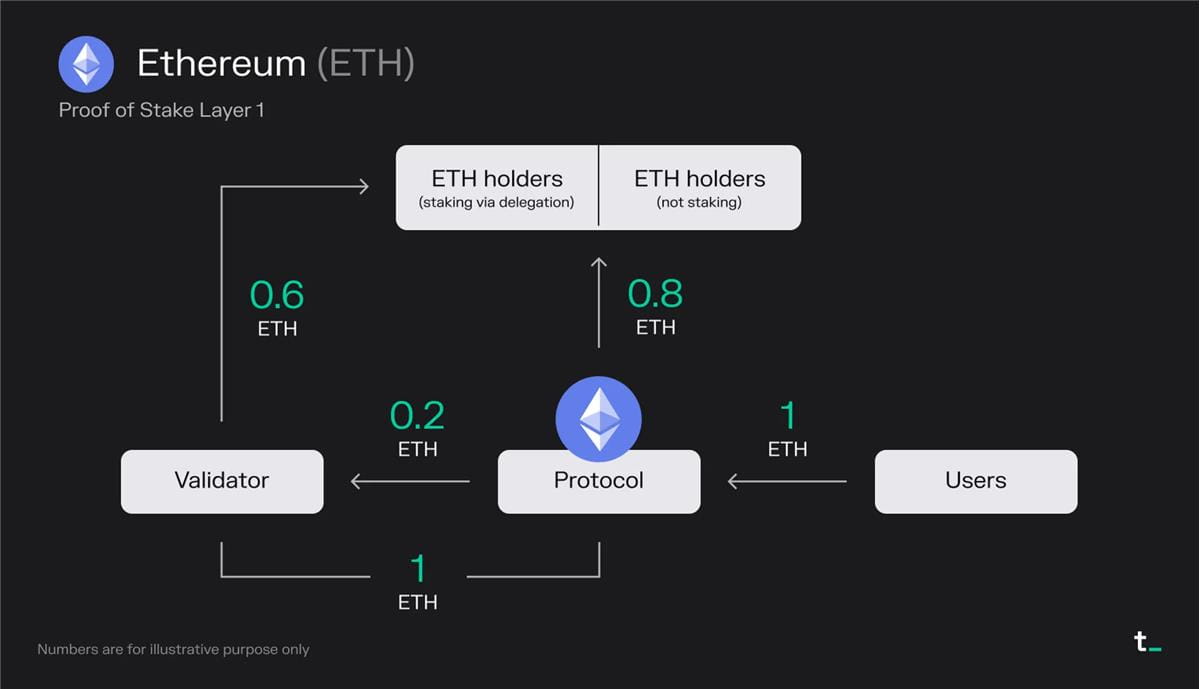
Principle explanation:
Users pay 1 ETH in transaction fees per block (including MEV)
0.8 ETH destroyed —> “Stock buyback” benefits all ETH holders equally
Validators earn 0.2 ETH from fees
Validators receive 1 ETH from block rewards (newly issued ETH)
Since the validator already receives half of the stake from the delegators, the validator must share 50% of its revenue with these ETH holders.
Final Results:
0.8 ETH destroyed
Validator receives 0.6 ETH
ETH holders who delegated their stake received 0.6 ETH
Key points:
On Ethereum, approximately 85% of total transaction fees are destroyed, effectively acting as a “share buyback” that benefits all ETH holders equally. Meanwhile, validators earn the remaining fees and additional staking rewards, i.e. newly minted ETH. Over the past 30 days, Ethereum has collected an average of approximately $15 million in fees per day.
The fee burning mechanism implemented in August 2021 via EIP-1559 turned ETH into a productive asset. In addition, the transition from PoW to PoS reduced the rate of new issuance of ETH. Since the Merge in September 2022, Ethereum no longer distributes block rewards to miners. This change caused the issuance of new ETH to drop by about 90% (~14k ETH/day of block rewards were replaced by ~1.7k ETH/day of staking rewards). This caused deflation in ETH supply during periods of high usage.
Ethereum's economic structure consists of three key components: total transaction fees, the portion of transaction fees that are burned, and staking rewards. Transaction fees are determined based on the supply and demand of network block space. Staking rewards are inflationary rewards that increase the total supply of ETH. The burning of transaction fees causes deflationary pressure on ETH, while the reduction in circulating supply may increase the value of the token over time.
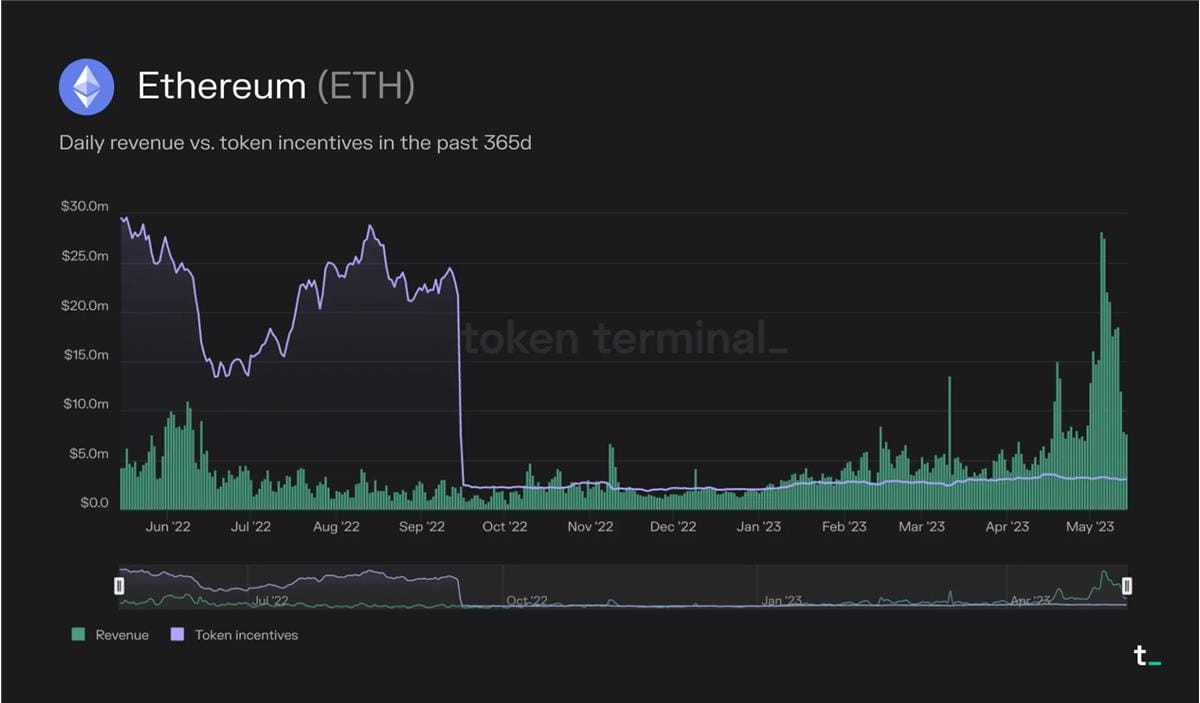
Combined, ETH supply has been deflationary during periods of high usage. For example, in May of this year, the amount of ETH destroyed (revenue) has been greater than the amount of ETH minted as staking rewards (token incentives).
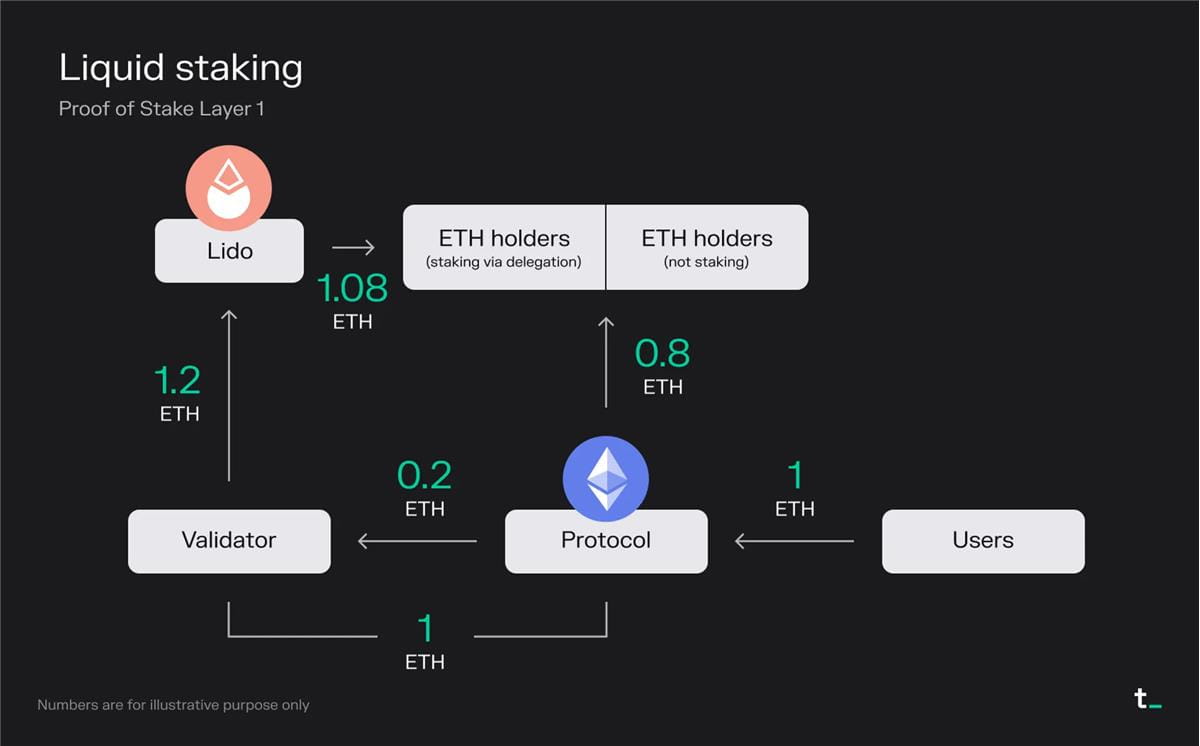
Liquidity staking projects allow users to stake their assets and maintain liquidity through derivative liquidity tokens (liquid staking derivative, LSD) that represent the underlying assets.
Principle explanation:
Users pay 1 ETH in transaction fees per block (including MEV)
0.8 ETH destroyed —> “Stock buyback” benefits all ETH holders equally
Validators earn 0.2 ETH from fees
Validator receives 1 ETH from block rewards (newly issued ETH)
The validator already receives full stake from users who deposit ETH through the liquidity staking protocol Lido, so it shares 100% of the revenue with these ETH holders
Lido takes 10% (0.12 ETH) of the total staking rewards for providing the service and distributes the remaining 90% (1.08 ETH) to ETH holders who stake through Lido
Final Results:
0.8 ETH destroyed
Validator receives 0 ETH
Lido receives 0.12 ETH (50% of which is used to cover node operating costs)
ETH holders who stake through delegation will receive 1.08 ETH
Key points:
The Liquid Staking Protocol enhances the user experience. Staking, an inherently technical and high-maintenance process, has been simplified by protocols like Lido. By allowing users to lock up their ETH and receive transferable utility tokens (stETH), Lido facilitates seamless staking while enabling users to earn rewards associated with validation activity. To provide this service, Lido takes a 10% fee from gross earnings. This fee is split evenly between node operators and the Lido DAO.
The technicality and high capital requirements of staking have opened up business opportunities for liquid staking protocols. Traditional Ethereum staking requires users to maintain a node, invest a large amount of capital (32 ETH), and sacrifice token liquidity. In contrast, Lido distributes users' tokens to validators in batches, eliminating the 32 ETH barrier. By simplifying the user experience, providing liquidity, and democratizing staking, Lido and similar protocols are opening up a rapidly growing market segment.
The democratization of staking allows for a wider range of investors to participate. The liquid staking market sector is one of the fastest growing outside of blockchain (L2). The successfully executed Shapella upgrade (April 12) arguably reduced the risks associated with ETH as an investment, as well as the risks associated with ETH as a yield asset. As a result, the ETH staking ratio (staked assets/circulating market capitalization) is expected to grow and become on par with other PoS chains. Currently, ETH's staking ratio is around 15%, which is relatively low compared to other PoS chains. For example, Solana and Avalanche currently have staking ratios of over 60%. Given ETH's high market cap, around $220 billion at the time of writing, we can see the assets staked growing by billions of dollars in the coming quarters.
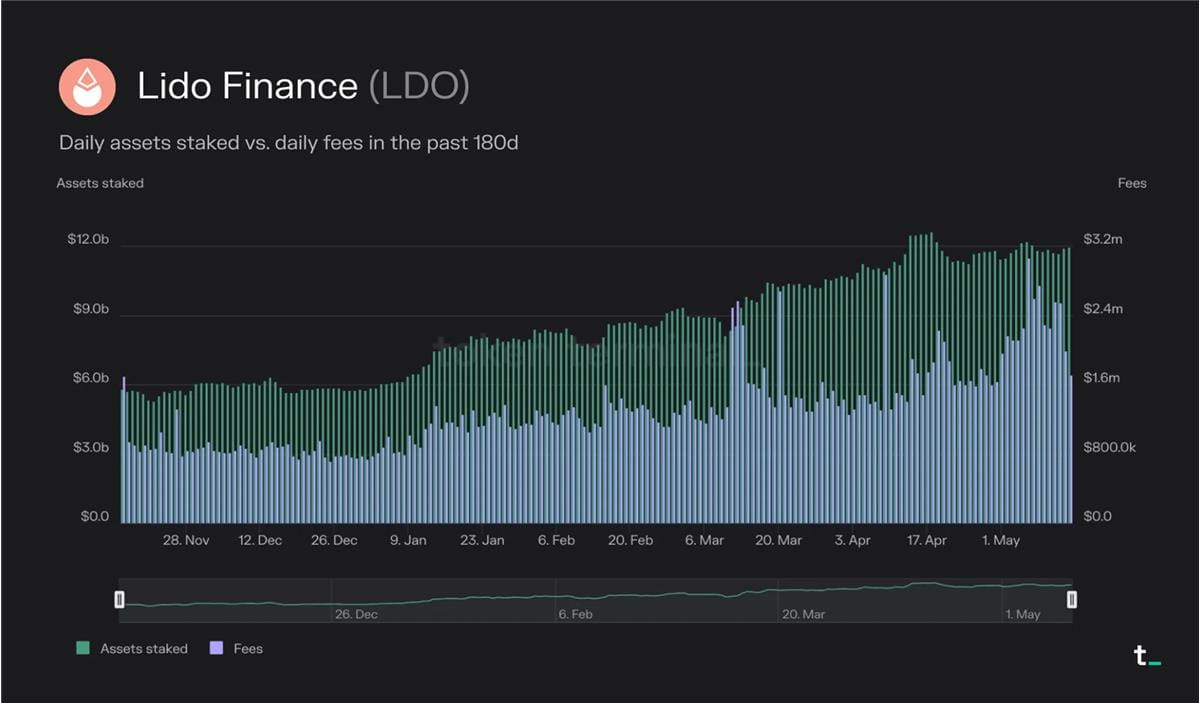
Lido has become the current market leader in the liquid staking market space, with $12 billion in total assets staked. This figure represents a 38% year-over-year increase and a 105% increase over the past 180 days.
Over the past 30 days, Lido generated $60.4 million in fees and received 10% of that, or $6.04 million in revenue. This revenue is split 50/50 between node operators and the Lido DAO.
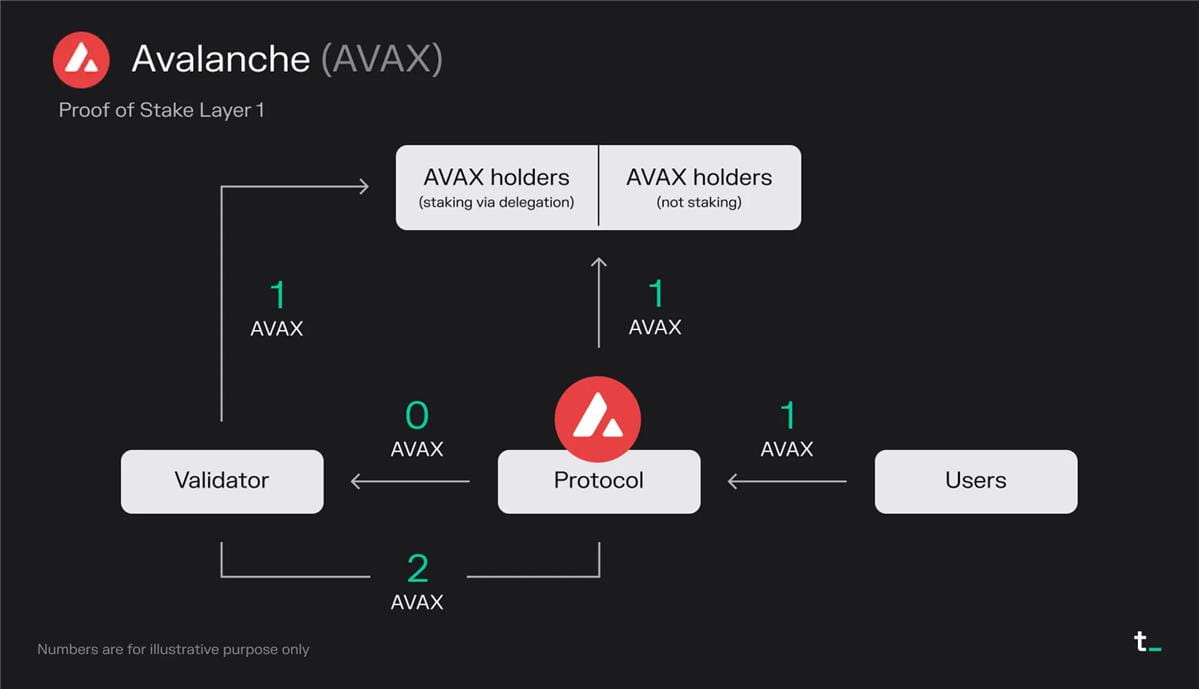
Avalanche is a blockchain (L1) that competes with Ethereum by prioritizing scalability and faster transaction speeds. It uses a novel consensus algorithm that provides strong security, fast transaction finality, and high throughput while maintaining decentralization.
Principle explanation:
Users pay 1 AVAX in transaction fees for one block
1 AVAX is destroyed —> “Stock buyback” benefits all AVAX holders equally
Validators earn 0 AVAX from fees
Validators receive 2 AVAX from block rewards (newly issued AVAX)
Since the validator has received part of the stake from the delegators, the validator must share its revenue with those AVAX holders.
Final Results:
1 AVAX was destroyed
Validator receives 1 AVAX
AVAX holders who stake through delegation will receive 1 AVAX
Key points:
On Avalanche, all transaction fees are burned, and the only source of income for validators is staking rewards. The burning mechanism acts as a "share buyback" that benefits all AVAX holders equally. Over the past 30 days, Avalanche's average daily fees have been around $64,000.
As a relatively new entrant in the blockchain space, Avalanche is issuing a large number of AVAX tokens to reward its validators. This approach is often used as a way to bootstrap growth in the early stages of a platform. These rewards attract validators and stimulate growth and activity within the Avalanche ecosystem.
Avalanche's economic model may change in the future. The fee and reward structure is not set in stone and can be adjusted based on future governance decisions. Currently, 50% of the total AVAX token supply is allocated for use as staking rewards for validators. This distribution is scheduled to occur over a ten-year period, from 2020 to 2030. As the staking reward distribution eventually ends, we may see a portion of transaction fees redirected to validators in the future.
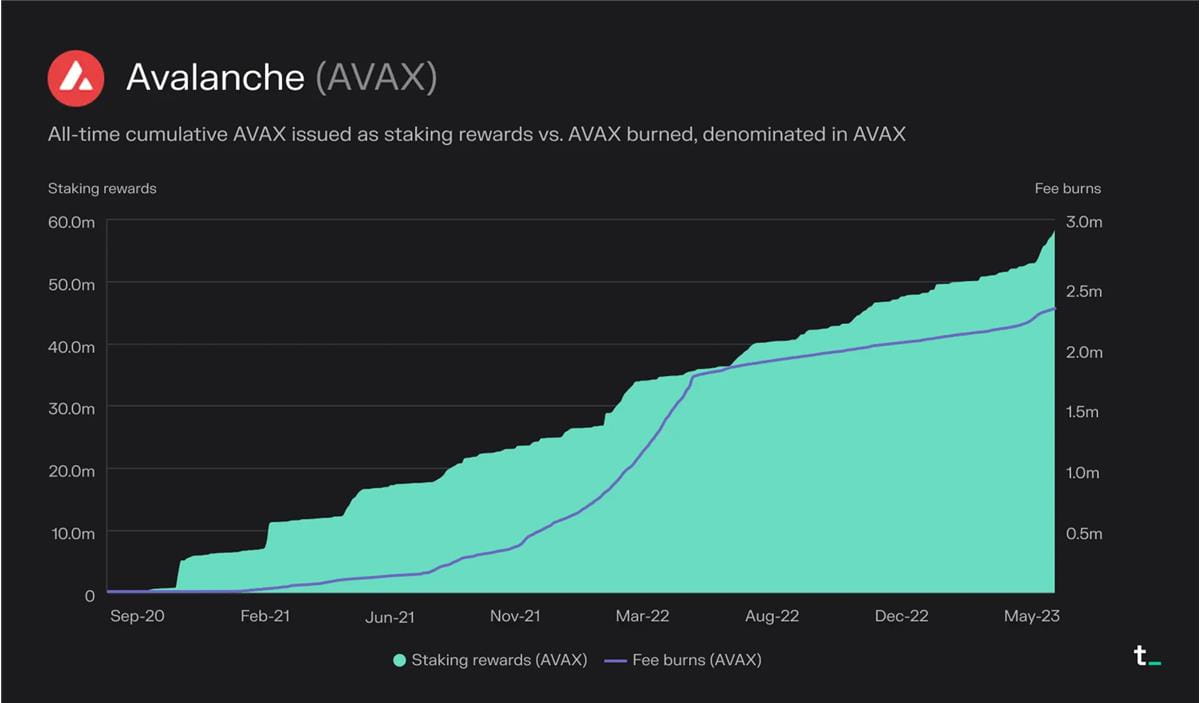
Since the network launched in September 2020, a total of approximately 2.3 million AVAX has been destroyed and approximately 57 million AVAX has been distributed as staking rewards.
PoS-based L2
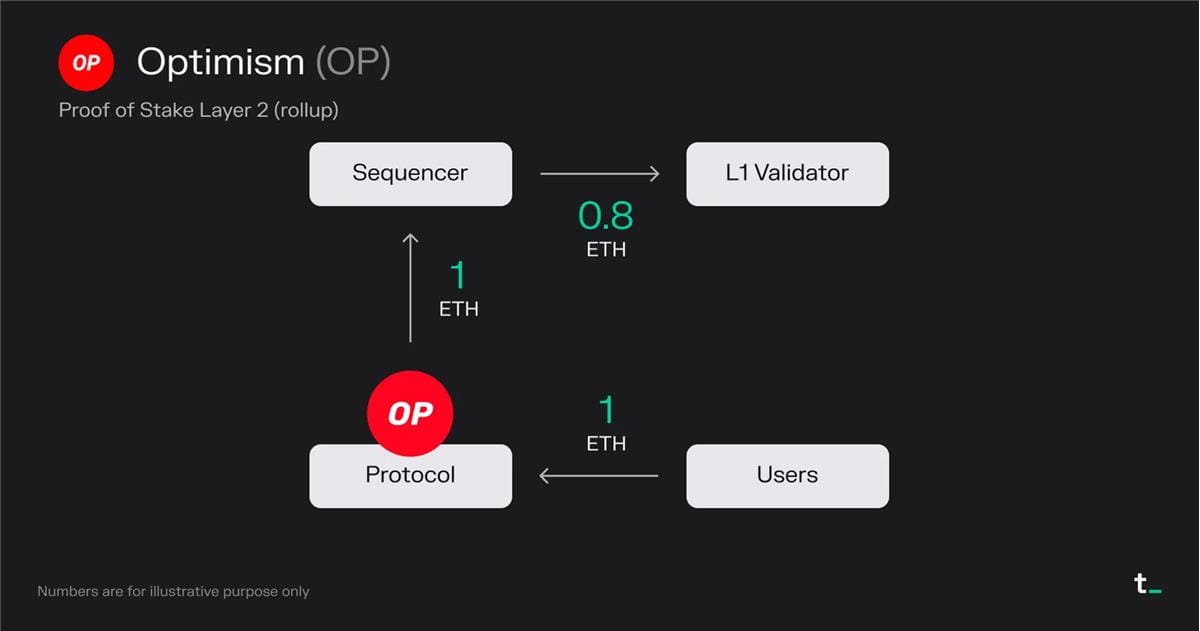
Optimism is a scaling solution (optimistic rollups) that aims to make Ethereum better by increasing its transaction speed and throughput. Optimism executes transactions on L2 and submits them to L1 for finalization in batches. Depending on the transaction type, this results in a gas reduction of about 5-20 times.
Principle explanation:
Users pay 1 ETH in transaction fees for one block
All transaction fees (1 ETH) go to the sorter run by the Optimism Foundation
Sequencer pays 0.8 ETH transaction fee to submit the transaction to L1 (Ethereum)
The Sequencer (in this case, the Optimism Foundation) keeps 0.2 ETH as profit
Final Results:
0 ETH destroyed (excluding destruction on Ethereum)
Sequencer receives 0.2 ETH
L1 validator receives 0.8 ETH
Key points:
Layer 2 blockchains scale applications. L2 blockchains allow widely used L1 applications, such as Uniswap, Blur, OpenSea, etc., to move their trading activity from L1 to a separate chain that regularly settles their transactions back to L1. Currently, more than 30% of Uniswap comes from L2.
Layer 2 blockchains enable a more optimized user experience. As an L2, the application can optimize the user experience (transaction fees/MEV collection and rebates, on-chain privacy, etc.) for its use case (e.g., transactions). This optimization can be implemented while still maintaining transaction records on the more secure L1.
The economics of layer 2 blockchains are driven by two variables: the fees collected by L2 and the cost of settling transactions to L1. The primary business model of L2 blockchains is to generate revenue by taking a cut of the transaction fees paid by users. The profit margin is determined by the cost of settling transactions to L1. For example, users on Optimism have paid a total of $38.2 million in transaction fees since launch. Of these fees, $28.5 million was spent on gas fees to submit transactions to Ethereum. Therefore, Optimism captured the difference, or $9.7 million, as revenue. As competition increases, the profit margins of L2 blockchains are expected to decline. L2 blockchains that are able to optimize their gas expenditures on Ethereum through data compression and other techniques, further reducing L2 fees, may gain market share in the future.
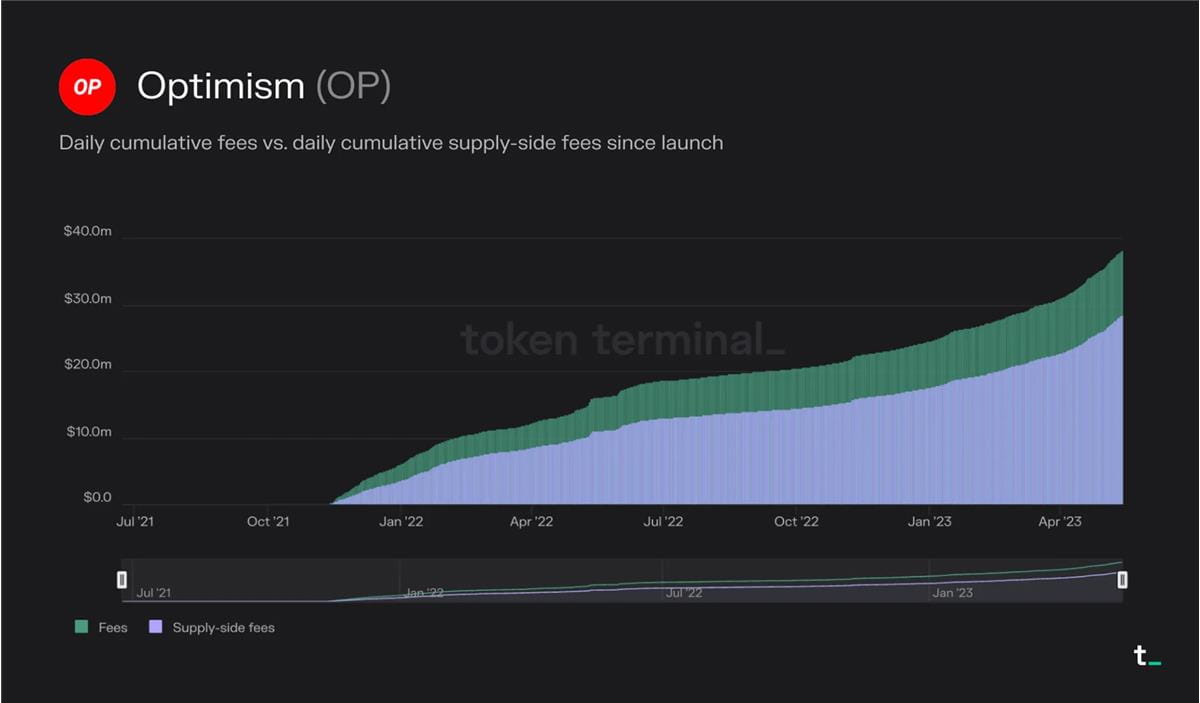
Since the network launched, users on Optimism have paid a total of $38.2 million in transaction fees. Of these fees, $28.5 million was spent on gas fees to submit transactions to Ethereum.
in conclusion
Blockchain is redefining the infrastructure of economic activity by providing a decentralized, secure, and transparent transaction processing architecture. In a rapidly evolving industry like crypto, we are seeing continued innovation in the economic models of these computing platforms. Despite their differences, investors can use the above framework to compare their economic performance, potential, and sustainability.