KDJ and MACD are both familiar and commonly used technical analysis indicators. You can use one of them alone or both. For newbies in the stock market, they want simple tools as well as accurate tools that can make money. So if you want to know which one is more accurate, you can study one. Next, I will share the experience of people who have experienced it with you for your reference.
Before distinguishing the two indicators, we need to deeply analyze the usage of the two indicators and the applicability of the two indicators. Let's take a look at the usage of the two indicators.
KDJ is a swing indicator, which mainly changes between 0-100 values, reflecting whether the market is overbought or oversold. The indicator changes quickly and is more suitable for short-term operations. At the same time, there are more false signals.
The MACD indicator is a trend indicator. The indicator runs and changes with the stock price. There are many restrictions on buying and selling signals, which will filter out many false signals. In an upward market, both will have a golden cross.
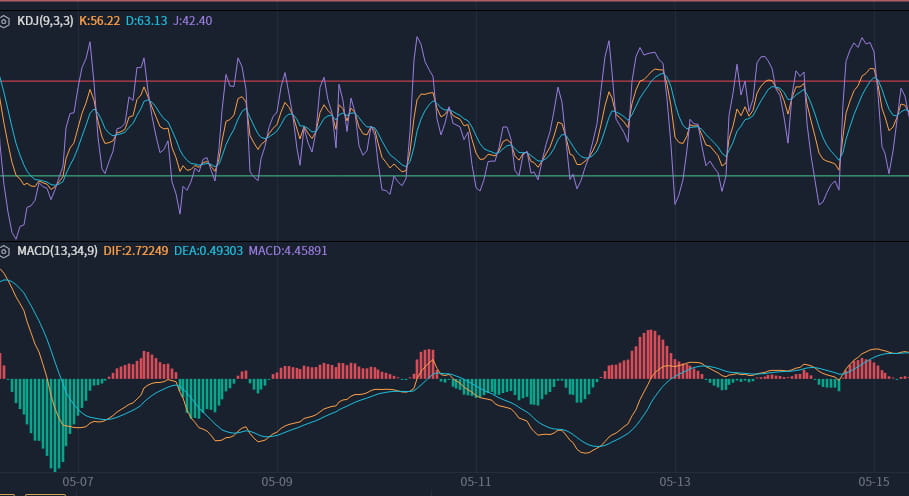
From the buying point in the figure, we can see that the KDJ signal appears earlier, and the MACD appears later; relatively speaking, the MACD is more stable. This is more obvious for stocks in a downward trend. Let's take a look at the pharmaceutical stock. The trend is going down all the way, and the MACD shows two bottom divergences to confirm the trend change; and when we compare KDJ, there are more false buying signals.
From the above content, it is not difficult to find that the two indicators are not perfect. They have advantages but also disadvantages. It cannot be said that one is more reliable than the other. If you want to use these indicators well, you should know more about their usage, and they can be combined together to more accurately judge the buying and selling opportunities in the market. If you want to know more about the BBI indicator, you can click to enter. Finally, I wish you all a happy weekend.