
#广场狂热挑战景财今天给大家分析一下比特币2024年4月前最高能到多少
I will mainly talk about the trend of Bitcoin from a long-term perspective. You can look back in a year or two. Let me first talk about the conclusion. This round of bull market will probably last until October to December 2025. There will be several large corrections in the process. Then, from a short-term perspective, look at the weekly and daily charts to see its possible short-term trend and when it will reach the bottom and top.
First, let's look at the analysis from 2013. The first halving was in July 2016. The second was in May 2020. The third halving will be in April or May of 2024 next year. It reached the top in 2013 and then in 2017, and it took 49 months in between. The monthly chart is 49 K-lines. From December 2017 to November 2021, it took 47 months. That is, 47 K-month K-lines. Assuming that we calculate according to the minimum 47 K-lines, where will the approximate top be? Then the next top calculated by Jingcai across the halving will be around October 2025. This is the position of the top in the long term.
Let’s look at the bottom reached in January 2015, and then reached another bottom in December 2018. This time period is also 47 months. From the bottom in 2018 to the bottom last year, which is the bottom that Jingcai looked at in November 2022, it happens to be 47 months, and so on. If we reach 47 from this bottom in November last year Yue's words. Its approximate bottom will be between October or December 2026. Such an analogy. The time period has been calculated for everyone.
Then we will analyze the actual technical indicators later. It experienced a halving in 2012, reached the top in 2013, and began to correct. In the bear market of 2013, after the downward trend line broke through, he stepped back. After the step back, he took off and reached a height before the halving. The height did not break a new high. After the halving, he made a correction. , and then a pull-up was carried out after the correction. We can see that the height from the bottom to before the halving was probably around the golden section of 0.618, and then it rose again.
Everyone will be more familiar with the second cycle. Because many people have bought during this cycle. Including Jingcai, he also started to get involved in the currency circle at this time. We know that this cycle reached a high point in 2017. From the 2017 trend line to the bottom below, after the breakthrough here, it reached another high point and made a correction. After the correction, it crossed the halving and then broke through the new high to reach the high point in April 2021, including which November 6 A high of 90,000. Judging from the previous cycle, there was a callback from this position to the golden section point of 0.618. Both times it was called back to 0.618. One was a callback after another halving. One is that there was a correction before another halving. We have to remember this and look at the current cycle to see when it will reach this position. The position of 0.618 is at the position of 48500. This is why I said before that I could go above 40,000. Everyone must remember that this location is very important. So Jing Cai believes that before the halving. That is to say, it is impossible to break through a new high before April 2024, so this period of time is defined as the early stage of the bull market. That is, the bull-bear transition period, this time is mostly dominated by shocks. Then it will reach around 48500. Maybe the big cycle is not so precise. It is effective to look at hundreds of nearby points. Here, there will be another sharp correction before going up again. If it rises, it will definitely be after another halving, that is, it will break through to a new high after April next year. This is the approximate position it will take from this year to next year and the year after when I look at the long-term cycle combined with the previous two cycles.
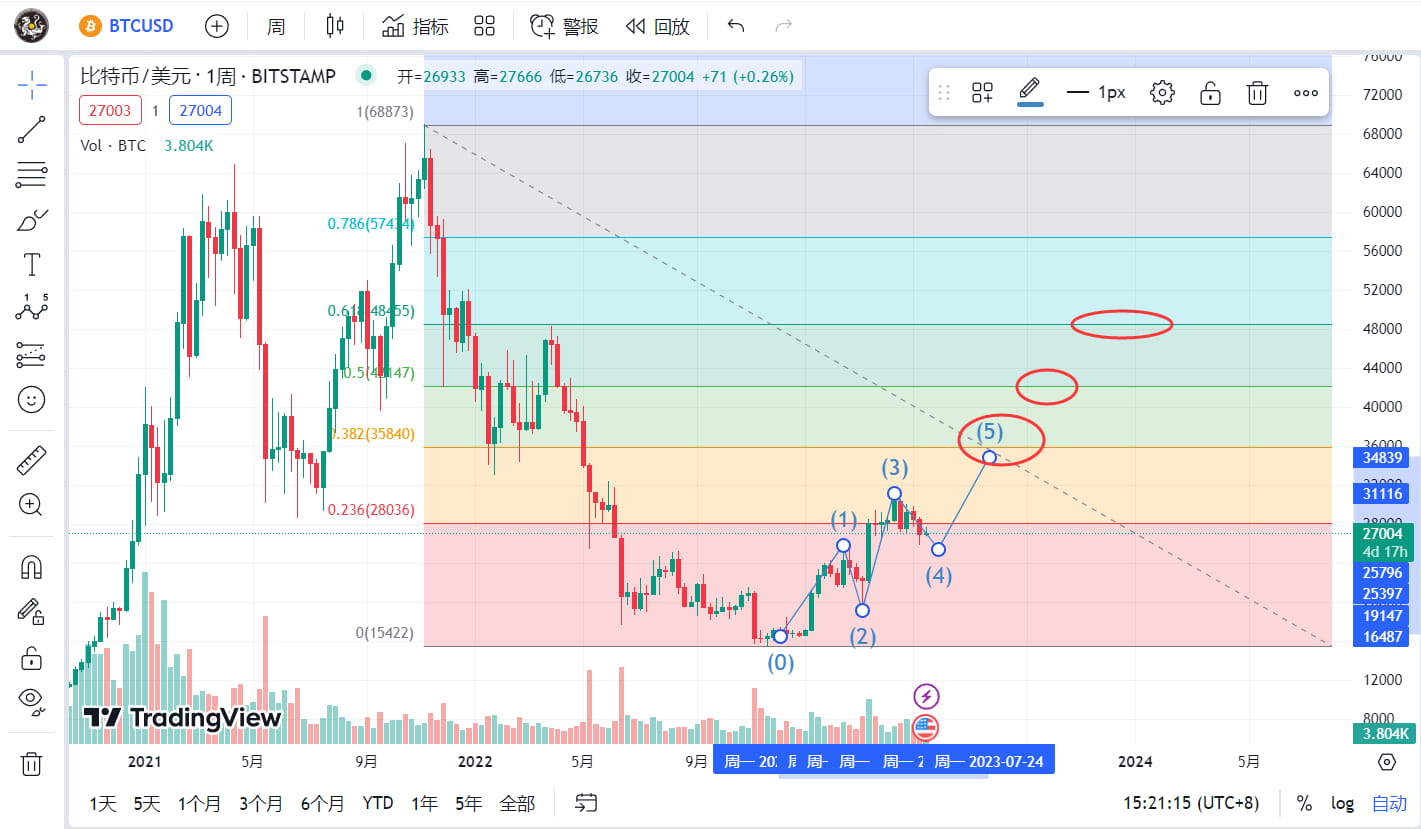
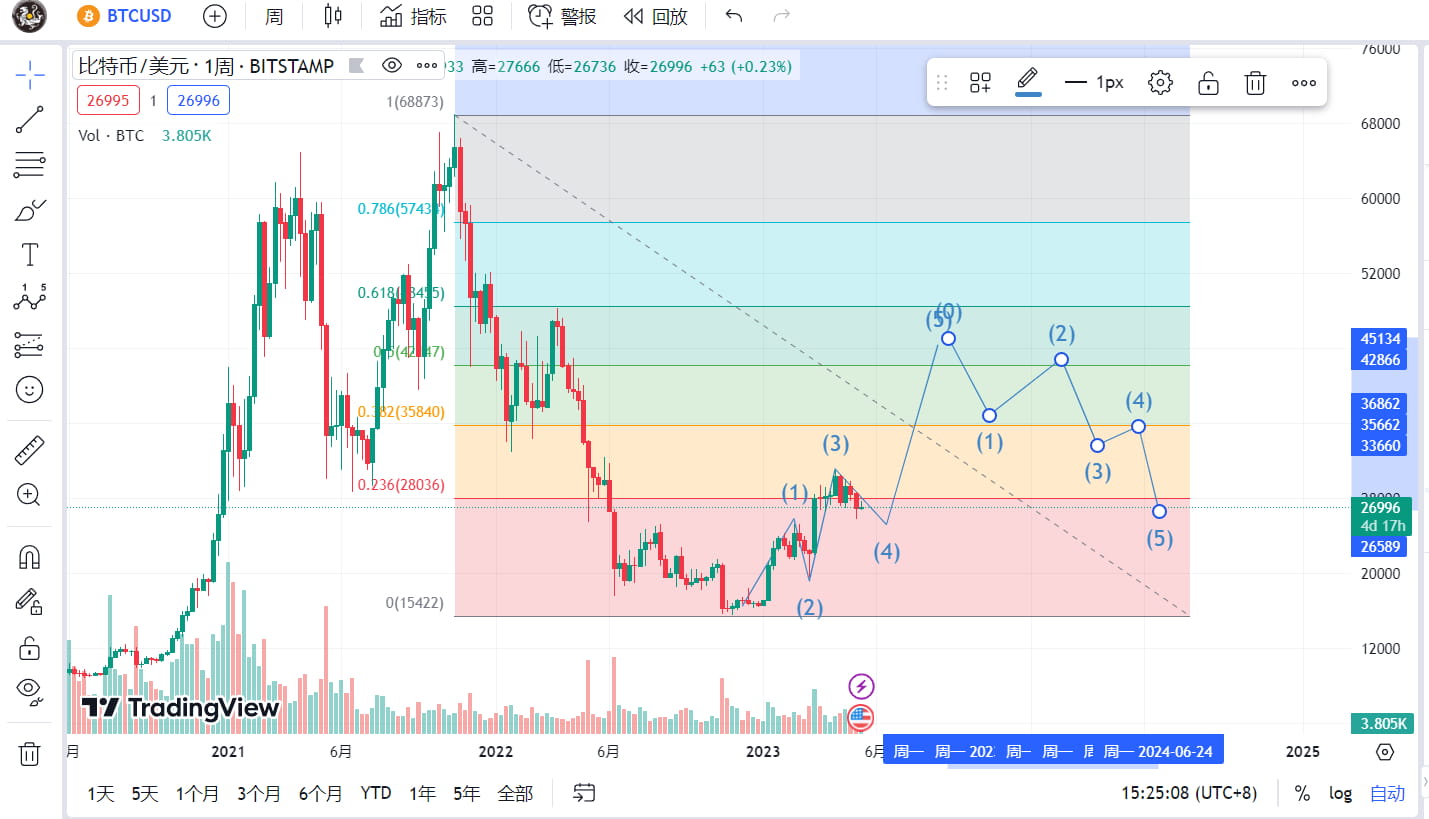
Now let's look at the trend in the short term from the weekly chart. The position of 0.386 is around 35,000-36,000. The worst result of the Fibonacci retracement indicator is around 20,000 at most, and it will not exceed this point. Under normal circumstances, it will probably be around 25,000-24,000 for a callback. The worst position of the 4th wave I just mentioned is what I just said. The worst may be a needle. . For the 5th wave, I think it is likely to hit 36,000 or even directly go to 48,000 before a callback. At that time, the possibility of a callback may be relatively high. There are several points marked in the graph. You can refer to it more.
I think I will give a very detailed time trend. If you still don't understand, you can follow my video and graphics. This is basically the approximate cyclical trend. Do you still remember why Jingcai asked everyone to escape from the top in October 2021? You can find Jingcai and take a screenshot and save it. Wait until next year and the year after next to come back. It must be a big cycle that can be verified by time.