

When we plan to participate in the Ethereum POS staking protocol, the numerous pools and node operators are dazzling, and how to choose has become a difficult problem for every staker. At this time, do you follow the crowd or are you willing to think independently and make your own rational choice based on data? This is related to your personal interests and the development of the Ethereum protocol ecosystem.
In this article, I will analyze all the relevant indicators of Ethereum staking for you, and explain the meaning of each indicator in easy-to-understand language and various vivid analogies.
Table of contents:
Four main indicators:
1. Participation Rate
2.Inclusion Delay
3. Correctness
4. Effectiveness rating
Indicators of interest:
5. Network penetration
6.Backward looking APR%
1.Participation Rate
When Ethereum switched to Proof of Stake (PoS), validators played a very important role. We can imagine the entire Ethereum PoS network as a large-scale sports event, and validators are like contestants.
Each epoch is like a competition. Participants (validators) need to perform well in each competition and successfully submit their attestation within the specified time. When the contestant's attestation is recorded in the event record, it means that they have successfully completed the competition.
Participation Rate is like a measure of each player's participation throughout the season. Players with high participation rates usually mean they are more reliable in the game and can better maintain network security. However, if the player does not successfully submit the results, they may face penalties.
When choosing a validator to participate in Ethereum PoS staking, Participation Rate is an indicator worth paying attention to. A validator with a high participation rate generally means that it performs well in the network, is better able to maintain network security, and is more reliable in completing verification tasks. This will help ensure the stable operation of the Ethereum network while also bringing higher profit potential to investors.
In the calculation of participation rate, the numerator is "the number of epochs a validator's attestation was included on-chain": this refers to the number of epochs in which a validator successfully submitted an attestation and was recorded on the blockchain.
The denominator is "the number of epochs that validator is active": this refers to the number of epochs that a validator has been active in the entire network, reflecting the total number of times the validator has attempted to participate in the verification work.
For example: Suppose a validator has been active for 100 epochs. In these 100 epochs, it successfully submitted attestations for 90 epochs and was recorded on the blockchain. Then, we can say that the participation rate of this validator is 90%. This is because it successfully participated in the work of 90 epochs, and actually had the opportunity to participate in 100 epochs.
2. Inclusion Delay
Inclusion Delay is a metric that measures the time it takes for an attestation submitted by a validator to actually be recorded on the chain. This metric reflects the timeliness of the validator's attestation.
To make an inappropriate analogy, the Ethereum network is like a post office, and validators need to deliver letters (attestation) to this post office. When they complete the verification of a block, they will create a letter (ie attestation) and send it to the post office (ie broadcast to the Ethereum network).
Ideally, validators want their letters to arrive as quickly as possible and be processed by the post office (recorded on-chain). However, in reality, there may be various reasons that cause letter delivery delays, such as network congestion, hardware failure, etc. Therefore, the actual delivery time of the letter to the post office may be later than expected.
Inclusion Delay is a metric used to measure this delay. Specifically, it calculates the average difference between the validator's expected letter delivery time (i.e., the expected slot) and the time when the letter was actually processed by the post office (i.e., the slot actually recorded on the chain).
A lower Inclusion Delay means that the attestation submitted by the validator can be recorded on the chain faster, thereby improving the efficiency and security of the entire network.
Calculation method: Inclusion Delay is calculated by measuring the difference between the expected slot of the attestation submitted by the validator and the slot actually recorded on the chain, and then averaging these differences.
Specific steps are as follows:
For each validator, find the attestation they submitted.
Determine the expected slot for each attestation. This is typically the slot the validator was assigned in that epoch.
Determine the slot in which each attestation is actually recorded on the chain. This can be obtained by inspecting the blockchain data.
For each attestation, calculate the difference (i.e. delay) between the expected slot and the slot actually recorded on the chain: delay = actual slot - expected slot.
Calculate the average of attestation delays across all validators.
3.correctness
In Ethereum 2.0, correctness is a measure of whether the validator can accurately identify the state of the chain when submitting attestation. It includes two aspects: Head vote and Target vote.
If you imagine the entire Ethereum POS network as a huge team, each validator is a member of the team. Their task is to build a complete high-rise building, and each block is a floor of this building.
The head vote is like confirming the latest completed floor in the construction project. The validator needs to keep an eye on the progress of the building and ensure that the information he has is up to date. This is just like the team members need to maintain close communication and collaboration with other members to ensure that they have a clear understanding of the overall progress of the project.
Target vote is similar to the team members needing to regularly evaluate the key nodes of the entire project to ensure that the project proceeds in accordance with the predetermined direction and goals. Casper FFG target checkpoints are these key nodes, and validators need to make correct decisions at key nodes to provide support for the stable construction of the entire building.
In this team, the performance of each member will affect the efficiency of the entire team and the success of the project. Correctness is an important basis for measuring the performance of each validator in this team. Excellent validators can accurately complete the Head vote and Target vote tasks and contribute to the construction work of the entire team. Validators with poor performance may slow down the progress of the entire team and may even be punished for wrong decisions. Therefore, when choosing a validator to participate in Ethereum POS staking, correctness is an indicator worth paying attention to.
4. Effectiveness rating
The effectiveness rating is a score that measures the performance of a validator on the Ethereum beacon chain. It is calculated by taking a weighted average of the effectiveness of the proposer and the attester.
In Ethereum, proposers and attesters play different but very important roles. We can compare them to "parliament".
In this parliament, the proposer is like a member of parliament who proposes a motion, and they are responsible for creating a new block and packaging the transaction in it. The attestor is like a member of parliament who votes on these motions, and they need to verify and confirm the blocks proposed by the proposer.
In each block cycle, a proposer will propose a new block, and a series of other attesters will need to confirm this block. If it is recognized by enough attesters, the block will be added to the blockchain, thus forming a consensus.
Since the Ethereum Merge, the ratio of execution layer and consensus layer rewards is close to 1:4. Therefore, in the merged effectiveness scoring model, the weights of proposers and attestors are 3/8 and 5/8 respectively. The calculation formula is as follows: validator_effectiveness = (3/8 * proposer_effectiveness) + (5/8 * attester_effectiveness)
For example, if a validator has a proposer effectiveness of 0.9 and a prover effectiveness of 0.8, its effectiveness rating can be calculated as: (1/8 * 0.9) + (7/8 * 0.8) = 0.1125 + 0.7 = 0.8125
It should be noted that with the recent surge in gas fees, the rewards for the execution layer are also expanding dramatically. The ratio of the execution layer rewards to the consensus layer has reached 1:1, and sometimes even exceeds the consensus layer rewards, which is a completely reversed situation from the past.
I believe that in the future bull market of Ethereum, the rewards of the execution layer may become the bulk of the rewards for validators, so which staking protocol do you choose, who are their node operators, which MEV-BOOST relay is connected, and what is the market share. If you still have some decentralization pursuits, then whether the protocol or node has diversified clients and how censorship-resistant it is will be your considerations in addition to your own income.
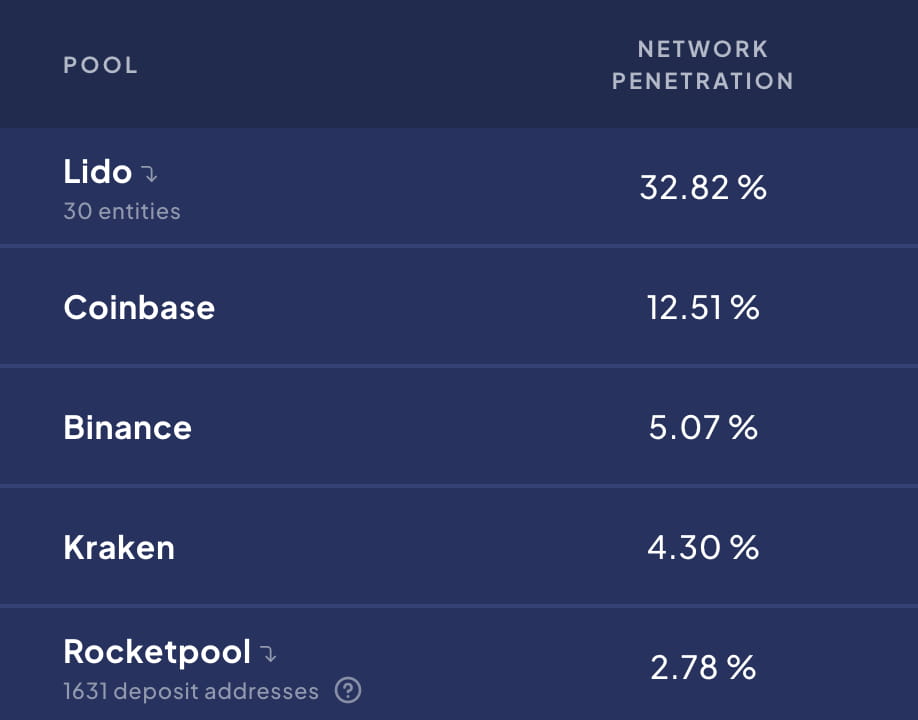
5. Network penetration
"Network penetration" refers to the stake percentage of a particular mining pool in the entire Ethereum beacon chain. It is calculated by dividing the active stake in the mining pool by the total active stake on the Ethereum beacon chain. Here, "active stake" refers to the balance after adding up 32 ETH as a unit.
For example, suppose there is a total of 1000 ETH of effective stake in the Ethereum beacon chain, and a particular mining pool has an effective stake of 200 ETH. Then, the "Network penetration" of the mining pool is: (200 ETH) / (1000 ETH) = 0.2 or 20%. This means that the mining pool has a 20% stake in the entire beacon chain.
It should be noted that the "Network penetration" metric only takes into account the initial 32 ETH stake of each validator. The portion exceeding 32 ETH is not included in the effective stake.
In addition, if one or several protocols occupy too large a proportion of Ethereum's equity, it will bring serious centralization risks to Ethereum and damage the interests of the entire ecosystem. We can see that the top two staking entities, lido and coinbase, account for more than 45% of the market share of Ethereum POS staking, and the top five staking entities account for 57% of the market share. The centralization risk cannot be underestimated.
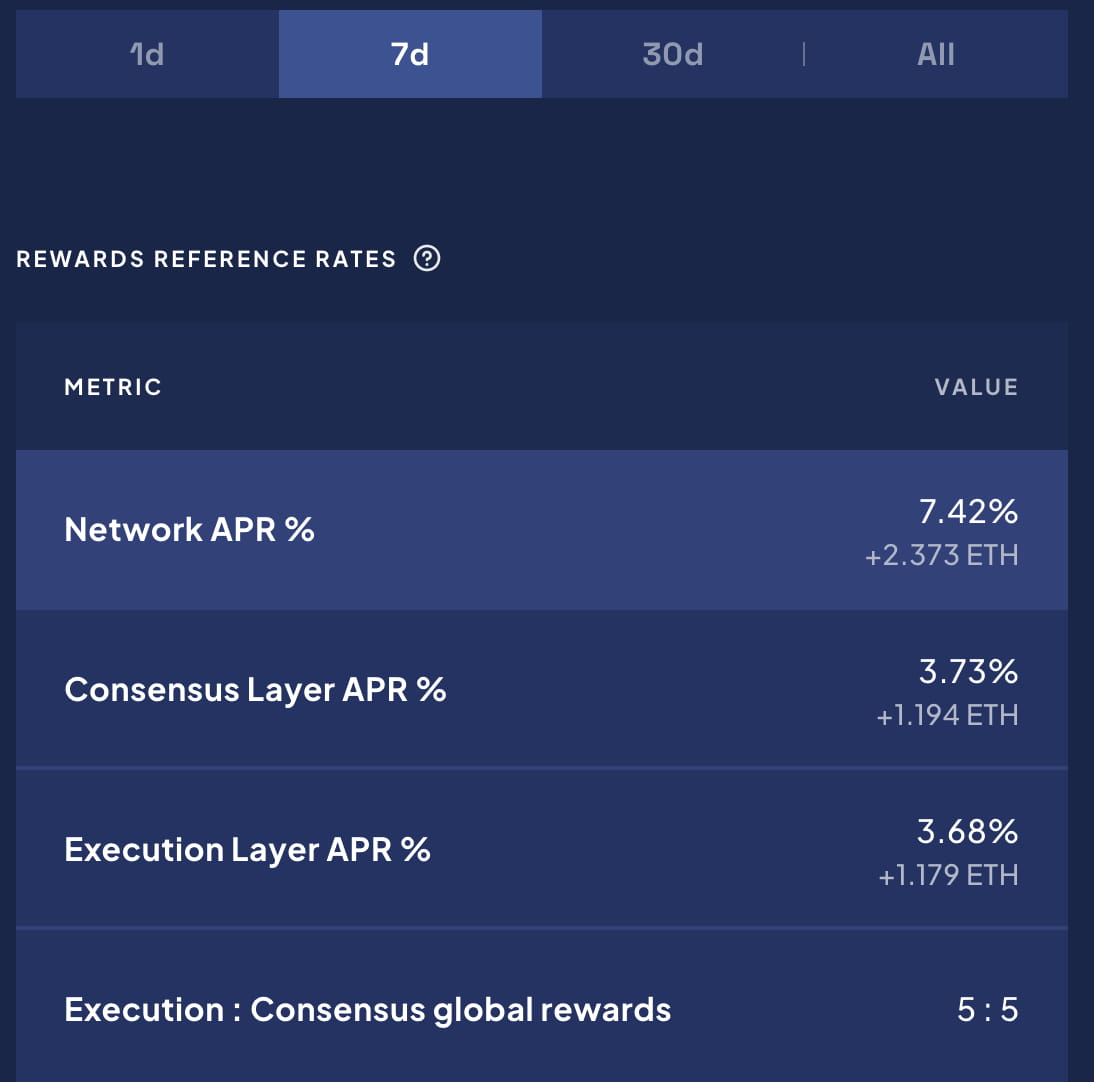
6. How to calculate Backward looking APR%
"Backward looking APR%" is a measure of return rate, which is used to calculate the annualized rate of return in a specific period of time in the past (such as 1 day, 7 days, 30 days or all time). Its size directly reflects the actual return of the Ethereum we staked in the past period of time. The following is a simplified calculation method:
Select a time period (eg 1 day, 7 days, 30 days, etc.).
The total rewards earned during the time period (including consensus layer (CL) and execution layer (EL) rewards) are calculated and then divided by the effective stake (not taking into account additional rewards earned).
Calculate the total effective stake of each entity over a given time period. This is done by taking the number of active validators for each entity and multiplying it by 32 ETH (the stake requirement for each validator).
Calculate APR%: (Total Reward ETH / Total Effective Equity) / Time Period * 365 Days * 100.
Currently, the longest timeframe is limited to 90 days to allow for better comparison and avoid double-digit APR% skewing the comparison due to early participation like the Genesis validator.
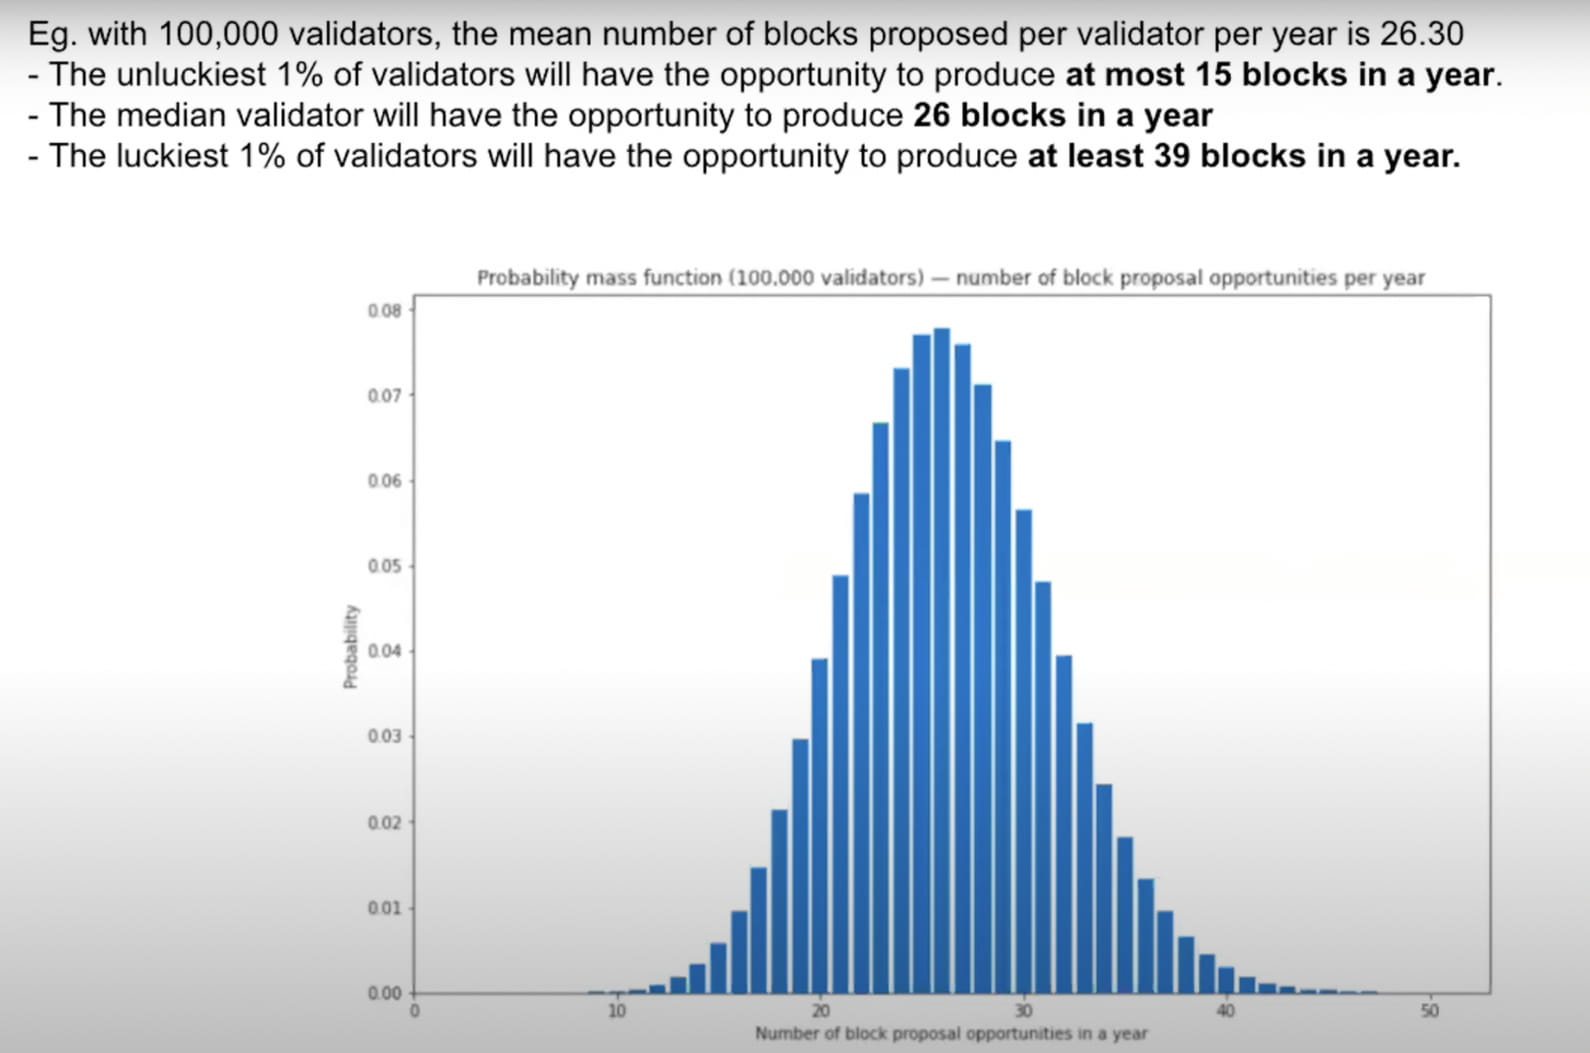
The most important factors affecting APR income are the two rewards of the consensus layer (CL) and the execution layer (EL). As a validator, the rewards of the consensus layer are very small, because every staker who works normally will submit an attestation to get the reward, but as a validator who is only selected as a proposer, the execution layer (EL) reward is obtained. There is a certain probability of obtaining this reward. The number of times a proposer is selected in a year follows a normal distribution. The difference between the luckiest validator and the unluckiest validator in obtaining the execution layer reward will be relatively large. The luckiest validator can submit 39 blocks, while the unluckiest validator can only submit 15. This is reflected in the fact that over a period of time, the APR differences of different staking protocols will be relatively large.
Through the above six main indicators, we can comprehensively evaluate the reliability of a staking protocol or node operator. Especially before and after the Shanghai upgrade, many node operators' client terminals were not updated to the latest version, causing a short-term decline in most indicators. There is also the recent incident in which the Ethereum beacon chain lost finality for a short period of time, which is a test of the staking protocol and node operators' ability to handle emergencies in extreme situations.
I believe that as an Ethereum staker, most people are optimistic about the Ethereum ecosystem in the long term. Long-term, secure and stable staking protocols and node operators are the focus that every Ethereum staker must pay attention to. I hope that this technical article can give the majority of Ethereum stakers a clearer perspective and help you make your own choice.