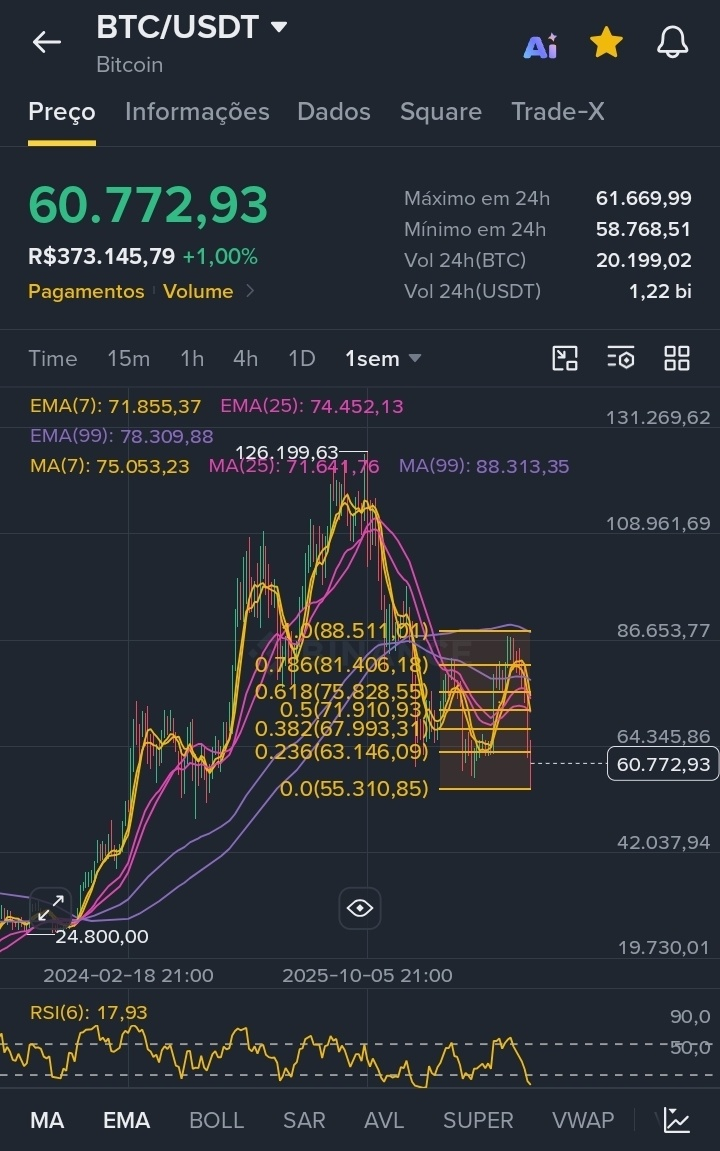
BTC Analysis - 1 Week
Bitcoin is trading around US$60,750, with the week down approximately 7% and the month showing a loss of more than 25%. On the weekly chart, the asset fell below the 200-week moving average, which had been acting as a structural floor since mid-August, and is now testing the lower end of the support zone.
The main support is at US$55,000, the weekly low and also the 52-week low, with the US$58,800 range acting as the first line of defense. The main resistance is at US$67,400, the 0.382 Fibonacci level, followed by US$65,800, the weekly high. Until the price recovers this range, the prevailing bias remains bearish.
The identifiable chart pattern is a double top in formation, with lower highs and lower lows since 2024, bounded by a diagonal resistance line that has held during recovery attempts. The Fibonacci retracement projection reinforces the US$60,000 to US$62,000 zone as a decision area, and a decisive break below US$55,000 would leave room for the correction to continue.
Also watch weekly volume and relative strength, which remain weak—a scenario that tends to favor the continuation of the downward move rather than an immediate reversal.
#bitcoin #BTC #Analisatrader #Fibonacci $BTC
This is not investment advice. Do your own analysis and manage your risk.
Bitcoin is trading around US$60,750, with the week down approximately 7% and the month showing a loss of more than 25%. On the weekly chart, the asset fell below the 200-week moving average, which had been acting as a structural floor since mid-August, and is now testing the lower end of the support zone.
The main support is at US$55,000, the weekly low and also the 52-week low, with the US$58,800 range acting as the first line of defense. The main resistance is at US$67,400, the 0.382 Fibonacci level, followed by US$65,800, the weekly high. Until the price recovers this range, the prevailing bias remains bearish.
The identifiable chart pattern is a double top in formation, with lower highs and lower lows since 2024, bounded by a diagonal resistance line that has held during recovery attempts. The Fibonacci retracement projection reinforces the US$60,000 to US$62,000 zone as a decision area, and a decisive break below US$55,000 would leave room for the correction to continue.
Also watch weekly volume and relative strength, which remain weak—a scenario that tends to favor the continuation of the downward move rather than an immediate reversal.
#bitcoin #BTC #Analisatrader #Fibonacci $BTC
This is not investment advice. Do your own analysis and manage your risk.