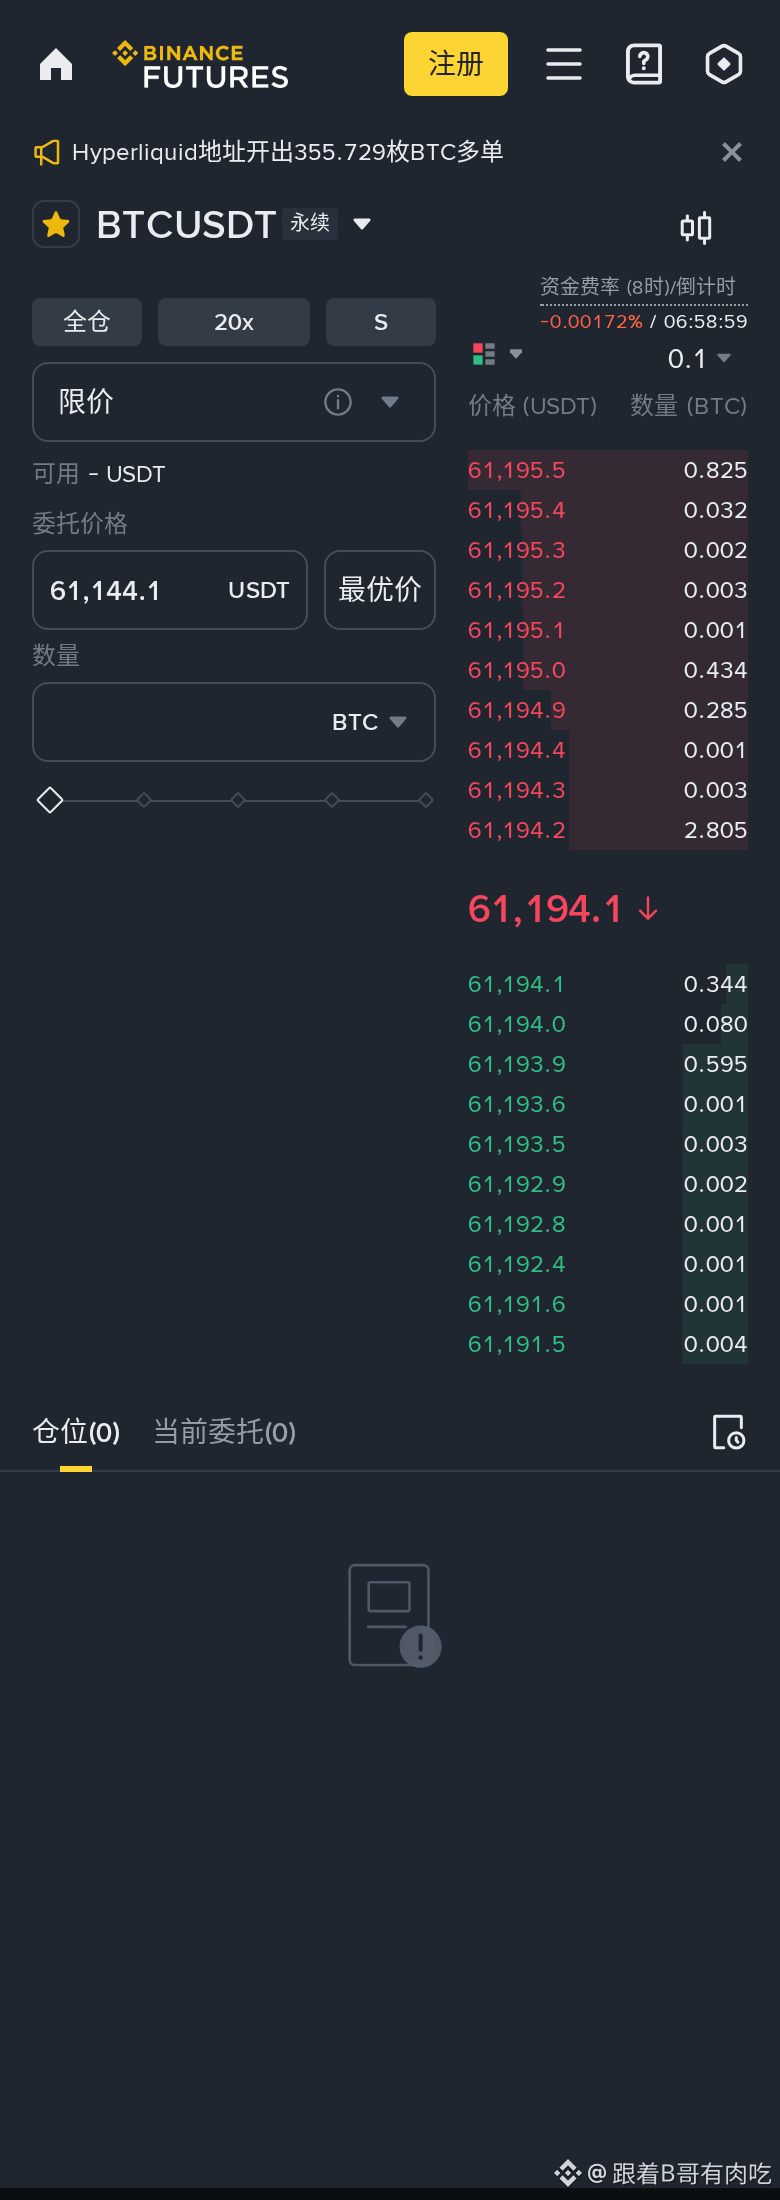
BTC has to give us an answer at this level
1H/4H direction: Long, current price 61,271
Conclusion first: Go long at the current price of 61,271, stop-loss at 59,916. If it breaks below that, admit you were wrong.
· 58,768 below is support, where buyers may step in; 61,671 above is resistance, where selling pressure may emerge
How to trade (long):
· Entry: Go long at the current price of 61,271
· Stop: 59,916 (take the 2.2% loss and move on; don't hold and hope)
· Target: 65,334 (first target; take half off when it gets there)
· Position: Start with 2–3% of your capital to test the waters; don't go all in
⚠️ The broader 4H direction hasn't emerged yet, so this trade goes against the shorter timeframe: halve your position and don't move your stop-loss.
(Win rates are based on historical statistics and aren't guaranteed; if you follow a trade, always use a stop-loss and manage your position size.)
Here are the key points on the chart.
1、$BTC Current price 61,271, with a bullish MACD crossover. Enter at 61,271, stop-loss at 59,916, and look first to 64,085. Trading volume is 442.5M, noticeably higher than the previous two days. The short-term range is clear: support at 58,768, resistance at 61,671. If going long, use support as your line in the sand.
Take profit when the first target of 61,671 is reached. Don't expect it to shoot straight to the moon—the only gains that count are the ones you bank.
Price is still above the 20-day moving average at 60,423; the trend is intact.
I've already opened a small starter position, with a stop-loss at 59,916. I'll leave the rest to discipline.
Let's do the math: support at 58,768 is 4.1% lower, while resistance at 61,671 is only 0.7% higher. The upside here doesn't justify the risk, so don't enter at this level.
Even if it moves above 61,671, don't rush to chase it; it still has to clear 64,085 above.
What do you think? Let's discuss in the comments.
#BTC #Bitcoin
【Live Market Scan · $BTC 】(1-hour primary trend + 4H filter)
4H trend: Sideways|1-hour setup: Not yet established (keep waiting)
Bull/bear score: 9 points (bullish alignment +3 | MACD bullish +1 | above zero line +1 | RSI stabilizing +1 | near EMA20 +1 | bottom-fishing signal +2)
Current price 61,271 RSI 73.22 Support 58,768 / Resistance 61,671
Conclusion: Bullish score is stronger (setup not fully confirmed) → Maintain a bullish bias; recommend waiting for a pullback to the right level before going long
$BTC
1H/4H direction: Long, current price 61,271
Conclusion first: Go long at the current price of 61,271, stop-loss at 59,916. If it breaks below that, admit you were wrong.
· 58,768 below is support, where buyers may step in; 61,671 above is resistance, where selling pressure may emerge
How to trade (long):
· Entry: Go long at the current price of 61,271
· Stop: 59,916 (take the 2.2% loss and move on; don't hold and hope)
· Target: 65,334 (first target; take half off when it gets there)
· Position: Start with 2–3% of your capital to test the waters; don't go all in
⚠️ The broader 4H direction hasn't emerged yet, so this trade goes against the shorter timeframe: halve your position and don't move your stop-loss.
(Win rates are based on historical statistics and aren't guaranteed; if you follow a trade, always use a stop-loss and manage your position size.)
Here are the key points on the chart.
1、$BTC Current price 61,271, with a bullish MACD crossover. Enter at 61,271, stop-loss at 59,916, and look first to 64,085. Trading volume is 442.5M, noticeably higher than the previous two days. The short-term range is clear: support at 58,768, resistance at 61,671. If going long, use support as your line in the sand.
Take profit when the first target of 61,671 is reached. Don't expect it to shoot straight to the moon—the only gains that count are the ones you bank.
Price is still above the 20-day moving average at 60,423; the trend is intact.
I've already opened a small starter position, with a stop-loss at 59,916. I'll leave the rest to discipline.
Let's do the math: support at 58,768 is 4.1% lower, while resistance at 61,671 is only 0.7% higher. The upside here doesn't justify the risk, so don't enter at this level.
Even if it moves above 61,671, don't rush to chase it; it still has to clear 64,085 above.
What do you think? Let's discuss in the comments.
#BTC #Bitcoin
【Live Market Scan · $BTC 】(1-hour primary trend + 4H filter)
4H trend: Sideways|1-hour setup: Not yet established (keep waiting)
Bull/bear score: 9 points (bullish alignment +3 | MACD bullish +1 | above zero line +1 | RSI stabilizing +1 | near EMA20 +1 | bottom-fishing signal +2)
Current price 61,271 RSI 73.22 Support 58,768 / Resistance 61,671
Conclusion: Bullish score is stronger (setup not fully confirmed) → Maintain a bullish bias; recommend waiting for a pullback to the right level before going long
$BTC