When moving averages are tangled, should you make a move? The answer is: don’t chase; wait for confirmation—here’s a reusable chart-reading method using $XRP .
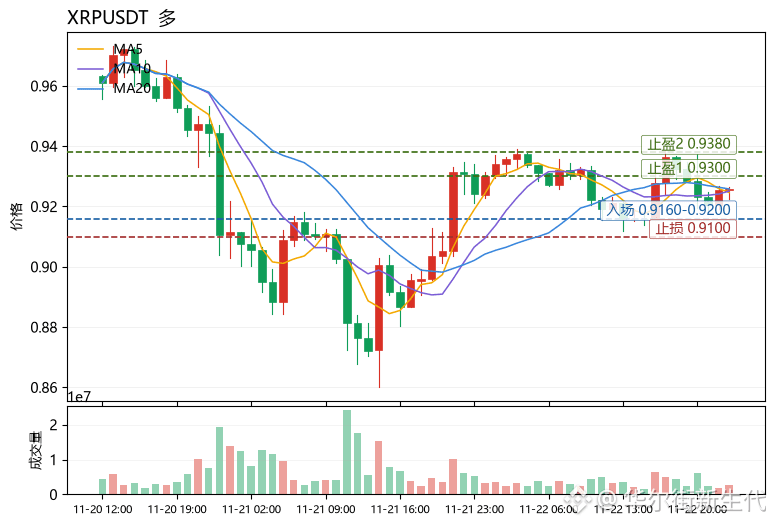
To judge whether a trend is healthy, first look at the moving-average alignment: MA5 is below MA20, indicating that short-term momentum is weaker than medium-term momentum and the trend has yet to strengthen. Any rebound at this point is merely a recovery, not a reversal. Next, look at the MACD histogram value of -0.0002935. Bearish momentum is still present, but its absolute value is tiny—a classic case of “weak bearishness.” With RSI at 51.5, in neutral territory, the price is more likely to move sideways than to fall sharply in one direction. The Bollinger Band upper and lower bands at 0.938275 and 0.913325 form a range about 2.7% wide, while the amplitude over 30 candlesticks is just 5.22%, clearly showing a converging pattern. The funding rate of +0.0022% shows that longs are still paying to hold positions, but the Fear and Greed Index at 11 indicates extreme fear and sentiment at rock bottom. In this combination, chasing shorts offers poor risk-reward; it makes more sense to wait for the price to retest and find support near the lower band.
The bias is bullish, but only for buying dips at the lower end of the range: entry at 0.9160–0.9200, because this area is close to the lower Bollinger Band at 0.913325 and below MA5, making it a low-volume pullback zone; take-profit 1 at 0.9300, corresponding to the first resistance above MA20 and near the Bollinger middle band; take-profit 2 at 0.9380, near the range top at the upper Bollinger Band of 0.938275; stop-loss at 0.9100, as a break below the lower Bollinger Band would invalidate the converging pattern and turn weak bearishness into strong bearishness. If the price first breaks above MA20 on increased volume and holds there, abandon the dip-buying plan and wait for a confirmed retest before entering.
Also watch: $TRX, $SOL—both have MA5 above MA20 and positive MACD, making them relatively stronger than XRP and useful supplementary indicators for a sentiment recovery.
(Personal opinion for reference only; this is not investment advice. Futures trading carries extremely high risk; please manage position sizes strictly.)
[Data]
Coin: XRPUSDT
Direction: Long
Entry: 0.9160-0.9200
Take-profit 1: 0.9300
Take-profit 2: 0.9380
Stop-loss: 0.9100
To judge whether a trend is healthy, first look at the moving-average alignment: MA5 is below MA20, indicating that short-term momentum is weaker than medium-term momentum and the trend has yet to strengthen. Any rebound at this point is merely a recovery, not a reversal. Next, look at the MACD histogram value of -0.0002935. Bearish momentum is still present, but its absolute value is tiny—a classic case of “weak bearishness.” With RSI at 51.5, in neutral territory, the price is more likely to move sideways than to fall sharply in one direction. The Bollinger Band upper and lower bands at 0.938275 and 0.913325 form a range about 2.7% wide, while the amplitude over 30 candlesticks is just 5.22%, clearly showing a converging pattern. The funding rate of +0.0022% shows that longs are still paying to hold positions, but the Fear and Greed Index at 11 indicates extreme fear and sentiment at rock bottom. In this combination, chasing shorts offers poor risk-reward; it makes more sense to wait for the price to retest and find support near the lower band.
The bias is bullish, but only for buying dips at the lower end of the range: entry at 0.9160–0.9200, because this area is close to the lower Bollinger Band at 0.913325 and below MA5, making it a low-volume pullback zone; take-profit 1 at 0.9300, corresponding to the first resistance above MA20 and near the Bollinger middle band; take-profit 2 at 0.9380, near the range top at the upper Bollinger Band of 0.938275; stop-loss at 0.9100, as a break below the lower Bollinger Band would invalidate the converging pattern and turn weak bearishness into strong bearishness. If the price first breaks above MA20 on increased volume and holds there, abandon the dip-buying plan and wait for a confirmed retest before entering.
Also watch: $TRX, $SOL—both have MA5 above MA20 and positive MACD, making them relatively stronger than XRP and useful supplementary indicators for a sentiment recovery.
(Personal opinion for reference only; this is not investment advice. Futures trading carries extremely high risk; please manage position sizes strictly.)
[Data]
Coin: XRPUSDT
Direction: Long
Entry: 0.9160-0.9200
Take-profit 1: 0.9300
Take-profit 2: 0.9380
Stop-loss: 0.9100