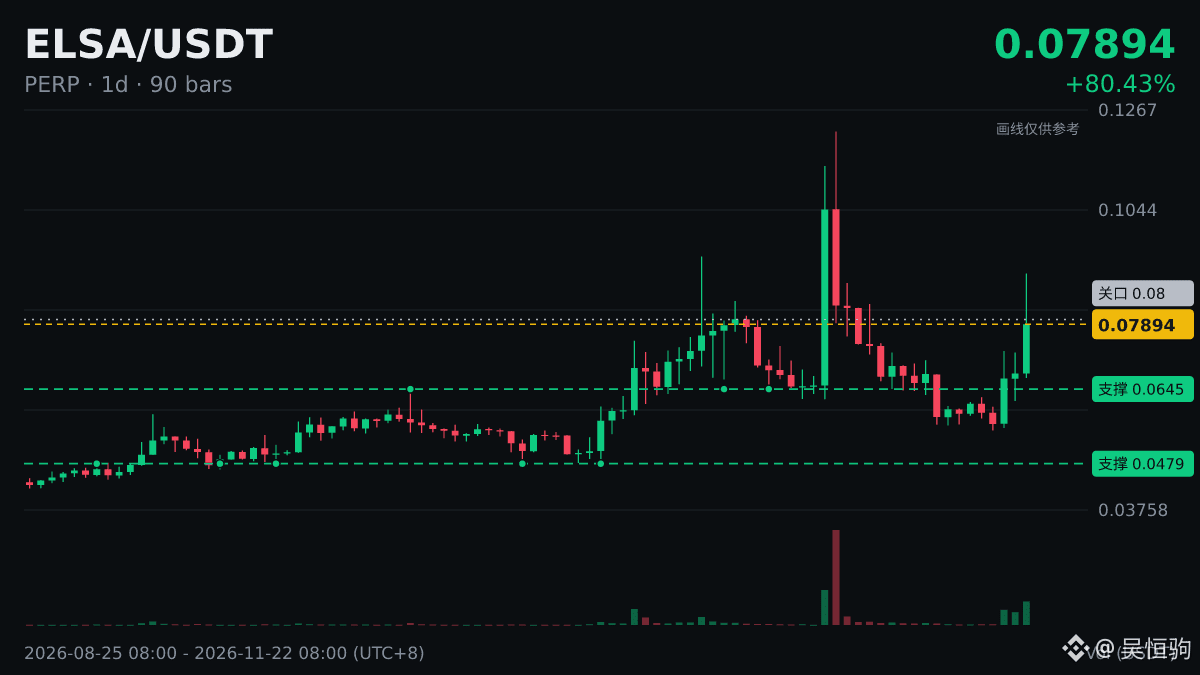

$ELSA MACD monitoring
Period: Daily
Signal: Golden cross (fast line DIF crosses above slow line DEA)
Zero axis: Below the zero axis
Countertrend bars: 14
Current price: 0.07906
24h: +19.12%
How do you interpret this set of data?
Period: Daily
Signal: Golden cross (fast line DIF crosses above slow line DEA)
Zero axis: Below the zero axis
Countertrend bars: 14
Current price: 0.07906
24h: +19.12%
How do you interpret this set of data?