$RLUSD: A Higher Low Does Not Reveal Who Bought
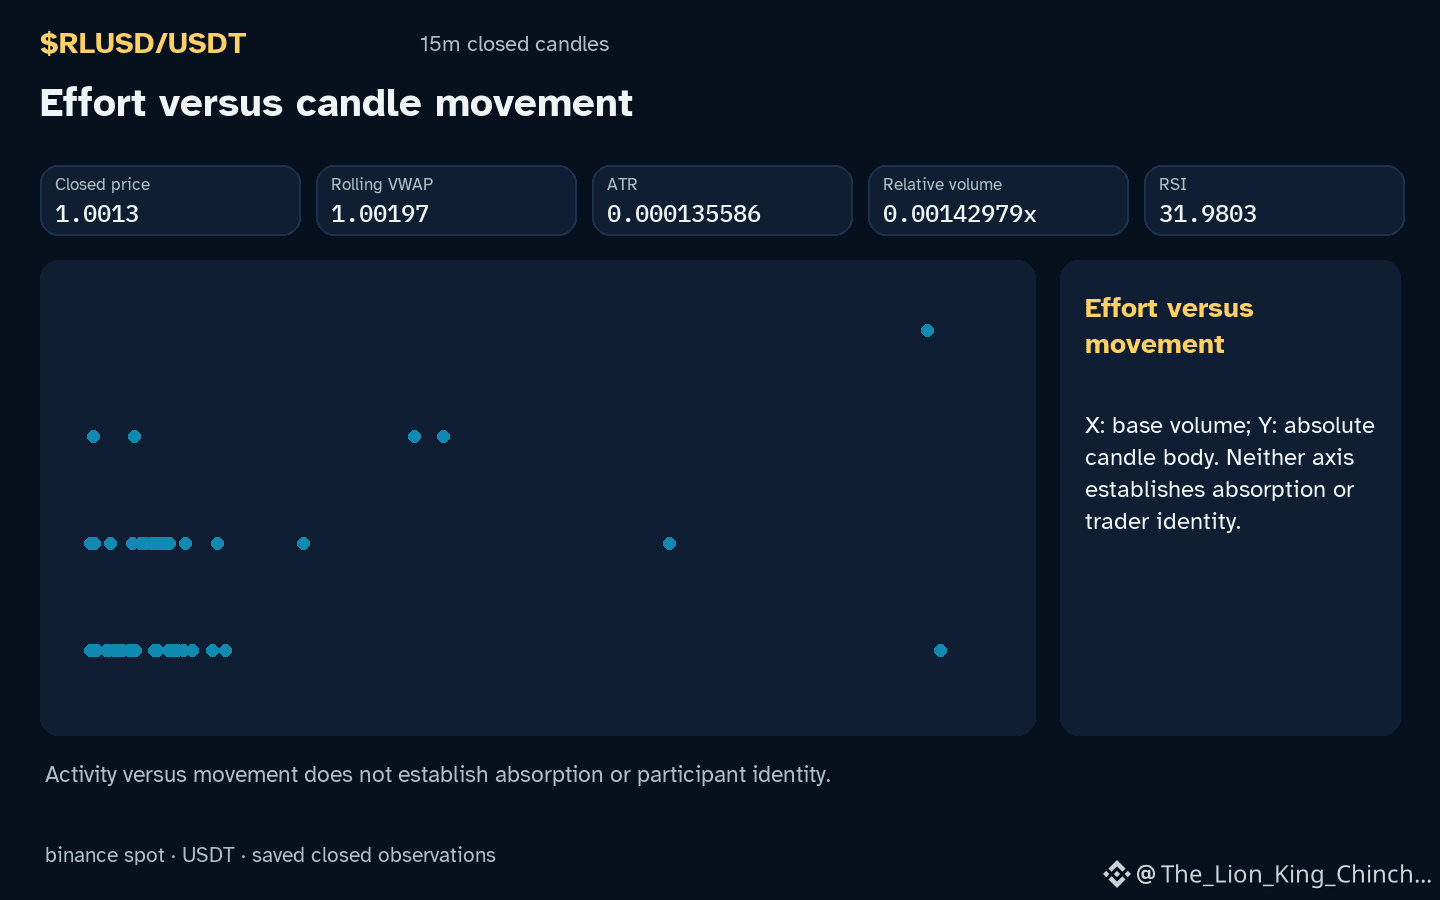
Does a higher low prove demand is entering $RLUSD? The asset currently trades below support while the hourly direction is down. Volume is not above baseline. This setting invites a hypothetical mechanism. Imagine buyers acting before a visible move. They would push the low higher. This creates a structural shift without immediate volume. The clue is the shape of the range. An alternative reading is simple exhaustion of sellers. Price stops falling, but new money does not arrive. Both views fit the local recorded data. A counterexample would be a false higher low. Price rises slightly, then breaks the previous low. This shows the rise was just a pause. It was not true demand. That outcome would weaken the demand interpretation. It would support the exhaustion view. The evidence has strict limits. Candles and relative volume 0.00142979x baseline cannot confirm order flow. They cannot prove specific traders are front-running. They only show price structure. RSI 32.0 is a smoothed reading. It does not prove capitulation or reversal. It is just a number. To reassess, wait for the next closed candle. If it closes below the recent low, the higher-low theory fails. If it holds above support, the structure remains intact. For now, the data shows a static range. It does not show intent. Treat the higher low as a possibility. Do not treat it as a fact of trader behavior. The distinction matters for clarity. Keep the analysis grounded in what is visible. Avoid inferring motives from the charts. The mechanism is a thought experiment. It helps explain how structure can look. It does not explain why it happens here. Stick to the observed facts. The trade remains open. The next candle decides the validity of the shape.
Probabilistic market research, not a recommendation or guaranteed return.
#RLUSD #MarketAnalysis
Does a higher low prove demand is entering $RLUSD? The asset currently trades below support while the hourly direction is down. Volume is not above baseline. This setting invites a hypothetical mechanism. Imagine buyers acting before a visible move. They would push the low higher. This creates a structural shift without immediate volume. The clue is the shape of the range. An alternative reading is simple exhaustion of sellers. Price stops falling, but new money does not arrive. Both views fit the local recorded data. A counterexample would be a false higher low. Price rises slightly, then breaks the previous low. This shows the rise was just a pause. It was not true demand. That outcome would weaken the demand interpretation. It would support the exhaustion view. The evidence has strict limits. Candles and relative volume 0.00142979x baseline cannot confirm order flow. They cannot prove specific traders are front-running. They only show price structure. RSI 32.0 is a smoothed reading. It does not prove capitulation or reversal. It is just a number. To reassess, wait for the next closed candle. If it closes below the recent low, the higher-low theory fails. If it holds above support, the structure remains intact. For now, the data shows a static range. It does not show intent. Treat the higher low as a possibility. Do not treat it as a fact of trader behavior. The distinction matters for clarity. Keep the analysis grounded in what is visible. Avoid inferring motives from the charts. The mechanism is a thought experiment. It helps explain how structure can look. It does not explain why it happens here. Stick to the observed facts. The trade remains open. The next candle decides the validity of the shape.
Probabilistic market research, not a recommendation or guaranteed return.
#RLUSD #MarketAnalysis