#SolanaSets2027RoadmapToDoubleComputeCapacity
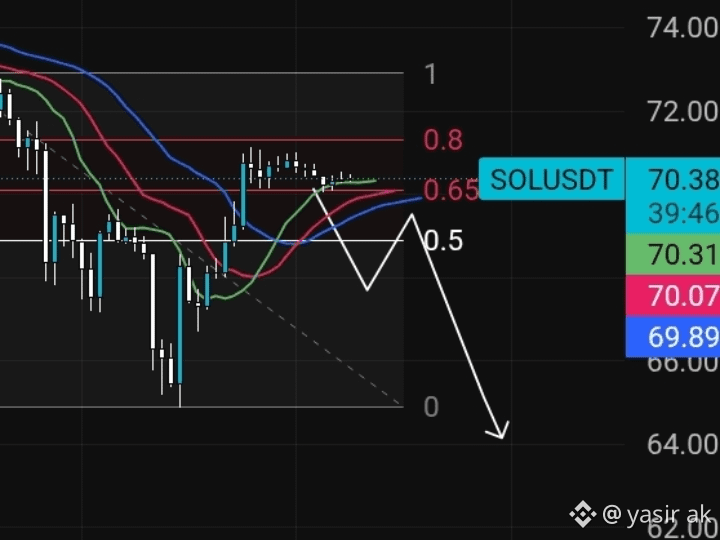
$SOL / USDT
Price Now:70.38 USDT
On right side you see:
70.31 Green line
70.07 Pink line
69.89 Blue line
Price is stuck near 70.00 70.38. Very tight.
What Does This Chart Show?
This chart is using Fibonacci Retracement 1, 0.8, 0.65, 0.5, 0
This is a tool traders use to find where price will stop and reverse.
1 level: Around 73.00 Top
0.8 level: Around 71.00 Red line, Resistance
0.65 level:Around 70.30 Where price is NOW
0.5 level: Around 69.00 White line, Support
level: Around 64.50 Bottom
The White Arrow What Is The Prediction?
The chart maker has drawn a white arrow:
Price will go up a little to 0.65 / 0.8 level, then go down a little to 0.5 level, then CRASH DOWN to level = 64.00
That means:
First: Small up to 70.80 71.00
Then: Small down to 69.00
Then: Big down to 64.00
This is a BEARISH prediction. The maker thinks SOL will fall from 70.38 to 64.00. That is 9% fall.
Moving Averages 3 Lines
You see 3 colored lines Blue, Pink, Green.
They are all coming together near 70.00. When all lines meet at one place, it means price is about to make a big move soon. It cannot stay stuck for long.
Right now price is below the blue line. That is slightly weak.
Support and Resistance
Resistance Ceiling:
1. 70.80 71.00 0.8 Fib, very strong
2. 73.00 1.0 Fib, top
Support Floor:
1. 69.00 0.5 Fib, first floor
2. 64.50 Fib, final target if crash happens
#SolanaSets2027RoadmapToDoubleComputeCapacity
$SOL / USDT
Price Now:70.38 USDT
On right side you see:
70.31 Green line
70.07 Pink line
69.89 Blue line
Price is stuck near 70.00 70.38. Very tight.
What Does This Chart Show?
This chart is using Fibonacci Retracement 1, 0.8, 0.65, 0.5, 0
This is a tool traders use to find where price will stop and reverse.
1 level: Around 73.00 Top
0.8 level: Around 71.00 Red line, Resistance
0.65 level:Around 70.30 Where price is NOW
0.5 level: Around 69.00 White line, Support
level: Around 64.50 Bottom
The White Arrow What Is The Prediction?
The chart maker has drawn a white arrow:
Price will go up a little to 0.65 / 0.8 level, then go down a little to 0.5 level, then CRASH DOWN to level = 64.00
That means:
First: Small up to 70.80 71.00
Then: Small down to 69.00
Then: Big down to 64.00
This is a BEARISH prediction. The maker thinks SOL will fall from 70.38 to 64.00. That is 9% fall.
Moving Averages 3 Lines
You see 3 colored lines Blue, Pink, Green.
They are all coming together near 70.00. When all lines meet at one place, it means price is about to make a big move soon. It cannot stay stuck for long.
Right now price is below the blue line. That is slightly weak.
Support and Resistance
Resistance Ceiling:
1. 70.80 71.00 0.8 Fib, very strong
2. 73.00 1.0 Fib, top
Support Floor:
1. 69.00 0.5 Fib, first floor
2. 64.50 Fib, final target if crash happens
#SolanaSets2027RoadmapToDoubleComputeCapacity