
$EVAA /USDT — 1H Chart Analysis
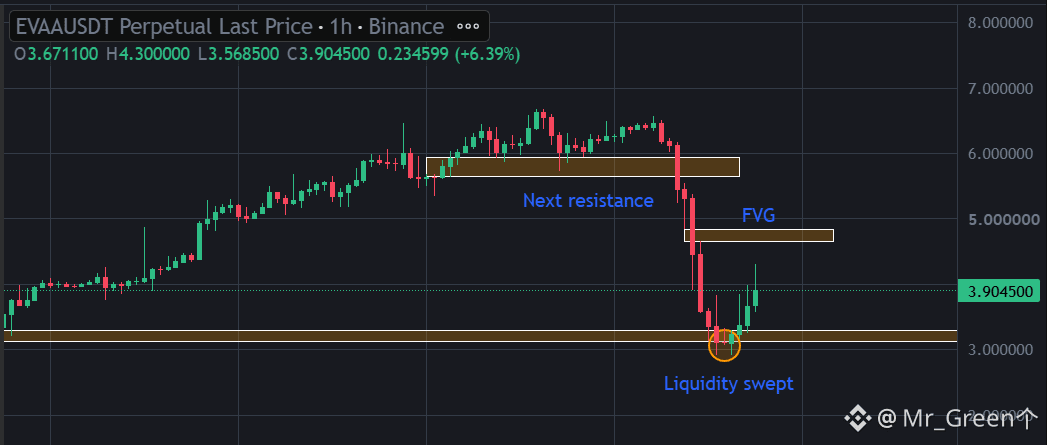
EVAA is showing an initial recovery after its sharp 4H sell-off of approximately 44%. On the 1H chart, price has bounced from the $3.00–$3.20 region after taking liquidity below the previous lows.
The liquidity sweep is an important development, but it does not automatically confirm a bullish reversal. Buyers have pushed the price toward $3.90, suggesting some short-term demand has returned. However, the broader structure remains vulnerable following the aggressive breakdown from the $6.00–$6.50 region.
Key levels to watch
$3.00–$3.20: Important support and recent liquidity-sweep area.
$3.90–$4.00: Immediate resistance and current recovery area.
$4.70–$4.85: Fair Value Gap (FVG), which could act as an upside reaction zone.
$5.65–$5.95: Major resistance and previous consolidation zone.
Possible scenarios
Bullish scenario: If EVAA holds above $3.20 and establishes higher lows, the recovery could extend toward $4.00 and potentially $4.70–$4.85, where the FVG is located. A move into the FVG does not necessarily mean the entire gap will be filled.
Bearish scenario: If the current recovery fails around $3.90–$4.00 and price breaks back below $3.20, the recent liquidity sweep may not lead to a sustained reversal. Another test of the $3.00 area could follow.
My assessment
The most interesting feature is the liquidity sweep around $3.00–$3.20 followed by a sharp recovery. This suggests buyers are responding to lower prices, but there is not enough evidence yet to declare a trend reversal.
I would focus on three things:
Whether EVAA can maintain support above $3.20.
Whether buyers can break and hold above $4.00.
How price reacts when it approaches the $4.70–$4.85 FVG.
For now, this looks like a short-term recovery attempt within a broader bearish structure. A sustained move above $4.85 would improve the outlook, while losing $3.20 would weaken the recovery considerably.
The next important confirmation will come from how price behaves around $4.00.
EVAA is showing an initial recovery after its sharp 4H sell-off of approximately 44%. On the 1H chart, price has bounced from the $3.00–$3.20 region after taking liquidity below the previous lows.
The liquidity sweep is an important development, but it does not automatically confirm a bullish reversal. Buyers have pushed the price toward $3.90, suggesting some short-term demand has returned. However, the broader structure remains vulnerable following the aggressive breakdown from the $6.00–$6.50 region.
Key levels to watch
$3.00–$3.20: Important support and recent liquidity-sweep area.
$3.90–$4.00: Immediate resistance and current recovery area.
$4.70–$4.85: Fair Value Gap (FVG), which could act as an upside reaction zone.
$5.65–$5.95: Major resistance and previous consolidation zone.
Possible scenarios
Bullish scenario: If EVAA holds above $3.20 and establishes higher lows, the recovery could extend toward $4.00 and potentially $4.70–$4.85, where the FVG is located. A move into the FVG does not necessarily mean the entire gap will be filled.
Bearish scenario: If the current recovery fails around $3.90–$4.00 and price breaks back below $3.20, the recent liquidity sweep may not lead to a sustained reversal. Another test of the $3.00 area could follow.
My assessment
The most interesting feature is the liquidity sweep around $3.00–$3.20 followed by a sharp recovery. This suggests buyers are responding to lower prices, but there is not enough evidence yet to declare a trend reversal.
I would focus on three things:
Whether EVAA can maintain support above $3.20.
Whether buyers can break and hold above $4.00.
How price reacts when it approaches the $4.70–$4.85 FVG.
For now, this looks like a short-term recovery attempt within a broader bearish structure. A sustained move above $4.85 would improve the outlook, while losing $3.20 would weaken the recovery considerably.
The next important confirmation will come from how price behaves around $4.00.