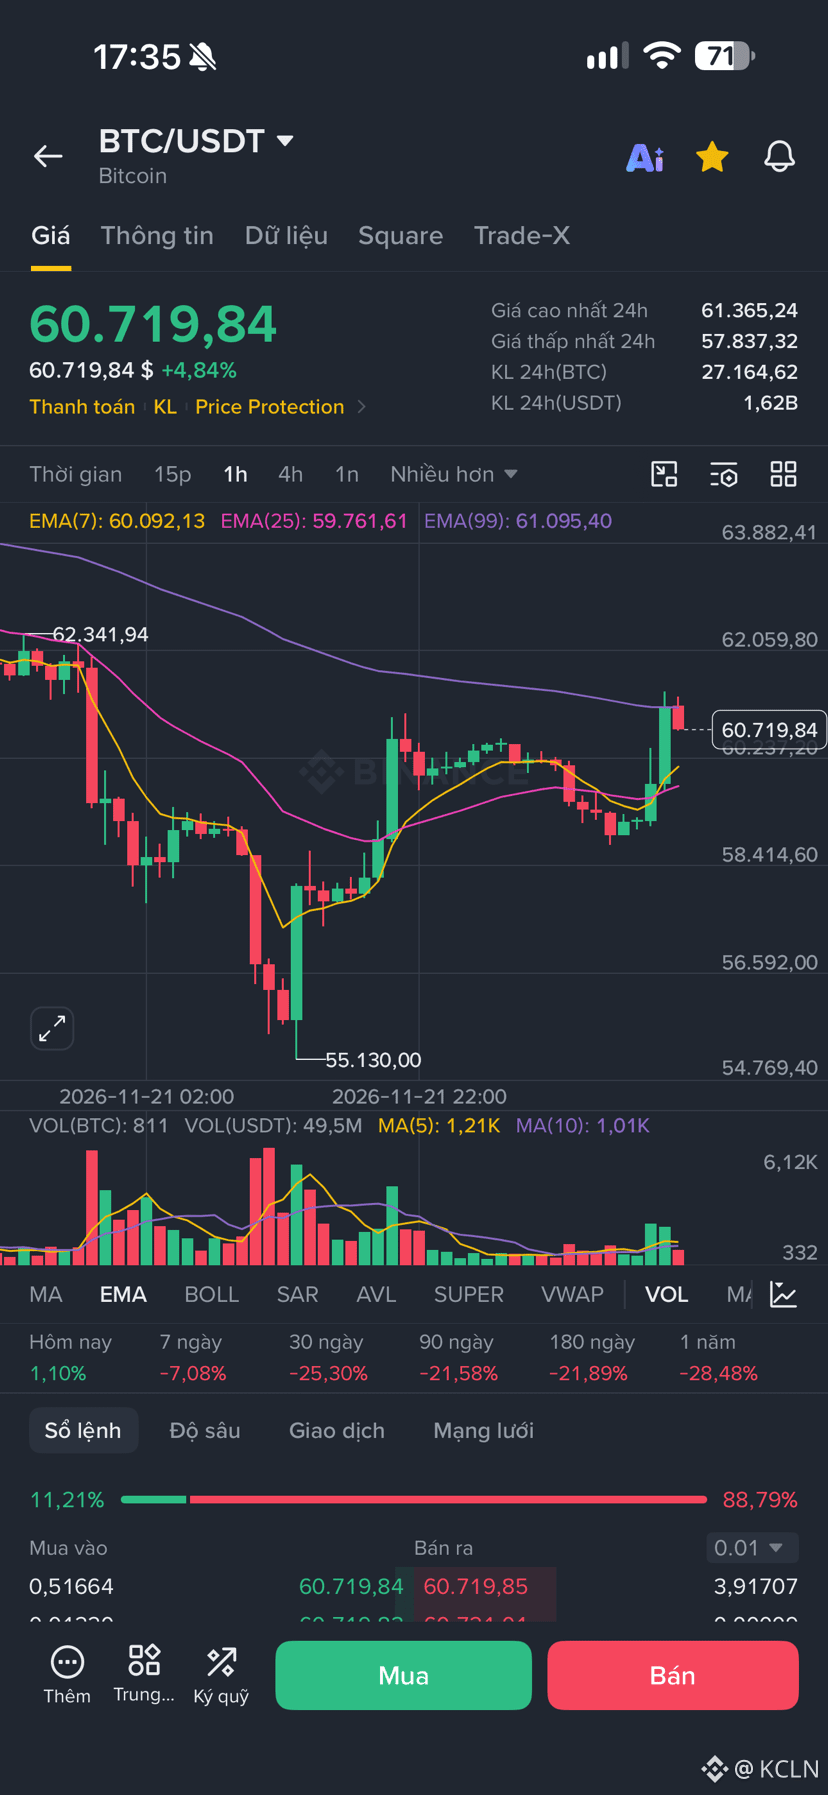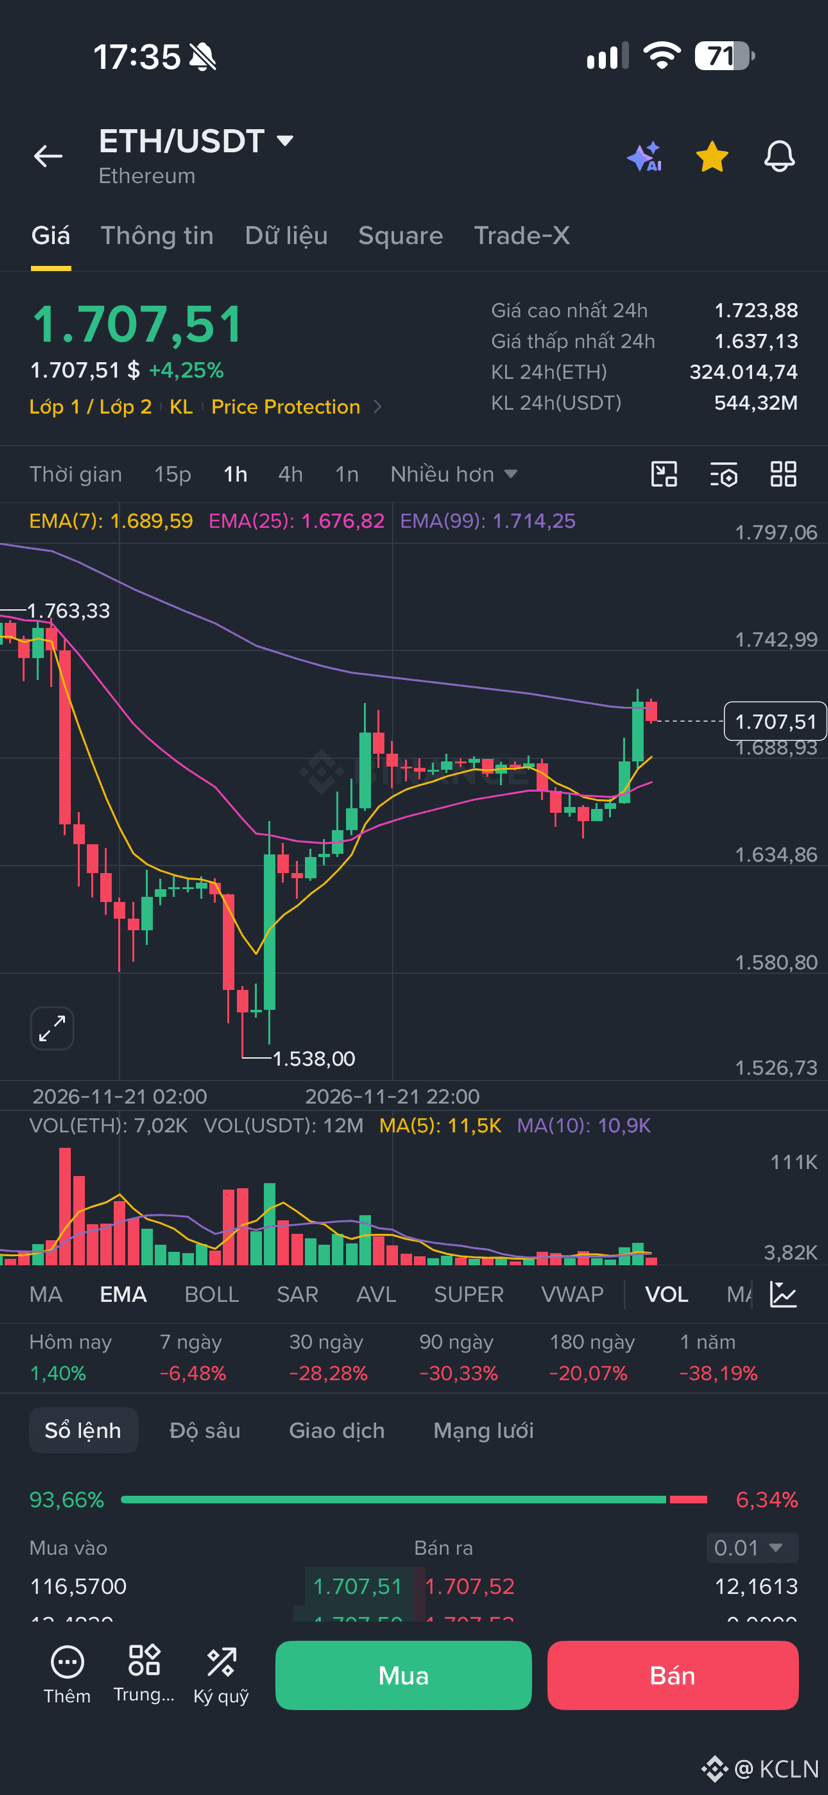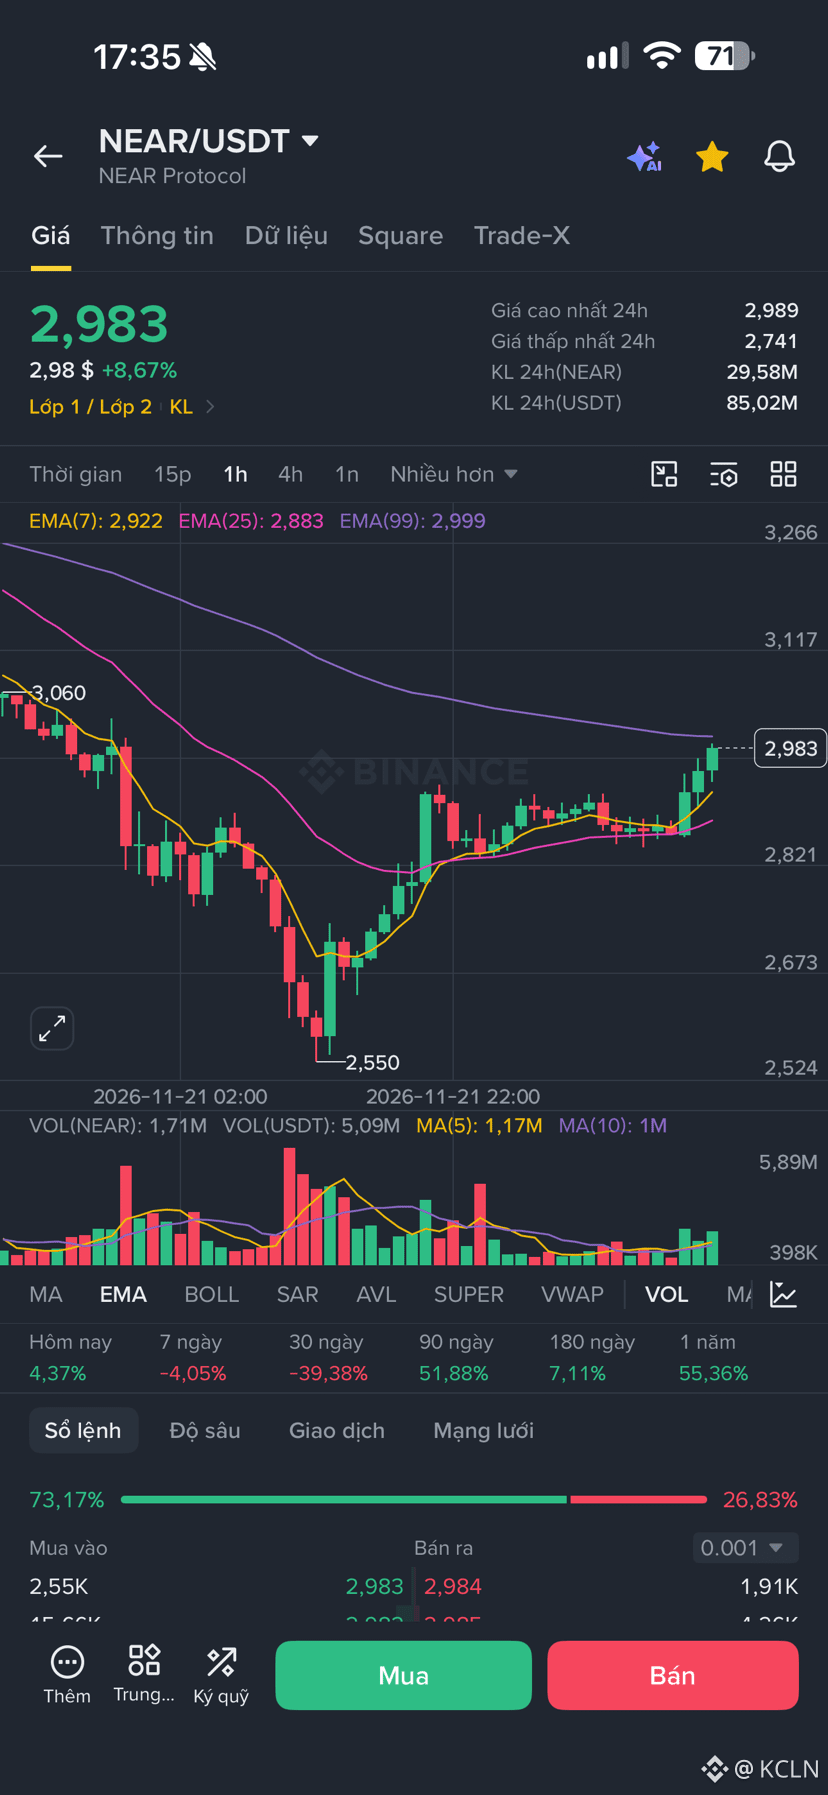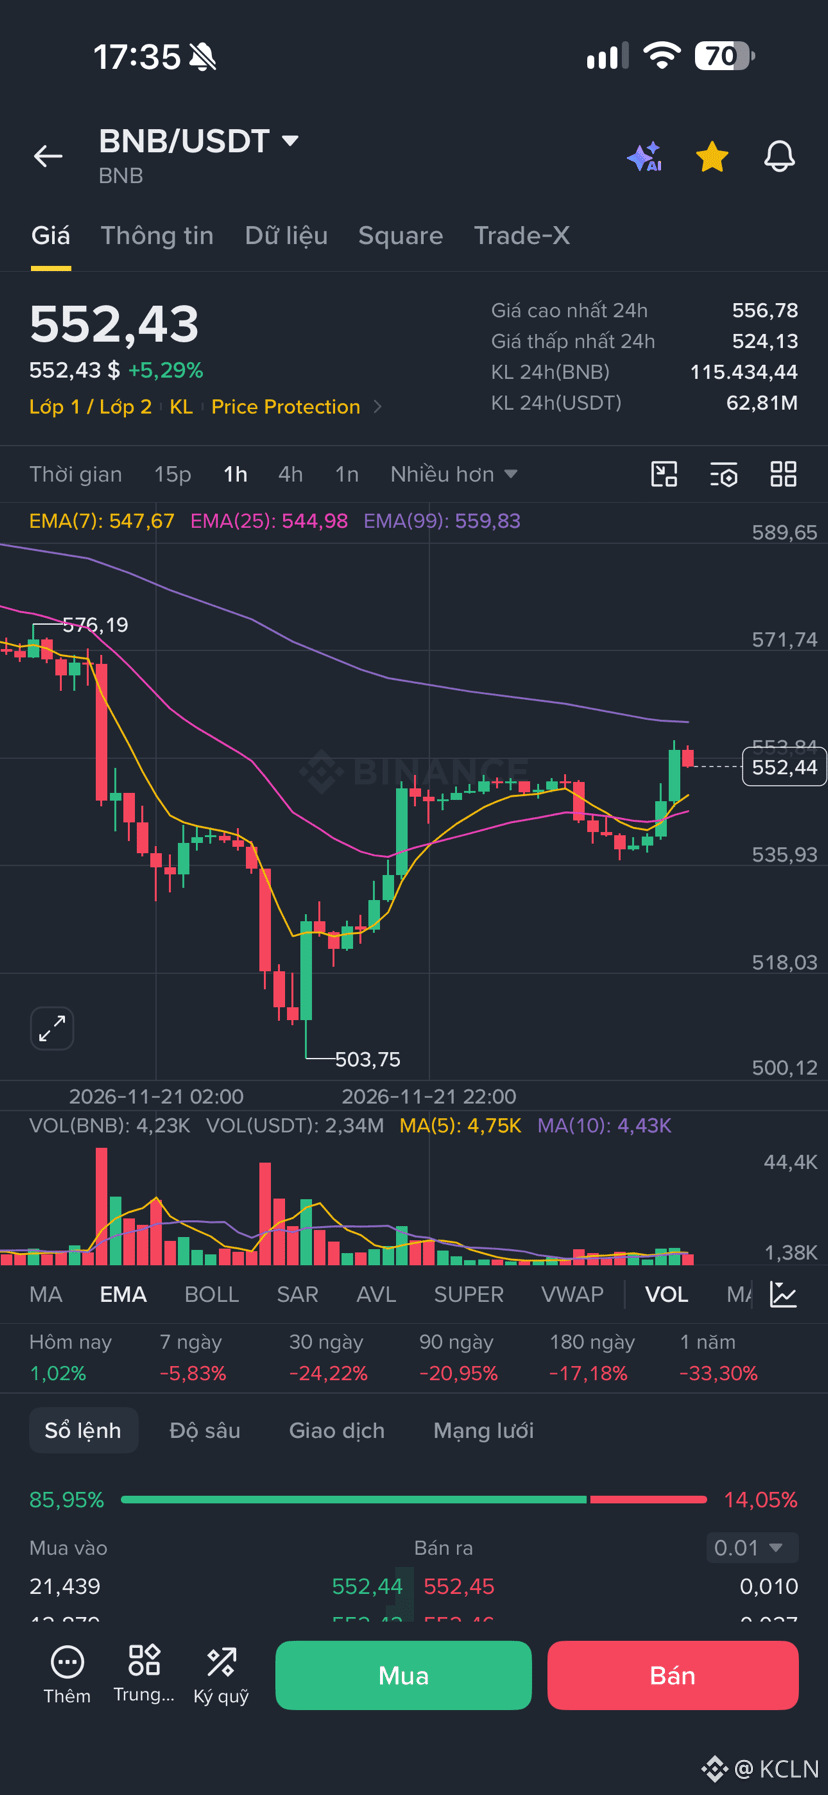
4 identical charts: $BTC $ETH BNB $NEAR 1H 17:35 22/11/2026
1. The truth behind the charts: One and the same driver
• BNB 552.43: Low 503.75 → rebounded to 556.78 = +10.5%. Price above EMA7 547.67 and EMA25 544.98, but rejected at EMA99 559.83. Order book: 85.95% Buy = retail FOMO.
• NEAR 2.983: Low 2.550 → high 2.989 = +17%. Broke above EMA7 2.922 and EMA25 2.883, touched EMA99 2.999, then pulled back with a wick. Order book: 73% Buy.
• ETH 1.707: Low 1.538 → high 1.723 = +12%. Touched EMA99 1.714, then pulled back with a wick. Order book: 93.66% Buy = extreme.
• BTC 60.719: Low 55.130 → high 61.365 = +11.3%. Touched EMA99 61.095, then pulled back with a wick. Order book: 88.79% Sell.
2. Undeniable commonalities
1. Same structure: Sharp dump on 19–20/11, V-shaped recovery on 21/11, then all touched the 1H EMA99 resistance and pulled back with wicks on 22/11.
2. Volume doesn't lie: Volume on the red dump candles was 4–6 times that of the green recovery candles. The rebound had no big money behind it.
3. Higher time frames are still red: 30 days: -24% to -39%. 90 days: -20% to -30%. A green 1H candle can't save the weekly trend.
4. Order books shifting: This morning ETH was 98% Buy; now BTC is 88% Sell and BNB is 85% Buy. Extreme imbalances = whales rotating orders to distribute.
3. Conclusion: Synchronized bull trap
This is a controlled technical rebound. Whales are pumping altcoins NEAR and BNB first to create an “altcoin rally” sentiment and lure retail into Long positions. BTC and ETH touched EMA99 to kill Shorts. Once retail is fully Long, they dump.
Confirmation levels for another drop:
• BTC closes 1H below EMA25 59.761
• ETH loses EMA25 1.676
• BNB breaks below 544.98
• NEAR loses 2.883
Trend reversal level:
BTC closes 1D above 62.179 with volume >3.5B. ETH closes 1D above 1.759. Neither has happened yet.
1. The truth behind the charts: One and the same driver
• BNB 552.43: Low 503.75 → rebounded to 556.78 = +10.5%. Price above EMA7 547.67 and EMA25 544.98, but rejected at EMA99 559.83. Order book: 85.95% Buy = retail FOMO.
• NEAR 2.983: Low 2.550 → high 2.989 = +17%. Broke above EMA7 2.922 and EMA25 2.883, touched EMA99 2.999, then pulled back with a wick. Order book: 73% Buy.
• ETH 1.707: Low 1.538 → high 1.723 = +12%. Touched EMA99 1.714, then pulled back with a wick. Order book: 93.66% Buy = extreme.
• BTC 60.719: Low 55.130 → high 61.365 = +11.3%. Touched EMA99 61.095, then pulled back with a wick. Order book: 88.79% Sell.
2. Undeniable commonalities
1. Same structure: Sharp dump on 19–20/11, V-shaped recovery on 21/11, then all touched the 1H EMA99 resistance and pulled back with wicks on 22/11.
2. Volume doesn't lie: Volume on the red dump candles was 4–6 times that of the green recovery candles. The rebound had no big money behind it.
3. Higher time frames are still red: 30 days: -24% to -39%. 90 days: -20% to -30%. A green 1H candle can't save the weekly trend.
4. Order books shifting: This morning ETH was 98% Buy; now BTC is 88% Sell and BNB is 85% Buy. Extreme imbalances = whales rotating orders to distribute.
3. Conclusion: Synchronized bull trap
This is a controlled technical rebound. Whales are pumping altcoins NEAR and BNB first to create an “altcoin rally” sentiment and lure retail into Long positions. BTC and ETH touched EMA99 to kill Shorts. Once retail is fully Long, they dump.
Confirmation levels for another drop:
• BTC closes 1H below EMA25 59.761
• ETH loses EMA25 1.676
• BNB breaks below 544.98
• NEAR loses 2.883
Trend reversal level:
BTC closes 1D above 62.179 with volume >3.5B. ETH closes 1D above 1.759. Neither has happened yet.