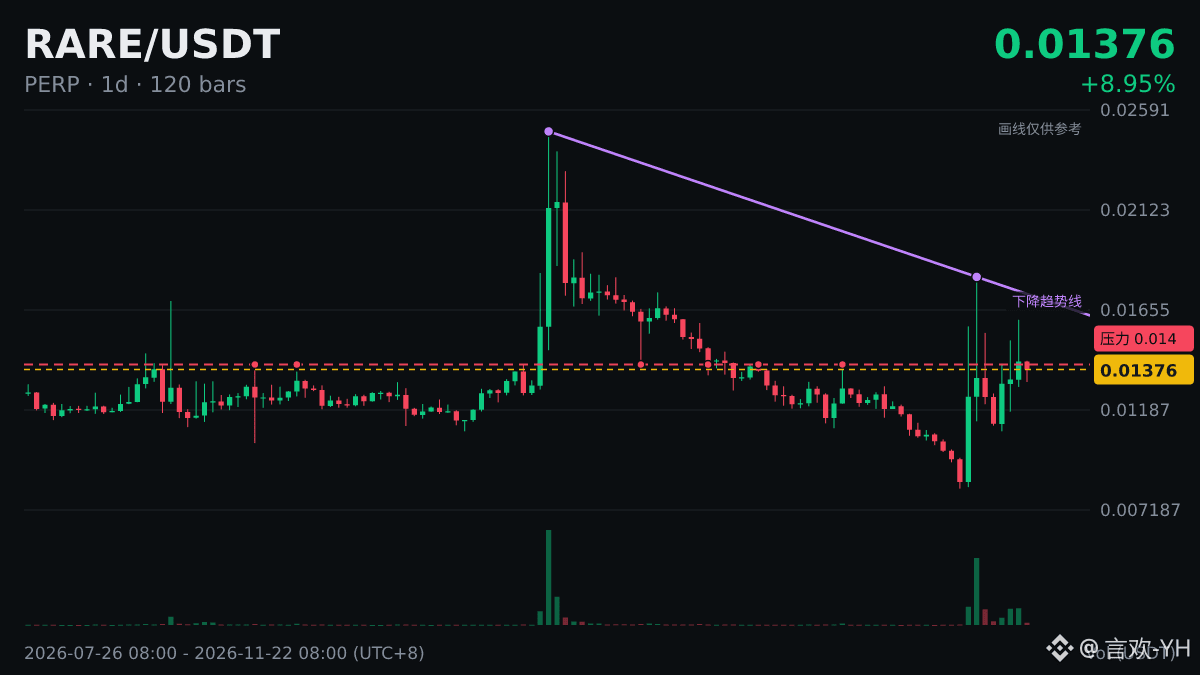
$RARE The daily chart has moved above MA200 (0.01348), with the current price at 0.01406.
The daily MA200 has long been seen as the dividing line between bull and bear markets. After moving above it, the key is whether the price can hold near the moving average on a pullback. If it does, the structure turns stronger.
Indicators are a reference, not an on/off switch. Ultimately, it comes down to the price itself. Which side are you on? Let us know in the comments.
The daily MA200 has long been seen as the dividing line between bull and bear markets. After moving above it, the key is whether the price can hold near the moving average on a pullback. If it does, the structure turns stronger.
Indicators are a reference, not an on/off switch. Ultimately, it comes down to the price itself. Which side are you on? Let us know in the comments.