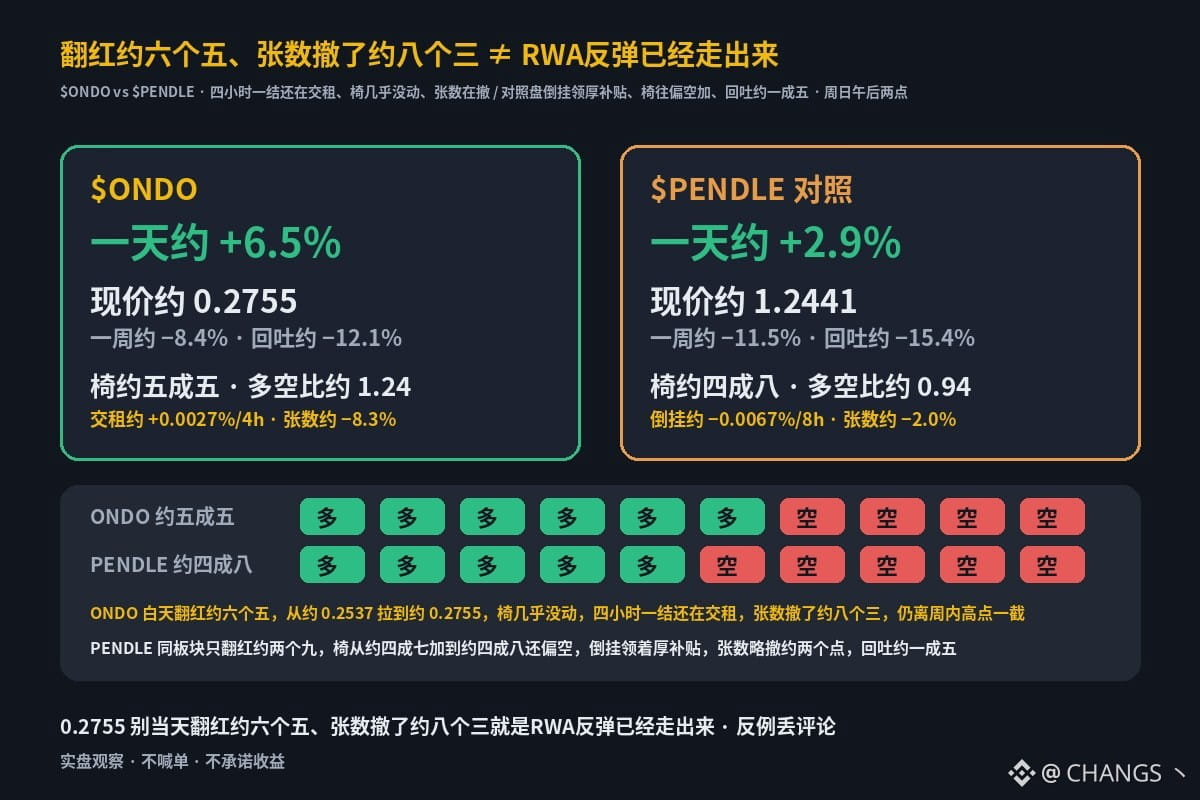
Sunday afternoon, with about two hours to go until the 4 p.m. funding payment, external markets are still closed for the weekend, and fear is still pinned around 11. Some people are taking tokenized assets turning green by about 6.5% during the day and contract counts dropping about 8.3% as proof that the RWA rebound is already underway, leverage has already been flushed out, and they can call it a day before the 4 p.m. funding payment. The ledger tells a different story: one asset has bounced from an intraday low of about 0.2537, coming close to its intraday high of about 0.2832; its long share is stuck at about 55%, barely moving, funding is still due every four hours, and contract counts are down about 8.3%. It remains well below the weekly high, having given back about 12%. Meanwhile, a peer in the same sector is up only about 2.9%; its long share has risen from about 47% to about 48%, but positioning is still net short. Shorts are being paid a hefty subsidy through inverted funding, contract counts are down slightly, by about 2%, and it has given back about 15%, leaving it deeper in its weekly trough.
$ONDO: about +6.5% over one day / about −8.4% over one week; current price about 0.2755. Weekly high about 0.3135; drawdown about −12.1%. Account long-short ratio about 1.24 (about 55% long; about one day ago it was about 1.27/56%, so the long share has barely moved). Funding about +0.0027% per 4h payment. OI contract count over the past day about −8.3% (USD-margined OI about −1.7%; contracts are being closed). Price bounced from an intraday low of about 0.2537, coming close to its intraday high of about 0.2832; current price is about 0.2755, still well below the weekly high. Don’t take a same-day gain of about 6.5% and an 8.3% drop in contract counts as proof that the RWA rebound is already underway; much less should you take a long share stuck at about 55%, with funding still due every four hours, as proof that leverage has been flushed out and you can call it a day before the 4 p.m. funding payment.
The peer, $PENDLE , is up about +2.9% over one day and down about −11.5% over one week. Current price is about 1.2441; weekly high about 1.4713; drawdown about −15.4%. Long share is about 48% (long-short ratio about 0.94; about one day ago it was about 0.88/47%, so the long share is rising). Funding is inverted at about −0.0067% per 8h, paying a hefty subsidy. OI contract count over the past day is about −2.0% (USD-margined OI about +1.5%; likely the price is up while contract counts have edged down). Price bounced from an intraday low of about 1.189, coming close to its intraday high of about 1.3001; current price is about 1.2441, still in its weekly trough. Its long share has risen from about 47% to about 48%, but positioning is still net short, with inverted funding paying a hefty subsidy.
One asset turns green by about 6.5% during the day, rising from about 0.2537 to about 0.2755, but has given back about 12%; its long share is stuck at about 55%, barely moving, funding is still due every four hours, contract counts are down about 8.3%, and it remains well below the weekly high. Meanwhile, a peer in the same sector is up only about 2.9%, has given back about 15%, and its long share has risen from about 47% to about 48% while positioning remains net short; inverted funding is paying a hefty subsidy, contract counts are down slightly, by about 2%, and it is deeper in its weekly trough. Is this proof that a gain of about 6.5% and an 8.3% drop in contract counts mean the RWA rebound is already underway and leverage has been flushed out? Or is it just one asset still in its weekly trough, with the long share barely moving, funding still due every four hours, and contract counts falling—while the comparison asset has given back about 15%, inverted funding is paying a hefty subsidy, and positioning keeps shifting further net short? Post counterexamples in the comments.
$ONDO: about +6.5% over one day / about −8.4% over one week; current price about 0.2755. Weekly high about 0.3135; drawdown about −12.1%. Account long-short ratio about 1.24 (about 55% long; about one day ago it was about 1.27/56%, so the long share has barely moved). Funding about +0.0027% per 4h payment. OI contract count over the past day about −8.3% (USD-margined OI about −1.7%; contracts are being closed). Price bounced from an intraday low of about 0.2537, coming close to its intraday high of about 0.2832; current price is about 0.2755, still well below the weekly high. Don’t take a same-day gain of about 6.5% and an 8.3% drop in contract counts as proof that the RWA rebound is already underway; much less should you take a long share stuck at about 55%, with funding still due every four hours, as proof that leverage has been flushed out and you can call it a day before the 4 p.m. funding payment.
The peer, $PENDLE , is up about +2.9% over one day and down about −11.5% over one week. Current price is about 1.2441; weekly high about 1.4713; drawdown about −15.4%. Long share is about 48% (long-short ratio about 0.94; about one day ago it was about 0.88/47%, so the long share is rising). Funding is inverted at about −0.0067% per 8h, paying a hefty subsidy. OI contract count over the past day is about −2.0% (USD-margined OI about +1.5%; likely the price is up while contract counts have edged down). Price bounced from an intraday low of about 1.189, coming close to its intraday high of about 1.3001; current price is about 1.2441, still in its weekly trough. Its long share has risen from about 47% to about 48%, but positioning is still net short, with inverted funding paying a hefty subsidy.
One asset turns green by about 6.5% during the day, rising from about 0.2537 to about 0.2755, but has given back about 12%; its long share is stuck at about 55%, barely moving, funding is still due every four hours, contract counts are down about 8.3%, and it remains well below the weekly high. Meanwhile, a peer in the same sector is up only about 2.9%, has given back about 15%, and its long share has risen from about 47% to about 48% while positioning remains net short; inverted funding is paying a hefty subsidy, contract counts are down slightly, by about 2%, and it is deeper in its weekly trough. Is this proof that a gain of about 6.5% and an 8.3% drop in contract counts mean the RWA rebound is already underway and leverage has been flushed out? Or is it just one asset still in its weekly trough, with the long share barely moving, funding still due every four hours, and contract counts falling—while the comparison asset has given back about 15%, inverted funding is paying a hefty subsidy, and positioning keeps shifting further net short? Post counterexamples in the comments.