Here’s the blunt truth.
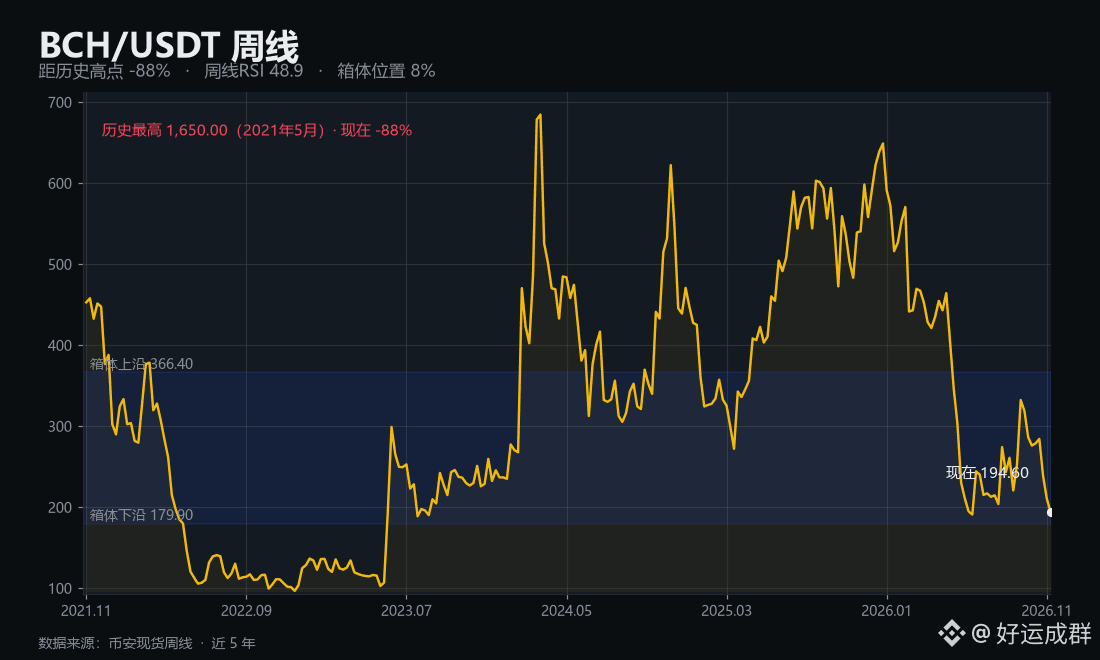
$BCH is currently priced at 194.60, down 88% from that all-time high of 1,650.00 in May 2021. This hole has already been dug for 288 weeks.
The weekly chart has closed below the 50-week moving average for 39 consecutive weeks, and after that previous kind of rally, it has never truly recovered.
Right now it is stuck near the lower end of the recent 24-week range of 179.90–366.40, about 8% above the bottom, with a weekly RSI of 48.9.
The 179.90 line is the dividing line. If it breaks decisively below it, the next level to watch is 165.51, and it’s not just about this one asset—the entire old coin sector will need to be on guard.
Remember this: falling a lot does not mean cheap; falling a lot just means falling a lot.
What do you think of $BCH ’s current position?
#BCH #山寨币 #review
$BCH is currently priced at 194.60, down 88% from that all-time high of 1,650.00 in May 2021. This hole has already been dug for 288 weeks.
The weekly chart has closed below the 50-week moving average for 39 consecutive weeks, and after that previous kind of rally, it has never truly recovered.
Right now it is stuck near the lower end of the recent 24-week range of 179.90–366.40, about 8% above the bottom, with a weekly RSI of 48.9.
The 179.90 line is the dividing line. If it breaks decisively below it, the next level to watch is 165.51, and it’s not just about this one asset—the entire old coin sector will need to be on guard.
Remember this: falling a lot does not mean cheap; falling a lot just means falling a lot.
What do you think of $BCH ’s current position?
#BCH #山寨币 #review