BTC at $59,300: Midday rebound loses steam despite funding just turning positive
As of 12:00, $BTC was trading around $59,307.80, up 5.4% over 24 hours but down about $858 from the $60,165.80 recorded at 08:00. $ETH was at $1,663.94, up 6.6%, also edging down from $1,682.77. The Fear & Greed Index remained at 11, in the extreme fear zone.
The rebound from the two-year low of $55,127 is losing steam mid-session. According to a report from CryptoQuant, investors realized more than $11.3 billion in losses over seven days, around eight times the gains realized over the same period; QCP Capital believes this was mainly short-covering, not necessarily fresh buying demand. Spot BTC ETFs continued to see net outflows for a third consecutive session, at around $582 million per session, according to SoSoValue.
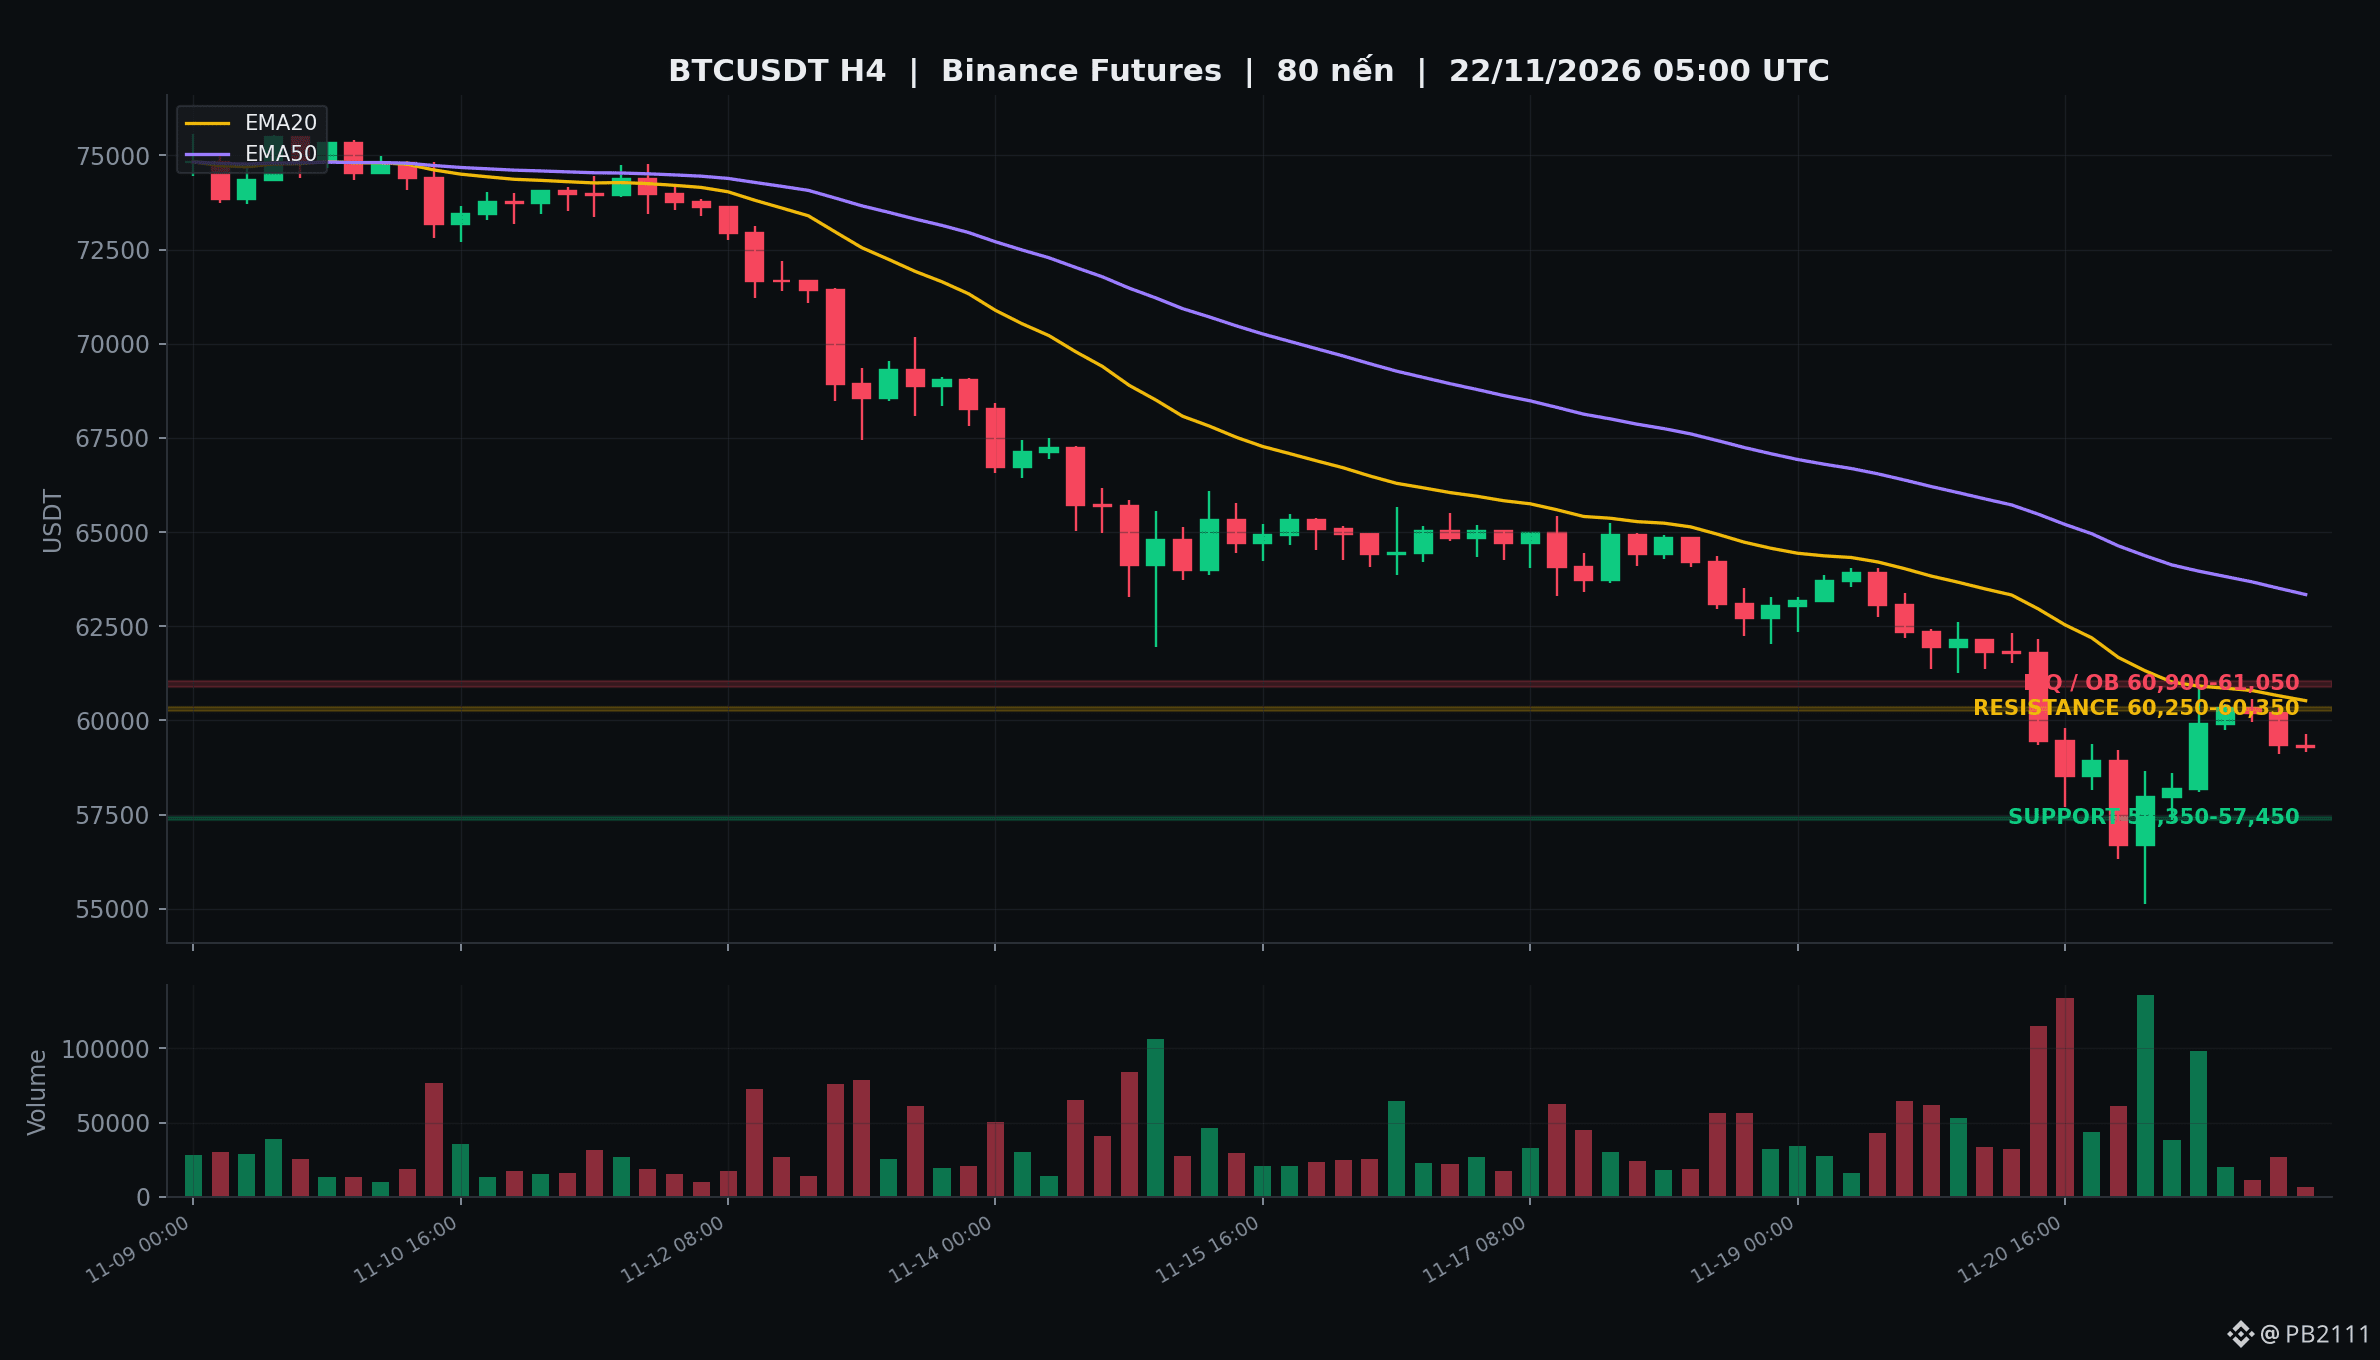
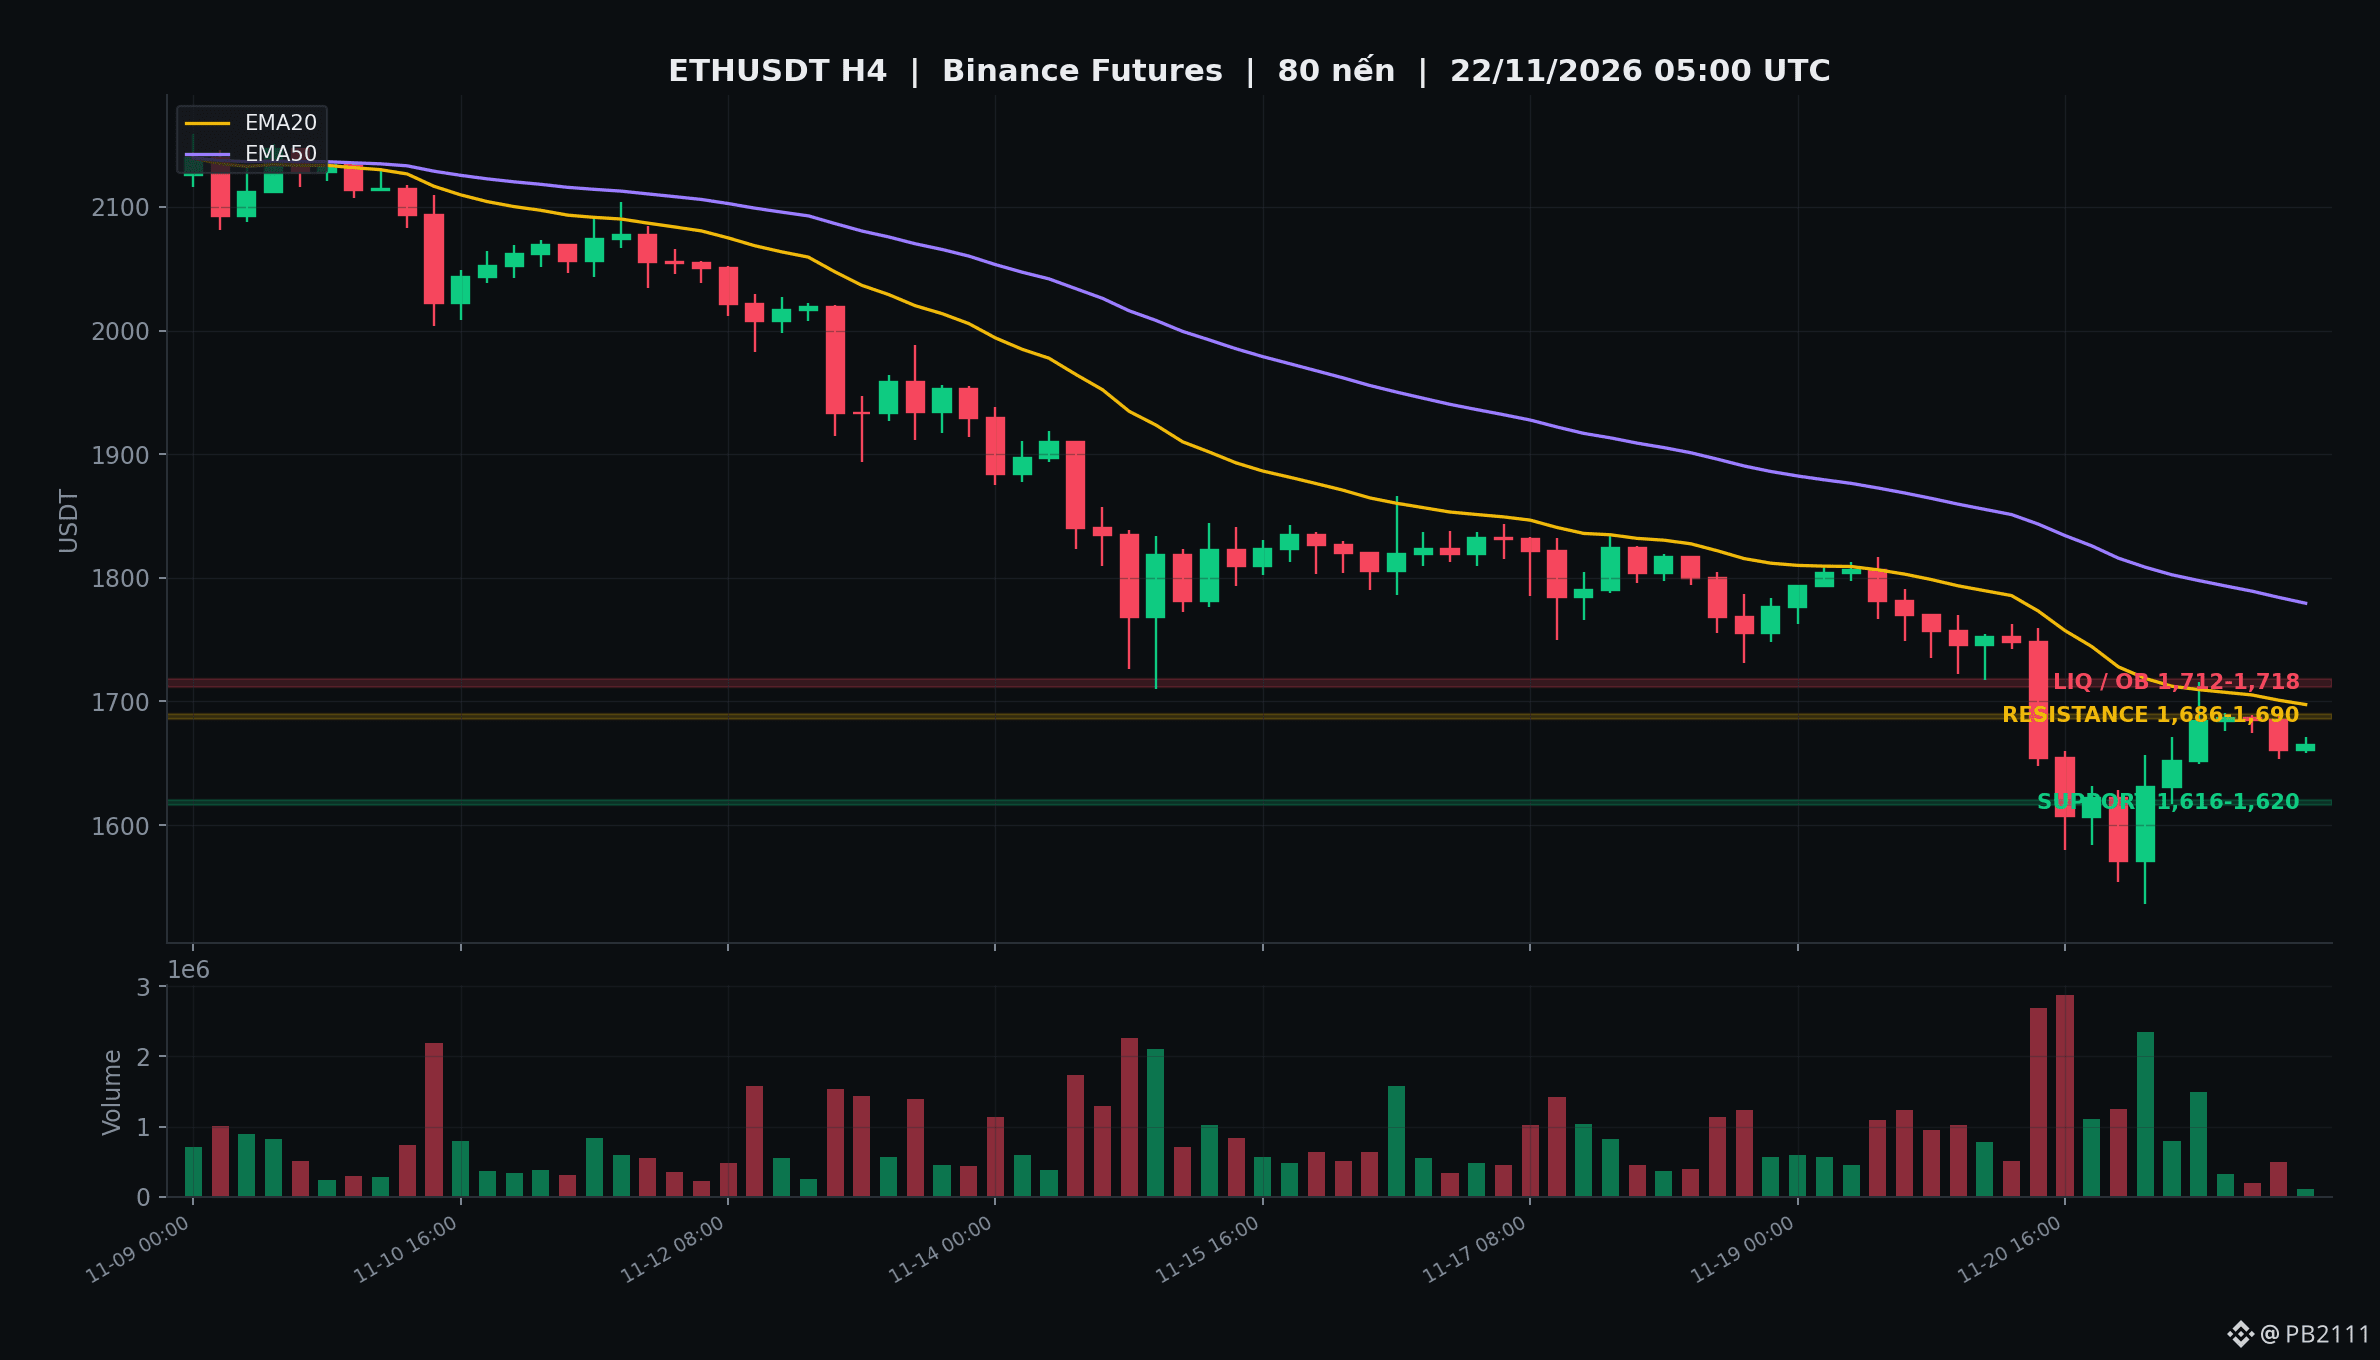
For BTC, 8-hour funding flipped from -0.0010% this morning to +0.0070%, with OI at 91,338 BTC. A notable signal is that the cost of holding positions has turned positive again. If support at 57,350–57,450 holds, the recovery structure remains intact; resistance at 60,250–60,350 coincides with the 60,978 high, with liquidity above at 60,900–61,050. For ETH, funding is +0.0003%, OI is around 2.32 million ETH, support is at 1,616–1,620, resistance at 1,686–1,690, and liquidity at 1,712–1,718.
Attached are H4 charts for BTCUSDT and ETHUSDT: EMA20/50, volume, the support zones at 57,350–57,450 (1,616–1,620 for ETH), resistance at 60,250–60,350 (1,686–1,690), and liquidity at 60,900–61,050 (1,712–1,718) are all clearly shown on the H4 timeframe.
Hold scenario: If BTC holds 57,350–57,450, it still has room to move toward 60,250–60,350. Breakdown scenario: A drop below 57,350 could lead to a retest of the 55,127 low; if ETH falls below 1,616, it could return to 1,543.
As long as ETF flows remain net negative, the recovery is still vulnerable to breaking down. Which scenario do you lean toward: holding or breaking down? $BTC $ETH #Bitcoin #Crypto #MarketAnalysis
As of 12:00, $BTC was trading around $59,307.80, up 5.4% over 24 hours but down about $858 from the $60,165.80 recorded at 08:00. $ETH was at $1,663.94, up 6.6%, also edging down from $1,682.77. The Fear & Greed Index remained at 11, in the extreme fear zone.
The rebound from the two-year low of $55,127 is losing steam mid-session. According to a report from CryptoQuant, investors realized more than $11.3 billion in losses over seven days, around eight times the gains realized over the same period; QCP Capital believes this was mainly short-covering, not necessarily fresh buying demand. Spot BTC ETFs continued to see net outflows for a third consecutive session, at around $582 million per session, according to SoSoValue.
For BTC, 8-hour funding flipped from -0.0010% this morning to +0.0070%, with OI at 91,338 BTC. A notable signal is that the cost of holding positions has turned positive again. If support at 57,350–57,450 holds, the recovery structure remains intact; resistance at 60,250–60,350 coincides with the 60,978 high, with liquidity above at 60,900–61,050. For ETH, funding is +0.0003%, OI is around 2.32 million ETH, support is at 1,616–1,620, resistance at 1,686–1,690, and liquidity at 1,712–1,718.
Attached are H4 charts for BTCUSDT and ETHUSDT: EMA20/50, volume, the support zones at 57,350–57,450 (1,616–1,620 for ETH), resistance at 60,250–60,350 (1,686–1,690), and liquidity at 60,900–61,050 (1,712–1,718) are all clearly shown on the H4 timeframe.
Hold scenario: If BTC holds 57,350–57,450, it still has room to move toward 60,250–60,350. Breakdown scenario: A drop below 57,350 could lead to a retest of the 55,127 low; if ETH falls below 1,616, it could return to 1,543.
As long as ETF flows remain net negative, the recovery is still vulnerable to breaking down. Which scenario do you lean toward: holding or breaking down? $BTC $ETH #Bitcoin #Crypto #MarketAnalysis